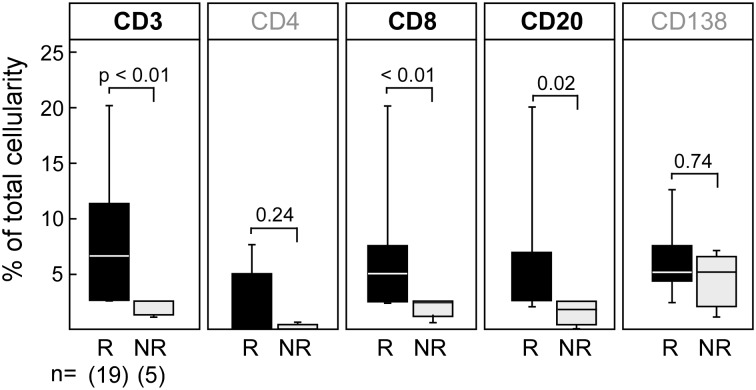
Figure 3.
CD8+ T-cell infiltrates are significantly increased in pretreatment marrow in responders. Quantification of immune cell subsets (CD3+, CD8+, CD4+, CD20+, CD138+) performed on marrow from responders and nonresponders before DLI therapy. Whiskers in box plots indicate maximum and minimum values. The line indicates median value; P values refer to responders (R) vs nonresponders (NR) comparison using the exact Wilcoxon rank-sum test.

