

1. Introduction
We are pleased to have been asked to contribute to this set of papers published in recognition of the career of Stephen Weiner and his extensive contributions to the field of biomineralization. Minerals formed within living organisms may have the same structural composition as geologic minerals, but they are especially interesting because the chemical composition and conditions of their formation are so different. Within the Earth, geochemically-driven, mineral crystals form at high temperatures and pressures in melts or via solid state crystallization under anhydrous conditions, whereas minerals of biogenic origin form and crystallize from aqueous environments at ambient temperatures and pressures. In this paper, we explore the various biologically relevant mechanisms proposed for crystallization of calcium phosphates, as apatite, and calcium carbonate, as calcite, in aqueous systems and the role of water molecules in these crystallization reactions.
Cygan et al. (Cygan et al., 2002) studied the interaction between water molecules and a calcite surface, and showed that water molecules complete the octahedral coordination of the Ca at the surface, with the water molecule lying essentially flat on the calcite surface with a mean Ca - Owater distance of 2.55Å. At the same time in response to this interaction with water, the water-liganded Ca at the crystal surface modulates the Ca – Ca distances over the next 2-3 atomic layers of the calcite, and actually stabilizes the carbonate mineral surface. To quote Navrotsky (Navrotsky, 2004) “The living world is wet; thus anhydrous biomineral surfaces do not exist”. Thus, at the atomic and nano levels, the interface between aqueous and solid phases is reciprocally modulated in each phase.
1.1. Progress in Our Understanding of Crystallization
The typical picture of crystal nucleation, from a kinetic point of view (Becker and Doring, 1935; Dreyer and Duderstadt, 2006), is that crystals form via monomer-by-monomer addition; where individual components of a crystal are combined together in the most energy favorable manner to form a 3D periodic array. This concept was the result of mathematical modeling and empirical studies of droplet formation (Becker and Doring, 1935; Dreyer and Duderstadt, 2006) in response to the thermodynamic, non-mechanistic, description of crystal formation attributed to J. W. Gibbs, which had emphasized the discontinuous transition of one phase into another upon overcoming a free-energy barrier. In this monomer-by-monomer addition model (Becker and Doring, 1935; Dreyer and Duderstadt, 2006) there are no stable intermediates between an amorphous phase and the crystal phase.
In practice, crystallization is a multi-step process where a stable solid phase emerges from an intermediate phase that formed from an earlier parent phase (Hedges and Whitelam, 2011). Long-lived intermediates along the continuum between ions and crystals have been proposed or seen and emphasized as precursors to crystal formation since the earliest experiments involving calcium salts (Brooks et al., 1950; Hunt, 1866). In recent years there have been several verifications that intermediates do exist (Addadi and Weiner, 1992; Baumgartner et al., 2013; Dey et al., 2010; Dorozhkin, 2010; Faatz et al., 2004; Gebauer et al., 2008; Larson and Garside, 1986a; Onuma and Ito, 1998; Politi et al., 2004; Pouget et al., 2009; Rieger et al., 2007; Sohnel and Garside, 1988).
One of the first departures from the monomer-by-monomer (ion-by-ion) to crystal picture in the process of biomineralization was data suggesting that a solid amorphous precursor, amorphous calcium phosphate (ACP), preceded the ultimately crystalline products hydroxyapatite (HAp) or carbonated apatite (cAp) (Eanes and Posner, 1968; Eanes et al., 1965). Posner proposed that ACP existed as a biologically generated precursor to the crystalline apatite found in bone (Blumenthal et al., 1981; Posner and Betts, 1975). But despite the fact that the presence of amorphous phases for both calcium phosphates and carbonates were known to exist biologically as storage deposits (Becker et al., 1974; Brown, 1982), other data questioned the utilization of ACP as a precursor to the biological HAp and cAp found in bone mineral (Glimcher et al., 1981).
Using Fourier Transform Infrared Spectroscopy (FTIR), Lowenstam and Weiner (Lowenstam and Weiner, 1985) reported the first evidence of ACP as a biologically generated precursor phase that transformed to cAp in the radular teeth of chitons. Their success in finding the elusive and transient precursor was due in part to their study of an organism with “continuously growing mineralized tissue where the initially formed minerals are well separated in space and time from subsequently formed deposits” (Lowenstam and Weiner, 1985). Similarly, evidence that biogenic amorphous calcium carbonate (ACC) could serve as a precursor to biogenic crystalline carbonates and not merely as a stable ion reserve or structural component (Lowenstam and Weiner, 1989) was shown in the developing calcitic spicules of sea urchin larvae (Beniash et al., 1997), in the larvae of molluscan bivalves (Weiss et al., 2002), and in calcitic sea urchin spines (Politi et al., 2004).
Evidence of ACP as a precursor to biogenic HAp or cAp in vertebrates remained elusive until the Addadi/Weiner group was able to demonstrate ACP as a precursor to biogenic cAp by studying continuously growing mineralized tissue, but this time in the fin of a vertebrate, the zebrafish (Mahamid et al., 2011a; Mahamid et al., 2008; Mahamid et al., 2010). Not long after that, through the use of cryogenic Transmission Electron Microscopy (cryoTEM) and freeze fracture techniques, the same group was able to identify transient amorphous precursors in mice (Mahamid et al., 2011a; Mahamid et al., 2011b). It was initially postulated that these amorphous aggregates were themselves composed of precursors, hydrated prenucleation clusters of ions and that the assembly of these clusters created a solid amorphous phase, with a subsequent re-arrangement of these clusters leading to the stable crystalline form, through either dissolution-reprecipitation (Boskey and Posner, 1973; Eanes and Posner, 1968; Pouget et al., 2009; Termine and Posner, 1970; Tung and Brown, 1983), or solid-state-transformation (Tao et al., 2008), or both.
Light-scattering and ultracentrifugation studies revealed the presence of aggregates or clusters in saturated ion solutions (Demichelis et al., 2011; Gebauer et al., 2008; Larson and Garside, 1986a; Larson and Garside, 1986b; Onuma and Ito, 1998; Posner and Betts, 1975; Sohnel and Garside, 1988) but direct TEM visualization of the prenucleation clusters in vitro has only recently been accomplished for calcium carbonate (Pouget et al., 2009), calcium phosphate systems (Dey et al., 2010; Habraken et al., 2013) and magnetite synthesis (Baumgartner et al., 2013). In vitro the initial small nano-clusters aggregate and grow as loose, un-coalesced masses, which when near a functionalized substrate, coalesce into large amorphous aggregates that subsequently densify and become crystalline, transitioning by fluctuations in the structure of the aggregate (Dey et al., 2010; Pouget et al., 2009). Protein crystallization studies have also revealed the presence of aggregated amorphous precursors prior to their crystallization (Vekilov, 2004; Vekilov, 2010). These amorphous precursors to protein crystallization are liquid-like and the transformation from the amorphous to the crystalline state clearly occurs within the liquid-like precursor phase. This transition from an amorphous liquid to a solid crystal occurs via fluctuations in both density and structure (Talanquer and Oxtoby, 1998; tenWolde and Frenkel, 1997; Vekilov, 2004; Vekilov, 2010).
1.2. The Complex Pathway to Crystallization
To generalize, the pathway to crystallization of a mineral or protein in aqueous solution can be sorted into a continuum of aggregated or coalesced states beginning with the free ions or molecules (pre-coalesced phase) at the start, and proceeding to a crystal (completely coalesced phase) at the end. As diagrammed in Figure 1 between these extremes one finds Ion Pairs & Small Clusters, Dense Liquid Clusters and Amorphous Aggregates all at varying degrees of coalescence. Each path is related to the particular conditions of a given experiment which determine the rates of formation and thermodynamic stabilities of the various intermediates as the intermediates densify and in some cases become structured. As illustrated, experimental data suggest that the proposed paths may intersect at many points. Selection of the pathway in the transition from free ions to crystals depends strongly on local kinetic factors, as discussed by Hedges, Whitelam, Lutsko, and Baumgartner (Baumgartner et al., 2013; Hedges and Whitelam, 2011; Lutsko, 2012).
Figure 1.

A conceptual map of various crystallization mechanisms found in literature that all follow classical nucleation theory, where the formation of a crystal is the result of a discontinuous phase transformation from one defined state to another. In the case of crystallization, this phase transformation can be broadly defined as the progression of a system of hydrated ions from pre-coalesced phase to a coalesced phase. The general non-mechanistic pathway as outlined by J. W. Gibbs is shown in the uppermost curve connecting pre-coalesced free ions to fully coalesced crystals. All other mechanistic descriptions (shown in hexagons) are diagramed with attributions (in circles) and distinguished by the various steps (designated by “road signs”) required (by the attributors) to achieve the transition from one state to another. The corresponding section of this article are labeled in red.
The map diagrammed in Fig. 1 covers paths in many “clean” in vitro crystallization situations in general, but becomes especially complicated for biogenic crystallization, which involves a path dependence on proteins, cells, vesicles and other organic components. In vitro biomimetic mineralization experiments show the great influence of the organic matrix containing both structural (collagen) and interactive components (additives, non-collagenous proteins, polymers) (Deshpande and Beniash, 2008; Liu et al., 2011; Nudelman et al., 2010; Olszta et al., 2007; Price et al., 2009) or non-equilibrium conditions where the supersaturation of ions is increased beyond physiological conditions (Wang et al., 2012). Where or how do these unique experimental conditions for biomimetic crystallization fit in the real in vivo processes of biogenic crystallization?
1.3. From the Pathways to Crystallization to the Mineralization of Collagen
Sixty years ago [1952] when our laboratory began its study of skin and tendon collagens the emphasis was on the composition and structure of the collagen molecule, how the molecules assembled into fibrils, and how they were stabilized in tissues by cross-link formation. By 1960 it was known, from the work of Boedtker and Doty (Boedtker and Doty, 1956) that the molecule was comprised of three individual polypeptide chains. The x-ray diffraction and modeling studies of Ramachandran (Ramachandran and Kartha, 1954; Ramachandran and Kartha, 1955) and Rich & Crick (Rich and Crick, 1955) showed that the molecule was in a triple-helical conformation. Electron microscopy of soluble collagen had advanced so that Hall and Doty (Hall and Doty, 1958) could visualize the intact collagen as a rod-like particle with a length of ∼300 nm. We began to ask the physiologically important questions of how the collagen matrix of bone and dentin became mineralized, and why the supposedly identical collagen of skin and tendon did not? Was the collagen of the soft tissues intrinsically different from that of bone and dentin, or were there tissue specific non-collagenous factors involved?
We chose to study dentin as a simple mineralized tissue not subject to turnover, and to compare that with non-mineralizing tendon. That work (Veis and Schlueter, 1963) led to the discovery of a then unique highly phosphorylated dentin protein absent in tendon and skin. This protein was named phosphophoryn, but is now known as dentin sialophosphoprotein (DSPP), comprised of two distinct domains, sialylated DSP and phosphorylated DPP. The discovery of DPP became the starting point in our investigations of the mechanism by which the DPP portion could be involved in the mineralization and led us to focus on the specific role of the acidic, phosphorylated proteins in biomineralization of the collagen matrix. Further studies in many laboratories demonstrated that bone also contained a number of proteins related to DPP that might have similar functions, and, following the pioneering studies of Weiner (Weiner and Hood, 1975) demonstrating the similar important role of acidic proteins in the development of calcium carbonate containing mineral shells and spicules of invertebrates, we hypothesized that there might indeed be commonalities in all “biomineralization” mechanisms (Veis and Sabsay, 1982).
Although physical chemists have long proposed that water has unique properties as an essential ingredient making life possible (Henderson, 1913), it is usually left out of the discussions of biomineral formation. The purpose of this paper is not to review the literature on biomineralization mechanisms, but rather to present a careful examination of the role of water and its hydration layers that may bring clarity to the network of routes shown in Figure 1.
1.4. The Structure of this Paper
This paper is intended to explain how Figure 1 can exist, and how the studies that lead to the construction Figure 1 can help us to understand the mineralization of collagen both with and without the intervention of additional macromolecules. For the context of the discussion found within this paper we have provided a table (supplemental materials Table S1) of essential definitions of key terms used throughout this paper. Sections 2 and 3 are designed to be an introduction to water as a participant, discussing the nature of interactions between water and ions, the relative energies involved, and what it means for ions and macromolecules to exist in an aqueous environment. Section 4 is designed to explain how Figure 1 is possible. Section 4 explains the first two pathways in Figure 1, gives a brief overview of both the kinetic, and the thermodynamic considerations of crystallization, and introduces the concept of what has been described, by some, as the dense liquid phase. In section 5 we explain the likely make up of the dense liquid phase and the mechanism by which water likely plays a critical role in the structure and regulation of the dense liquid phase. Section 6 explains the various pathways to crystallization seen in Figure 1 through the lens of bound water and the dynamics of changing hydration layers. We do this by correlating the data found in selected works, and tie the experimental results of those works to the unifying mechanism of regulating the formation and removal of bound water. Section 7 then brings together our understanding of the behavior of water, crystal formation, and Figure 1, to address the mineralization of collagen with and without the aide of polyelectrolytes.
2. Water as a Participant
The unique properties of water arise from the extended hydrogen bonded networks that form between water molecules. The nature of these networks of water depend on the ambient temperature and pressure, the extent and nature of the solutes present, and the solute-water molecule interfaces created. In the literature, the terms “free” or “bulk” water have been used interchangeably to describe the least perturbed state, while “bound” or “hydrated” water interchangeably describe the more constrained water networks near all solute-water interfaces. We follow literature practice and use these different terms depending on the context of the discussion.
The pathway(s) to crystal formation in aqueous systems are determined by hydration layers around these ions. The collapse and reorientation of these structures (their densification, or peeling away the layers of water) control what may be happening in biogenic crystal formation. Once we understand how water behaves in its interaction with free ions to form hydrated ions in free water we can examine the role of biopolymers, synthetic polymers, and water, and how hydration layers on such interfaces may contribute to biogenic crystal formation. Finally, we examine a few examples of successful in vitro biomineralization systems that have employed different approaches to collagen mineralization and see how the consideration of water may explain their success.
2.1. Metal Ions
Ionic hydration is an exothermic process. The introduction of a gaseous metal to water releases energy equivalent to the enthalpy of hydration of that ion (Richens, 1997).
| (Eqn. 1) |
ΔH°hyd the enthalpy of hydration is correlated to the bond energy between the metal and the water ligands (Richens, 1997).
| (Eqn. 2) |
Equation 2 is the result of a linear fit generated by standard tables of ΔH°hyd for metal ions from a gaseous state to a hydrated state, where z = charge of the metal and reff = the ionic radius in pm plus 85 pm (O atom) (Richens, 1997).
The significance of Eqn 2 can be seen in the example of considering the enthalpy of solution/dispersion of an anhydrous metal salt in water (ΔH°hyd = ΔH°crystallization +ΔH°soln or ΔH°hyd = ΔH°ligation +ΔH°disp). In order to dissolve anhydrous CaCl2, one must overcome the enthalpy of crystallization for calcium chloride ∼539 kcal/mol (∼2256 kJ/mol). Considering the enthalpy of hydration for both calcium (∼−382 kcal/mol (∼−1598 kJ/mol) approximated from Eqn. 2) and chloride (∼−174 kcal/mol (−728 kJ/mol), −87 kcal/mol per chlorine ion), the interaction with water provides −556 kcal/mol (−2327 kJ/mol) as approximated using Eqn. 2, more than enough energy to dissolve the CaCl2 crystal with −17 kcal/mol (−71 kJ/mol) remaining as the enthalpy of solution (ΔH°soln = −19 kcal/mol (−81 kJ/mol) actual value) and dissipated as heat. In the case of a 1-2 M calcium chloride solution, the resulting heat is very noticeable as the solution becomes exceptionally warm upon the dissolution of the salt in water. In the case of a 1-2 M magnesium chloride solution, the water has been known to boil, and there is even an audible sizzling, hissing sound as the water comes in contact with the powdered salt.
Cations/metals are Lewis acids, electron pair acceptors. Conversely oxygen atoms are Lewis bases, electron pair donators, making water and oxyanions such as carbonate and phosphate, ligands to the cations. When in water, the cations interact with the lone electron pairs on the oxygen of each water molecule to form dative (co-ordinate covalent) bonds in a complex known as an “aqua ion”(Richens, 1997). The number and configuration of these co-ordinate bonds to water will vary based on the size, charge, orbital configuration, and concentration of the cation (Richens, 1997). According to Eqn 2, the strength of the M-O bond is not only proportional to the charge of the cation, but is also inversely proportional to the size of the cation. Calcium atoms have a range of possible coordinated waters in the first hydration layer that depend on concentration, from ∼10.0 ± 0.6 at 1 M [Ca2+], to 7.2 ±0.6 at 2.8 M [Ca2+] to 6.2 ± 0.3 at 4.5 M [Ca+] (Richens, 1997), the larger the coordination number the greater the effective distance between the metal center and the oxygen atom, leading to a weaker M-O bond. The lower the coordination number for a given metal center the more defined and tightly held the hydration layers, than the same metal center with a higher coordination number. Magnesium, with a radius of 66-72 pm (as opposed to calcium 89-114 pm) (Richens, 1997), tends to be coordinated to only 6 waters at any one time with a rigid octahedral geometry (Ikeda et al., 2007; Richens, 1997). The differences between the hydration of Ca and Mg can be seen biologically with the rigid Mg2+ generally participating in more stationary roles: ATP hydrolysis (Ikeda et al., 2007), nitrogen fixation and photosynthesis in cells, while the more labile calcium is mobile, acting as a cellular factor, triggering such actions as nerve impulses and muscle contraction (Addadi and Weiner, 1992; Richens, 1997). The behavior and structure of water around various cations likely correlates with the ability of organisms to selectively sort such ions, discriminating between Sr, Ca, Mg and Na, such as excluding Mg from some regions of a mollusk's shell while growing the shells in Mg rich seawater, or marine protozoans selectively filtering Sr to build their shells (Addadi and Weiner, 1992).
The correlation between coordination and how tightly metals bind to the water can also be seen in the inverse in the binding energy of a water molecule with the number of coordinated waters to the metal ion. The more waters bound to the metal center the easier it is to remove a single water molecule from that hydration shell. From the view point of ab-initio calculations correlated with experimental data these differences are not linear, it requires only ∼15 kcal/mol (62.8 kJ/mol) to remove a single water molecule from a Ca2+ liganded to a full 1st shell of 10 water molecules; while successive removal of the 2nd, 3rd and 4th waters from the 1st shell are each ∼20-22 kcal/mol (∼83-92 kJ/mol) (Lei and Pan, 2010; Pavlov et al., 1998). Subsequently it requires 24.7 kcal/mol (∼103 kJ/mol) to remove the 6th water in the 1st shell and ultimately 56.9 kcal/mol (∼238.2 kJ/mol) for the removal of the final water in the 1st shell (complete dehydration) (Lei and Pan, 2010). The binding energies however do not directly correlate with the relative free-energy of the hydrated metals. As can be seen in Fig. 2, the free-energy states of a Ca2+ coordinated to 5 waters or to 8 coordinated waters are roughly the same at ΔG ≈ 9 kcal/mol (∼37kJ/mol) compared to the free-energy minimum of Ca2+ coordinated to 6.1 waters (Ikeda et al., 2007) despite the distinctly different binding energies for those waters. The Mg2+ aqua ion on the other hand, has two local free-energy minima at 5.1 and 6 coordinated waters, and the free-energy state of 5 coordinated waters to Mg2+ and an 6.5 coordinated waters to Mg2+ are roughly the same at ΔG ≈10 kcal/mol (∼42kJ/mol) compared to the minimum of 6.0 coordinated waters (Ikeda et al., 2007). These data show that for a given cation, the energy landscape which dictates hydrated free-energy of that cation will be different from any other cation.
Figure 2.
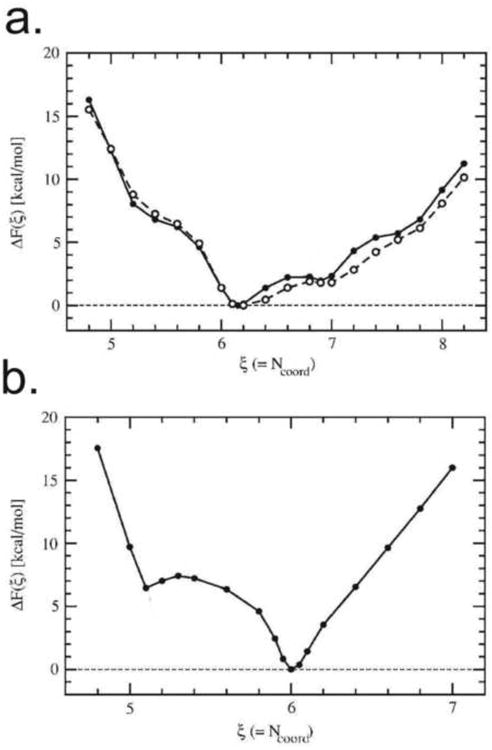
The relative free energy of hydration (kcal/mol) (Ikeda et al. use ΔF in lieu of ΔG) as compared to a global minimum set to zero, plotted as a function of water coordination number for both calcium (a) and magnesium (b). reprinted with permission from (Ikeda et al, 2007)
The waters that are coordinated to the metal ion are effectively immobilized with respect to the bulk water, bound in a hydration layer (Fig. 3 & 4). These waters have an orientation such that the hydrogen atoms on the water molecule extend outward from the O-M bond. These hydrogen atoms serve as hydrogen-bond donators and structure nearby water through hydrogen-bonding to form a 2nd hydration layer. The general trend seems to be that the maximum number of waters in the second shell is twice the number of waters in the 1st shell (1 for each hydrogen on each primary shell water), but the number can be less if waters in the 2nd layer are used to bridge together waters from the 1st layer. Because of the distance from the central metal atom, this 2nd layer (if present) has the same reactivity for every aqua ion, regardless of the central metal ion (Richens, 1997). The degree of order, the stability and even the presence of additional hydration layers are dependent on the size and charge of the central metal ion, a Li ion barely has a 1st hydration layer and no 2nd layer, where as a Mg layer has a well-defined 1st and 2nd layer (Richens, 1997). The 3rd hydration layer, due to size and variable orientations of the waters in the 2nd layer, tends to be less organized and less defined, forming a ‘fault zone’ (Burgess, 1978) (Fig. 3), separating the ordered water of the 2nd hydration layer from the disordered bulk water.
Figure 3.
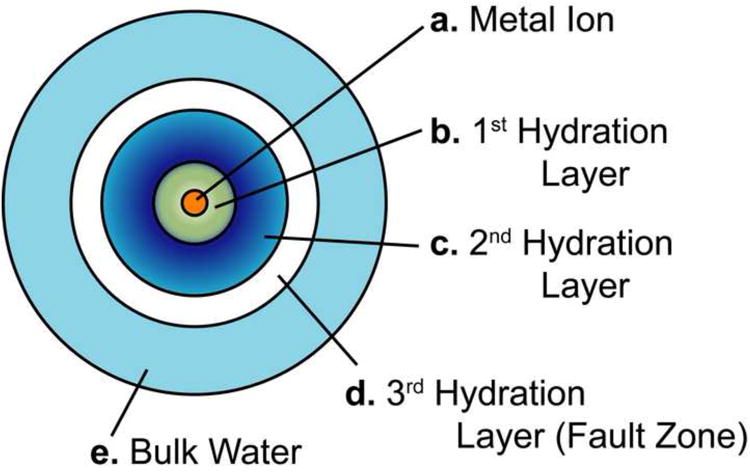
A diagram of hydration layers around a metal ion (a) showing the first (b), second (c) and third (d) hydration layers surrounded by bulk water (e).
Figure 4.
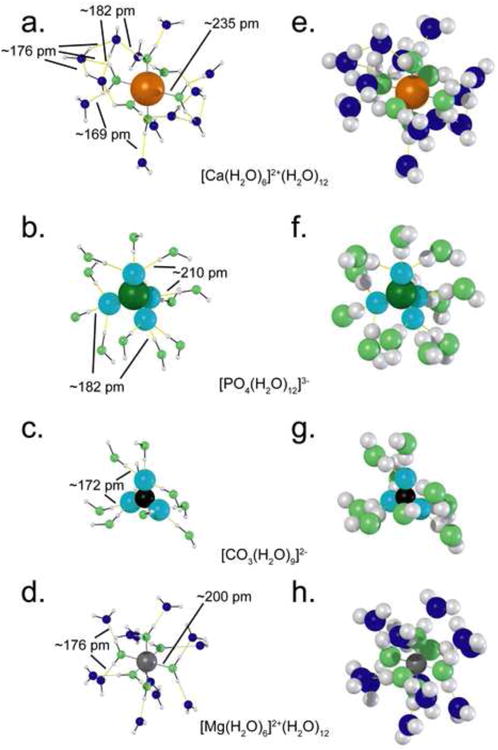
Reconstruction of the arrangement of water around four ions: calcium (a. & e.), phosphate (b. & f.), carbonate (c. & g.), and magnesium (d. & h.). a.-f. show reduced sized water molecules to highlight bond angles and molecular arrangements. e.-h. show full sized water molecules to demonstrate space-filling and crowding by the water molecules. These configurations illustrate the momentary immobilization of water around these ions. The oxygens of the 1st layer waters are shown in light green, the oxygens of the 2nd layer waters are shown in dark blue. Center-to-center bond lengths for a given aqua-ion are the same for both sets of renderings. (Pavlov et al, 1998, Pribil et al, 2008)
The degree of interaction between metal ions and water and the relative order imposed on the water by these metal ions are key factors when considering the local entropy of the system. Entropy is important since every ion, every substrate in water affects the local order of the water and thus affects the entropy. The values of hydration entropy for metal ions can be found in standard tables, as well as the specific entropy values associated with the kinetics of water exchange with certain metal ions (Burgess, 1978). As a frame of reference the standard molar entropy for liquid water is 16.7 cal mol−1K−1 [70 J mol K−1] with the “entropic cost of transferring a single water molecule to a site in which it is relatively immobile in ice or in a crystalline salt is at most -7 cal mol−1 K−1 [−29 J mol K−1], corresponding to a free energy cost of about -2.1 kcal/mol [−8.7 kJ/mol}at 300 K” (Dunitz, 1994). Compared to the M-O bond energies typical entropic penalties are low, only ∼−10 cal mol−1 K−1 [−42 J mol−1 K−1] or −3 kcal/mol [−12.5 kJ/mol] at 300 K per hydrated water molecule on metal ions (Dunitz, 1994). In general, the larger the cation within a group in the periodic table the less ordered the water will be around that ion. The important association to make is that anything that leads to more local ordering (such as a stronger interaction between molecules) will lead to a loss of entropy. Anything that leads to less local ordering (such as weaker or lack of interactions between molecules) will lead to a gain in entropy (Gallicchio et al., 1998).
2.2. Water And Ligands
The hydration shells of cations are easy to conceptualize, with the 1st layer of water oriented with the oxygen atoms toward the metal center formed by the donation of the lone pair of electrons (dative bond) on the oxygen, and the picture of distinct layers or spheres as seen in Fig. 3 easily comes to mind. The picture is less clear for anions. Water and oxyanion ligands depending on their level of protonation can be hydrogen bond donors/acceptors. Like cations, these ligands also associate with water, but not through dative bonds. The H-bonding between water and oxyanion ligands is not as restrictive, making the 1st hydration layer less stable and more easily rearranged than that the water found in the 1st hydration layer of cations. While the 2nd hydration layer of the cation consists of H-bonded waters attached to the 1st layer, in the case of oxyanions the conceptual delineation of hydration shells becomes blurred. Since the oxyanion is typically hydrogen bonded to the waters in the 1st layer, the subsequent 2nd layer, if any, is a combination of externally introduced waters, H-bonding to the 1st shell (similar to the 2nd layer of water for cations), and looping waters that connect the existing waters within the 1st layer to each another or back to the oxyanion. Because of this H-bonding, there is a change increase in the structural order of water around oxyanions, thus entropy is also an important factor when thinking about the hydration of oxyanions.
Several computational models using density field theory (DFT) have been used to calculate the number of waters in the various hydration layers of phosphates, carbonates, and sulfates (Pribil et al., 2008; Vchirawongkwin et al., 2007; Vchirawongkwin et al., 2011). Table 1.
Table 1. Oxyanion coordination.
| Oxyanion | Coordination Number | Reference |
|---|---|---|
| Phosphate | ||
| PO43− | 12-16 | (Brandan et al., 2007; Ebner et al., 2005; Pribil et al., 2008) |
| HPO42− | 10-20 | (Brandan et al., 2007; Ebner et al., 2005) |
| H2PO4− | 10-20 | (Brandan et al., 2007; Ebner et al., 2005) |
| Carbonate (CO32−) | 9 | (Kerisit and Liu, 2010; Vchirawongkwin et al., 2011) |
| Sulfate (SO42−) | 8-14 | (Vchirawongkwin et al., 2007) |
2.3. Water Exchange/Residence
The extensive hydrogen bonded networks formed in bulk water at ambient temperatures, with a strength of only ∼4.3 kcal/mol (∼18 kJ/mol), are responsible for the unusual properties of liquid water such as its high viscosity and high surface tension. The lability, or marginal stability, of the H-bonded networks are responsible for the liquid character, and are determined by the time scale of the rapid formation and dissociation of these randomized networks of hydrogen bonds, and can be measured by the water orientational relaxation times or water-water exchange rate or residence times. This orentational relaxation time is the time it takes for the orientation of one molecule with respect to another (interacting by either dipole interactions or H-bonding) to change. In several studies the relaxation times range from 1.7 ps (Pribil et al., 2008; Vchirawongkwin et al., 2007), to 2.6 ps (Fayer, 2012) to 10 ps (Burgess, 1978). However, these relaxation times are very dependent on, and slowed (from 2.6 ps to ∼15-20 ps) by the presence of interfaces of all sorts, from hydrophobic surface films, to organic macromolecules (regardless of being charged or uncharged), and when set in the structure of the hydration layers around inorganic cations and anions (Fayer, 2012).
The residence times for water molecules on cations are significantly longer than they are for ligands (water-oxyanion or water-water interactions). The common energies involved with the dative water-metal bonds are about 4-12 times greater than a water-oxyanion hydrogen bond, with water residence times as little as 50 times longer, to as much as 450 times longer for water on calcium ions. The exchange rates for water with the metal ion are dependent on the size, charge and orbital configuration of the metal ion, with transition metals having some of the longest residence times. Calcium for instance has water residence times of 100 ps to 90 ns, while magnesium which is smaller and more soluble, has water residence times of 2 μs to 50 μs (Richens, 1997). While the M-O bond energies correspond to the differences in solubility between two different cations bound to the same type of ligand, the residence times correspond to the reactivity of the ion and likely the differences seen in the kinetics of dissolution and precipitation.
It is important to note that residence times are the measure of how long a water molecule exists at a given place and not necessarily how long it takes for a bound water to transition to a free water. For instance, if a water residing in the 1st hydration layer leaves (enters the 2nd hydration layer) and then returns after a minimum time t* (typically 0.5 ps) (Kerisit and Liu, 2010; Pribil et al., 2008; Vchirawongkwin et al., 2011), then the residence clock for that water molecule is reset. So a given water molecule may leave the 1st hydration layer, transition to the 2nd hydration layer, and later return without ever having left the aqua ion. This means that there can be multiple exchanges of the same water molecule between the 1st and 2nd hydration layer of the metal ion before it eventually exchanges with the 3rd hydration layer and ultimately assumes the bulk water state. This also means that the total time for a particular water molecule to exist in a bound state on an aqua ion, as a whole, can be greater than the orientational relaxation time for that water molecule interacting with the aqua ion.
The phosphate and carbonate oxyanions interact with water in a way similar to one water molecule interacting with another, resulting in relaxation times that are on the same order as bulk water-water interactions. For sulfate the relaxation time is ∼ 2.5-3.5 ps (Pribil et al., 2008; Vchirawongkwin et al., 2007), for phosphate the relaxation time is ∼4 ps (Pribil et al., 2008) and for carbonate the relaxation time is ∼8 ps (Kerisit and Liu, 2010); these differences in residence time between sulfate, phosphate and carbonate, though small, are a measure of the ions' relative reactivity. Such differences in reactivity can partially contribute to the differences in the kinetics of dissolution between carbonate minerals and phosphate minerals that possess the same cation.
The movement and interaction of water around oxyanions and cations has been compared to the well-established SN1 and SN2 dichotomy used for reactions in organic chemistry, leading to three basic types of reactions: associative (A) where a cation bonds with a ligand, dissociative (D) where a bond is broken between a cation and a ligand, and interchange (I) where there is an exchange of the ligand on a cation for another ligand; and any number of intermediates along the way (Langford and Gray, 1966). Strict A or D situations are not likely for cations in aqueous systems since entering or leaving ligands are always associated with the hydrogen-bonded water molecules in the 1st and 2nd hydration layers of the cation, leading to I as the primary mechanism of ligand-metal exchange/substitution in aqueous systems (Lay, 1991; Richens, 1997). This interchange mechanism where one ligand is exchanged for another, can be further classified as either associative interchange (IA) bond-making or dissociative interchange (ID) bond-breaking, but only for conceptual purposes since these reactions likely exist on a continuum and in actuality the reactions are probably not so clear cut (Lay, 1991). These classifications not only refer to the cation-ligand exchange, but also ligand-ligand exchange as waters in one hydration shell exchange with waters in another shell or with an oxyanion.
3. Crowded Water
Conceivably, in any aqueous system the entire bulk water is interconnected by the rapid continuously fluctuating network rearrangements. Irving Langmuir is quoted as saying “The whole ocean consists of one loose molecule, and that the removal of a fish therefrom is a dissociation process” (Kendall, 1937). As we have also described, every dissolved molecule or suspended particle, and every interface will have one or more hydration layers in which the bound water will have a substantially higher residence lifetime longer than that in the free water. At ambient temperature, the bound water is not immobile or frozen like ice, but the rate of movement of the water at these interfaces is less than that of bulk water. The question is what fraction of water is bound as compared to free in any given situation? The consideration of what is bound water and what is free water is of great importance for molecular biochemistry, not just in terms of protein folding structure, function, and interaction, but in the regular operation of a cell. For instance, the volume of the osmotically inactive portion of cells and cell cytoplasm is accounted for by the water of hydration (bound water) (Fulton, 1982).
Water molecules in the bound state are not only removed from the bulk or free water state, but can be considered as part of the molecule or surface to which it is bound. Consider the actual diameter of a hydrated Ca2+ ion with 6H2O in its 1st layer and 12 in the 2nd layer as compared to the ionic diameter of Ca2+ (∼ 0.2 nm). According to Pavlov et al., (Pavlov et al., 1998) the center-to-center distance between the calcium atom and a water molecule in the 1st hydration layer is 0.235nm, with the radius of the water molecule in the 1st shell (0.141 nm). With the addition of the H-bond distance between the water in the 1st shell and the water in the 2nd shell (∼0.180 nm) and finally the liameter of the water in the 2nd shell (0.282 nm), the result is a diameter of ∼ 1.68 nm per hydrated calcium ion. On the same basis, a hydrated Mg ion has a diameter of ∼1.61 nm, due to the higher charge density of the smaller Mg2+. In Ca-rich montmorillonite clays the water layer is ∼1.8 nm thick while in the Mg-rich clay the thickness is ∼1.83 nm, and in vermiculite clays the diameters are ∼1.17 nm and 1.09 nm respectively (Levy and Shainber, 1972). The oxyanion of hydrated PO43& ion, with a single 1st shell of 12 water molecules has a diameter of ∼1.4 nm.
Tables 2 through 5 illustrate the amount of free versus bound water in 4 aqueous systems, given average, conservative numbers for water coordination to each ion. The 4 systems shown are: 10mM CaCl2 solution (Table 2), a concentration commonly used in in vitro mineralization models (Gebauer et al., 2008; Price et al., 2009); human blood (Anderson and Anderson, 2002; Lang et al., 2009; Putnam, 1975) (Table 3); the average cytosol composition of a mammalian cell (Alberts, 1998; Lodish et al., 2007) (Table 4), and seawater (Table 5).
Table 2.
Calcium chloride hydration in solution.
| Ion | Conc of ions (M) | # of waters in 1st Shell | Conc of bound water in 1st Shell (M) | # of waters in 2nd Shell | Conc of bound water in 2nd Shell (M) |
|---|---|---|---|---|---|
| a, b Ca2+ | 0.01 | 10 | 0.1 | 20 | 0.2 |
| a Cl− | 0.02 | 5 | 0.1 | 0 | 0 |
| Total Bound Water in 1st Shell (M) | Total Bound Water in 2nd Shell (M) | Total Free Water(M) | % of Water in the Bulk | ||
| 0.2 | 0.2 | 55.15 | 99.28 | ||
Table 5.
The standard mean chemical composition of seawater (Dickson and Goyet, 1994).
| Ion | Conc of ions (M) | # of waters in 1st Shell | Conc of bound water in 1st Shell (M) | # of waters in 2nd Shell | Conc of bound water in 2nd Shell (M) |
|---|---|---|---|---|---|
| a Cl− | 0.56576 | 5 | 2.8288 | 0 | 0 |
| b SO42− | 0.02927 | 8 | 0.23416 | 0 | 0 |
| c Br− | 0.00087 | 6 | 0.00522 | 0 | 0 |
| d F− | 0.00007 | 6 | 0.00042 | 14 | 0.00098 |
| a Na+ | 0.486 | 6 | 2.916 | 12 | 5.832 |
| a, e Mg2+ | 0.05475 | 6 | 0.3285 | 12 | 0.657 |
| a, e Ca2+ | 0.01065 | 10 | 0.1065 | 20 | 0.213 |
| a K+ | 0.01058 | 6 | 0.06348 | 12 | 0.12696 |
| a Sr2+ | 0.00009 | 8 | 0.00072 | 12 | 0.00108 |
| a B(OH)3 | 0.00032 | 0 | 0 | 0 | 0 |
| a B(OH)4 | 0.0001 | 0 | 0 | 0 | 0 |
| f HCO3− | 0.00183 | 9 | 0.01647 | 0 | 0 |
| f CO32− | 0.00027 | 9 | 0.00243 | 0 | 0 |
| a OH− | 0.00001 | 5 | 0.00005 | 0 | 0 |
| Total Bound Water 1st Shell (M) | Total Bound Water 2nd Shell (M) | Total Free Water(M) | % of Water in the Bulk | ||
| 6.50 | 6.83 | 42.22 | 76.00 | ||
Table 3.
Hydration of Blood Components.
| Ion | Conc of ions (M) | # of waters in 1st Shell | Conc of bound water in 1st Shell (M) | # of waters in 2nd Shell | Conc of bound water in 2nd Shell (M) |
|---|---|---|---|---|---|
| a Cl− | 0.116 | 5 | 0.58 | 0 | 0 |
| a Na− | 0.145 | 6 | 0.87 | 12 | 1.74 |
| a, b Mg2+ | 0.0015 | 6 | 0.009 | 12 | 0.018 |
| a, b Ca2+ | 0.0018 | 10 | 0.018 | 20 | 0.036 |
| a K+ | 0.004 | 6 | 0.024 | 12 | 0.048 |
| c PO43− | 0.001 | 12 | 0.012 | 0 | 0 |
| d HCO3− | 0.029 | 9 | 0.261 | 0 | 0 |
| e Glucose | 0.005 | 10 | 0.05 | 0 | 0 |
| f Albumin | 45 mg/mL | 0.35 g H20/g protein | 0.875 | 0 | 0 |
| f IgG | 18 mg/mL | 0.4 g H20/g protein | 0.4 | 0 | 0 |
| f Fibrinogen | 4.5 mg/mL | 0.24 g H20/g protein | 0.06 | 0 | 0 |
| Total Bound Water in 1stShell (M) | Total Bound Water in 2nd Shell (M) | Total Free Water (M) | % of Water in the Bulk | ||
| 3.16 | 1.84 | 50.55 | 90.99 | ||
Table 4.
Hydration of Cell Cytosol Components.
| Ion | Conc of ions (M) | # of waters in 1st Shell | Conc of bound water in 1st Shell (M) | # of waters in 2nd Shell | Conc of bound water in 2nd Shell (M) |
|---|---|---|---|---|---|
| a Cl− | 0.015 | 5 | 0.075 | 0 | 0 |
| a Na+ | 0.015 | 6 | 0.09 | 12 | 0.18 |
| a, b Mg2+ | 0.0005 | 6 | 0.003 | 12 | 0.006 |
| a, b Ca2+ | 0.0000001 | 10 | 0.000001 | 20 | 0.000002 |
| a K+ | 0.14 | 6 | 0.84 | 12 | 1.68 |
| c HCO3− | 0.012 | 9 | 0.108 | 0 | 0 |
| d PO43− | 0.0004 | 12 | 0.0048 | 0 | 0 |
| e Proteins | 205 mg/L | 0.35 g H20/g protein | 3.98 | 0 | 0 |
| Total Bound Water in 1st Shell (M) | Total Bound Water in 2nd Shell (M) | Total Free Water(M) | % of Water in the Bulk | ||
| 5.11 | 1.87 | 48.57 | 87.43 | ||
The amount of bound water in natural aqueous systems such as blood and the cell cytosol on the order of 9% to 12%, is clearly not as trivial as the amount of bound water found in a dilute solution of CaCl2 (< 1%), while seawater (just considering the ions) has close to 24% bound water. Please note once again, the estimations of bound water we have provided for tables 2-5 are conservative estimates based on the components found in each system and hydration values provided separately for each of those components. Our estimates do not take into account surface area of other interfaces in such systems which would add to the total amount of bound water in each system. For instance the total amount of osmostically inactive water (bound) in a cell is actually 35%, (three times our conservative estimate).
Inspired by Fulton (Fulton, 1982) who used the term crowded to describe the cytoplasm, we suggest the term “crowded water” should be used when considering the properties of biological water, as compared to the usual dilute solutions. We use this term, since in such systems where the amount of material (interfaces) is so high, so crowded, that a significant amount of the water in the system is no longer in the bulk state but rather is found in some bound water state, with a mixture of relaxation times. Consequently we suggest that due to this crowding, the interaction of hydrated ions with each other and these interfaces, occurs strongly via their respective hydration layers; limiting the activity of these ions to be regulated by the eventual exchange of bound water into the bulk water state. Such activity regulation can be seen biologically within the cell. Inside cells that have only been hydrated 30%, a point so low that there is no water in the bulk state, cellular metabolic activity stops (Aliev et al., 2002). “At a humidity level of 35%, metabolic pathways of carbohydrates, amino acids and Krebs cycle are activated, while further increase in humidity, up to 63%, activates the pathways of protein and nucleic acid synthesis, and cells can perform all the essential metabolic reactions necessary for their development”(Aliev et al., 2002). As a result, the role of hydration layers in biogenic systems needs to be considered and may be responsible for phenomena seen in biomineralization studies both in vitro and in vivo.
4. The Pathway to Crystallization
4.1. The Kinetics of Crystallization
Geological crystals (and those of industrial origin such as metals, ceramics, polymers, etc.) form from a melt, an amorphous liquid phase that has essentially the same composition as the crystal or glass that forms from it as the melt cools (Callister Jr., 2003). However, the formation of the crystal within the melt does not occur at high temperatures, it occurs either when the melt has been undercooled, or when the pressure of the system has been raised to the point where the number of accessible orientations available to the molecules within the melt have been restricted. Since in this case, changing the pressure and temperature of the system has similar kinetic effects on intermolecular behavior, we will focus on just the effect of changing temperature. The rate of cooling is important; rapid cooling, and the consequent decrease in mobility of the components in the melt may lead to a preservation of the amorphous nature of the liquid in the form of a solid (a glass) (Callister Jr., 2003; Dorozhkin, 2010). Kinetically, cooling the melt slowly maintains the mobility of the system for a longer time allowing for the ultimate evolution in two order parameters, density and structure. As local density fluctuations occur, atoms begin to arrange around each other such that density fluctuation leads to coordination, which leads to structure, ordering and further changes in density, this is crystallization.
Biogenic crystallization is not a distinctly different process from a geological melt, with the exception of the inclusion of water as an active participant. It is carried out in equilibrium conditions at constant or ambient temperature from aqueous solutions driven by a chemical potential difference in which the crystal phase represents the most stable form. The instances where crystal formation and/or phase nucleation is mediated by elevated temperatures in aqueous systems are kinetically not altogether different from the formation of biogenic crystals at ambient temperatures, and this becomes apparent when we examine the role of temperature in these systems.
The degree of mobility is what delineates a liquid from a solid (Langmuir, 1917). Temperature is the average kinetic energy of a system. Kinetically, the role of increased temperature in a liquid, gas, or solution, is to increase the number of accessible orientations (the mobility) of molecules in the system. In general, cases which involve the crystallization of highly soluble materials from a solution, the applied heat increases the interaction between the solute and the solvent, leading to an increase the dissolution and ultimately the solubility of material. When the solution is eventually cooled the solution becomes supersaturated with respect to the solute, increasing the driving force for precipitation and ultimately crystallization. In the case of the crystallization of highly insoluble materials such as in nanoparticle/hydrothermal synthesis, the high temperatures aid in overcoming the activation and kinetic barriers that may normally hinder molecular alignment and chemical reactions; thus heat facilitates the formation of thermodynamically stable products on relatively short time scales. Recent bio-inspired studies have demonstrated that the introduction of long chain polymers, changes in ionic strength, or an abundance of small molecules to regulate the kinetics, can eliminate the need for such high temperatures, facilitating the room temperature synthesis of semiconductor nanoparticles (Mullaugh and Luther, 2011; Qi et al., 2001). In the case of crystallization through sintering, solid state diffusion is accelerated through the application of heat until the assembly of these atoms reaches an energy minimum such that the thermal energy is no longer high enough to move atoms away from these energetically stable assemblies.
As illustrated by these non-biological examples, biology's ability to make crystals at ambient temperatures, or under mild physiological conditions is not so “remarkable” as long as the mechanism employed regulates the mobility of ions, atoms, and molecules, and therefore the kinetics of the reaction. The mineral related ions, as pointed out in the previous sections (Section 2 & 3), are all hydrated to various extents, and probably guide crystallization by various steps of dehydration. The relative mobility of hydrated ions with respect to each other is dependent on the degree of hydration and movement of water. At body pH and temperature, the precipitation of calcium phosphates involves the electrostatic interaction between the hydrated Ca2+ and PO43−/HPO42− ions, and the removal of the ion-bound hydration layers on the both the Ca2+ and the various phosphates. In essence, the ion-bound layers of water are peeled from the Ca ion and phosphate ions enhancing the electrostatic interactions between the ions, and the bound water molecules are released to the bulk water state.
4.2. Nucleation Theory
The picture of monomer-by-monomer addition that leads to crystal nucleation is a mathematical construct based on the formation of liquid droplets within a dilute vapor phase (Becker and Doring, 1935; Dreyer and Duderstadt, 2006). This is a limiting case of the classical theory of nucleation, an example of one perceived mechanism for how crystals may nucleate to serve as a tool for determining the rate of nucleation (Abraham, 1974; Kashchiev, 2000). Thermodynamically there is no classical mechanistic pathway to phase nucleation. Nucleation theory, both classical and non-classical, is non-mechanistic and does not explicitly delineate the number of steps required to transition from one phase to another. Classical nucleation theory describes a discontinuous phase transformation, where the formation of an interface between the two phases creates a free-energy barrier to nucleation (ΔGn*) (Abraham, 1974; Balluffi et al., 2005; Kashchiev, 2000; Oxtoby, 1992). Whether the crystal nucleus forms from a monomer-by-monomer mechanism or by the coalescence of aggregates it is still classical nucleation theory as long as there is an interface between these precursors (serving as either solutes that make up the solution phase, or which exist as an entirely separate phase from the solution on their own) and the forming nucleus.
Early on, Gibbs realized (during the period of 1876-1878) (Gibbs et al., 1928) that formation of one phase within another not only created a bulk phase surrounded by the parent phase, but created an interface between the two phases and thus one had to consider the work required to create that surface, ΔWi* = ⅓σAi*, where σ is the surface tension (surface energy density) and Ai* is the area (Abraham, 1974; Gibbs et al., 1906). Volmer and Weber in 1926 (Abraham, 1974; Dreyer and Duderstadt, 2006; Kashchiev, 2000), realized that this consideration of an interface required knowledge as to the shape and area of the forming crystal nucleus, and using the Gibbs/Thomson law derived geometric relations of the size of a nucleating phase to both the surface (ΔGs) and bulk free energy (ΔGb) of that phase. This strictly thermodynamic approach, however, describes the initial and final states, and cannot strictly apply to a mechanistic model, nor how many intermediate phases (if any) are required before reaching the final thermodynamically stable phase. Nevertheless, the transition from one phase to another and even the creation of multiple intermediate phases on the pathway to a final, thermodynamically stable crystalline phase is a fundamentally accepted process in the classical pathway of crystal nucleation pre-dating Volmer & Weber and Becker & Döring, known as Ostwald's Rule of Stages (Hedges and Whitelam, 2011; Kashchiev, 2000). This acceptance that multiple possible phases can be formed when transitioning from one phase to another explains how the multiple phases seen in Figure 1 can exist.
The general approach by: Volmer, Weber, Farkas, Kaischew, Stranski, Becker, Döring, and Frenkel (Abraham, 1974; Becker and Doring, 1935; Dreyer and Duderstadt, 2006; Kashchiev, 2000) to the atomistic theory of nucleation was to propose that the atoms/molecules (particles) of a single component in a gas or liquid phase would randomly collide to form unstable aggregates fluctuating in size. When the number of particles in such a fluctuating cluster reached a critical size then the particles in the interior of the cluster would become more stable, and with a slight shift, that particle could transition to a stage where continued growth would be favored over dissolution. That critically sized aggregate where the probability for both dissolution and growth is the same is called a critical cluster; containing n* particles. The shape of the initial cluster was most easily modeled as a sphere, but one could consider any other shape or size parameter for the interface being created as the cluster grows. When the probability of forming a new phase is greater than 50%, a nucleation cluster (n*+1) favoring growth is created (Veis and Dorvee, 2012).
In contrast to classical nucleation theory, non-classical nucleation theory describes a continuous phase transformation where the generation of distinctly different phases separated by an interface is not exactly straightforward, therefore there is no barrier in free-energy in the transition from one phase to another (Balluffi et al., 2005; Lutsko, 2012; Oxtoby, 1992). In non-classical crystal nucleation, the structure of the crystal nucleus can differ sharply from the eventual stable phase (Talanquer and Oxtoby, 1998). This is an appropriate description when it comes to the formation of mesocrystals (Niederberger and Colfen, 2006) and colloidal crystals, but does not necessarily apply to all systems involving solution based crystal growth in the aqueous phase and using this “non-classical” term can create misleading assumptions in such systems where water is a participant.
4.3. Inspiration from Protein Crystallization
Experimentally a melt can be undercooled, or a solution can be supersaturated, yet either can exist in a metastable form for long periods of time in spite of large thermodynamic driving forces. This is the result of a diffusion limited kinetic barrier to crystallization (Talanquer and Oxtoby, 1998). Examples of how to overcome this kinetic barrier come from protein crystallization studies.
Luft et al. (Luft et al., 2011) recently compiled the results of about 20 million systematic and thoroughly documented crystallization experiments at the Hauptman-Woodard Institute high throughput screening laboratory, tracking the visualized solubility outcomes of each experiment. Their aim was to determine the conditions that would drive a metastable supersaturated protein solution to crystallize rapidly. Luft et al. was guided by the concept that crystallization could proceed with a lower activation energy from an amorphous dense liquid-like cluster formed within the initial supersaturated solution rather than directly from the supersaturated mother liquor (Luft et al., 2011; tenWolde and Frenkel, 1997). Luft et al. examined a number of liquid-like aggregates formed in the initial droplets of supersaturated protein solutions (Luft et al., 2011). They observed that a liquid-liquid phase separation is seen as “drops within drops, a cloud-like pattern of liquid within a drop or as emulsion”, in the metastable region of the phase diagram (Luft et al., 2011).
Using a DFT model, ten Wolde and Frenkel (tenWolde and Frenkel, 1997) produced free-energy landscapes for the solution to crystal transition, plotted as a function of the number of particles ordered as a crystal (Ncrys) against the number of particles that exist simply as a particle in a more dense fluid phase relative to the environment (Np). These contour plots showed that it is possible to transition from a solution phase to a crystal phase indirectly using classical nucleation theory, as long as one or more intermediate phases allow for the creation of a lower free energy pathway than would be found in a direct solution to crystal transition (Ostwald's rule of stages). The required change in free energy for crystal nucleation could thus be lowered relative to the solution-to-crystal transition if a dense fluid phase was formed prior to crystal nucleation within this fluidic prenucleation cluster. That is, the total number of molecules (Np+ Ncrys)) in the prenucleation cluster can be much larger than the population of Ncrys. The number of particles in the cluster will continue to grow until the value of Ncrys reaches the critical value (for a nucleus), at which point crystal growth becomes more rapid. tenWolde and Frenkel (tenWolde and Frenkel, 1997) estimated that the rate of nucleation within this dense fluid was increased by a factor of 1013 relative to nucleation directly from the mother liquor solution that does not pass through intermediate stages. Thus the issue of a diffusion limited kinetic barrier to nucleation is reduced by the existence of this dense fluid phase, but there still remains a free-energy barrier to nucleation that must be overcome.
Subsequently, Vekilov experimentally demonstrated the presence of a fluid-fluid critical point when crystallizing proteins, and designated it as a Dense Liquid (DL); a separate phase from the bulk solution in which crystals nucleated and grew (Vekilov, 2004; Vekilov, 2010). Vekilov proposed a two-step nucleation pathway for the formation of crystals (as we have shown in supplemental Figure S1) from solution rather than a simplistic single step model (Veis and Dorvee, 2012; Vekilov, 2004; Vekilov, 2010). Conceptually, this pathway describes the transition from the solution phase (A) to the DL phase (B) to the crystalline phase (C) as the combination of two separate free energy curves that describe two phase transitions (A → B & B → C), each described by classical nucleation theory, placed in tandem and where each of the free-energy maxima is less that the total free-energy required to transition directly from A to C (supplemental Figure S1) (Veis and Dorvee, 2012). This pathway of multistep phase transitions does not need to be restricted to only two steps (Bewernitz et al., 2012; Habraken et al., 2013).
It was found that the short range interactions between protein molecules can be changed and promotion of the liquid-liquid phase separation achieved by crowding the solution through the addition of non-adsorbing polymers (eg. polyethylene glycol) or by changing the pH or salt concentration of the solvent (tenWolde and Frenkel, 1997; Vekilov, 2004; Vekilov, 2010).
4.4. Macromolecular Free DL Phase
The struggle over whether or not to use high supersaturations versus additives to aid in crystal formation has been an issue with in vitro models for biomineralization. The trend has been to either use high supersaturations (Deshpande and Beniash, 2008; Olszta et al., 2007; Wang et al., 2012), or polymer additives (Deshpande and Beniash, 2008; Liu et al., 2011; Nudelman et al., 2010; Olszta et al., 2007), or protein additives (Nudelman et al., 2010; Price et al., 2009) in mineralizing solutions to achieve the desired mineralization in vitro. We will show later (Section 7), from our perspective how these experimental conditions generated a DL phase in inorganic solutions, similar to the DL phase generated by introducing additives to protein solutions.
The results from protein crystallization studies prompt the question: Is such a DL phase (favorable to nucleation kinetics) achievable in inorganic solutions without macromolecular intervention? The answer is yes, DL formation has been seen in completely inorganic systems. Hunt (1866) described the appearance of a turbid gel when 0.5 M CaCl2 was mixed 1:1 with 0.5 M Na2CO3 (∼23.5% water in the bulk). Brooks et al. (1950) claimed that a 0.088 M solution of CaCl2 mixed with a 0.925 M solution of Na2CO3 (∼18.7% water in the bulk) also produced this gelatinous state, this is in fact not true but such a reaction creates a precipitate that slowly separates from solution (the reason for this will become apparent in Section 5). The replacement of 50 mol % of the Ca with Mg, in the case of the Brooks synthesis (∼19.7% water in the bulk), yields the same result, but the precipitate separates from the solution more slowly than in the synthesis which is free of Mg. The same 50 mol % substitution of Ca with Mg in the Hunt synthesis (∼28.9% water in the bulk) results in a highly viscous solution but no gel.
The description of “droplets of calcium carbonate” and a separate demixed liquid phase within solution has been used by others (Addadi and Weiner, 1992; Dedek, 1966; Lengyel, 1937) to describe how spherulites of CaCO3 may form from solution. In 1966 Dedek found that the synthesized, gelantinous state, of CaCO3 could be stabilized by the concentration of the reactants used, and plotted this in a tertiary phase diagram of CaCl2, NaCO3, NaOH and Sucrose (Dedek, 1966). Faatz et al, (Faatz et al., 2004; Faatz et al., 2005), produced CaCO3 by the slow alkaline decomposition of dimethylcarbonate in a solution of CaCl2 and claimed to see a liquid like precursor. This liquid rapidly transitioned to an amorphous glassy state through the loss of water (Faatz et al., 2004)). Liquid droplet coalescence was shown in Scanning Electron Microscopy (SEM) images and coalesced, solid, amorphous, particles appeared as merged spheres (Faatz et al., 2005). Xu et. al., through the regulated addition of CO2 by slow vapor diffusion into a CaCl2 solution, claimed that the ACC hemispheres that formed on mica substrates (both bare and functionalized with either poly(diallyldimethylammonium chloride) or poly(allylamine hydrochloride)) formed from liquid-like colloids (Xu et al., 2005).
Reiger et al (Rieger et al., 2007) using much more dilute (as compared to Hunt and Brooks) 0.01 M CaCl2 and Na2CO3 solutions (∼98.5% water in the bulk) found via cryo-TEM analysis, that liquid droplets and the gelatinous, viscous precipitates seen by both Hunt and Brooks were the result of emulsions formed in solution followed by eventual spinoidal phase separations between phases of different densities. The emulsions were short-lived, densifying within seconds, becoming spheres within a minute and faceted crystals within 5 minutes. The introduction of 600 ppm, of a 70/30 poly(acrylic acid)-poly(maleic acid) block copolymer (leaving ∼98.4% water in the bulk) (Ikegami, 1968), prolonged the otherwise short-lived existence of the emulsion 5-10 min longer; then it eventually transformed into nanoparticles. This showed that such polymer additives regulated the kinetics of the reaction.
In a definitive experiment in the complete absence of additives, substrates and interfaces Wolf et al.(Wolf et al., 2008) demonstrated that small ions in solution could be made to aggregate and form a DL phase on a timescale long enough to be observed. Using acoustic levitation Wolf et al. suspended a droplet of a Ca(HCO3)2 solution held in place without any extraneous constraints other than the droplet air-water interface and followed the droplet in situ by wide angle x-ray scattering (WAXS) as the droplet was concentrated by evaporation of the aqueous phase. Data from parallel TEM and cryoSEM analysis of droplets collected at suitable time points revealed that “a homogeneous formation of CaCO3 proceeded via an amorphous liquid-like state, unambiguously without artifacts,” and described an emulsion-like state as described by Reiger et al. (Wolf et al., 2008). Thus metastable liquid-like (DL) clusters can be generated by density fluctuations of the inorganic ions within the aqueous solution phase solely by direct interactions of the inorganic ions involved; Bewernitz et al. have recently come to the same conclusion (Bewernitz et al., 2012).
5. The Nature of the DL phase
Within a melt, crystallization involves the coupling of the two order parameters of densification and structure. Forming an ordered structure has kinetic barriers associated with both the aggregation and the precise placement of atoms/ions/molecules, while there is a free-energy barrier to creating an ordered interface in an amorphous liquid. These kinetic barriers are often overcome by thermal fluctuations that provide enough activation energy, or in this case mobility to facilitate aggregation, alignment and precise placement of atoms/ions/molecules.
In crystallization from solution the two order parameters become decoupled. Solute ions/particles first interact increasing their local density. There is an energy cost associated with aggregation as the aggregated particles create a new surface and interface with the solution. This densification can occur without having to be ordered, the particles and the relative free-energy of the particles can be lowered by simply creating a large enough aggregate that the surface free-energy penalty of the aggregate is lower than the bulk free-energy benefit of its formation (ΔG = ΔGb−ΔGs). We speculate that these aggregates, composed of hydrated ions, coalesce and form the DL state, an amorphous liquid which exists as a separate phase from the solution, with an interface composed of slow moving bound water. This is a dense liquid because the water of hydration is more dense than bulk water (1.1 g/mL) (Ikegami, 1968; Svergun et al., 1998); with the addition of ions also adding to the density to this liquid. Within this amorphous liquid the molecules within the DL phase behave as they would within a melt, and structure their arrangement. One can not presuppose that the chemical composition of this DL phase remains constant. One must consider the possibility of chemical interactions within this mixture and the formation of interesting structures of both water and ions such as ion pairs, large aggregates, polynuclear oxo(hydroxo) bridged structures (Demichelis et al., 2011; Habraken et al., 2013; Richens, 1997), etc, all mediated by the rearrangement and removal of bound water.
5.1. Formation of the DL phase
As discussed earlier, illustrated in Fig. 4, and further illustrated in Fig. 5, the positive dipole of the water molecule in the hydration layers of cations are arranged such that they point outward, away from the central metal atom, whereas in the hydration layers of the oxyanion aqua ion it is the negative dipole of the water molecule that points outward. When ions come together, it is these oppositely oriented waters, specifically the 2nd hydration layer of cations and the 1st hydration layer of oxyanions, that first interact with each other, forming a solvent-ion complex wherein the 2nd layer of cation hydration becomes shared by both ions through a hydrogen bonding network (Fig. 5b.). As a result of this action all bulk water between the ions is expelled and a more dense-liquid-like state has begins to form devoid of free water. The distance (edge-to-edge) in between these two ions (calcium and phosphate (or carbonate) shown in Figure 5) would be ∼1.4 nm.
Figure 5.
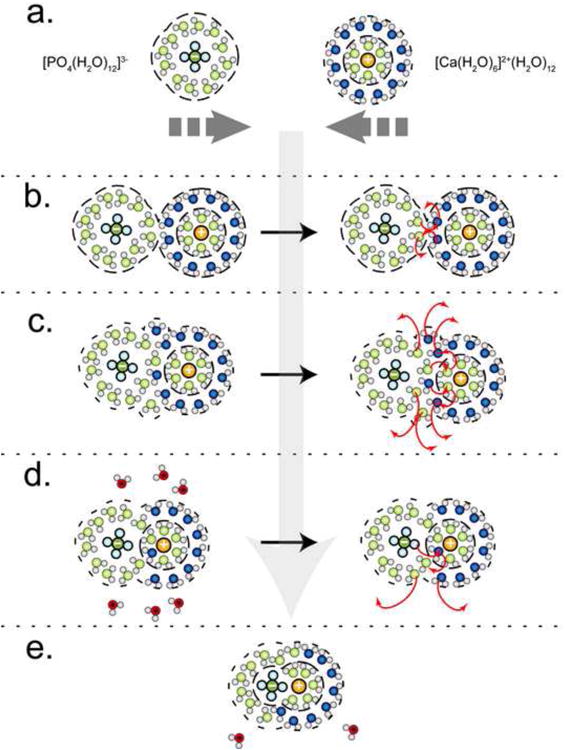
The aggregation and water expulsion from two hydrated ions (a) phosphate and calcium. The initial aggregation (b) starts with the hydrogen bonding between the two outer hydration spheres of the ions followed by the mixing of the two outer shells. The removal of a layer of water (c) leads to the formation of an outer-sphere complex picture in (d) a solvent sharing pair. The removal of the shared solvent layer (d) in between the ion pair creates an inner-sphere complex (e) a solvated ion pair.
Given the faster exchange rates of water with carbonate and phosphate as compared to magnesium or even calcium it is easy to depict the expulsion of water shared by both ions through an ID interchange mechanism for the ligand and an IA interchange mechanism (Fig. 5c.) for the metal, leading to a collapse in the number of hydration layers between the ions and the formation of a complex where the distance in between the oxyanion and the cation would be about ∼0.95 nm, roughly the diameter of two waters and two hydrogen bonds. After this exchange, the 2nd layer of hydration around the cation is now the 1st layer of hydration for the oxyanion and this layer now extends around the ion pair as a shared outer hydration shell. It is at this stage where this initial aggregation of ions, (which could be larger and include more ions than just this simple ion pairing as we have depicted in supplemental Figure S2), creates an interface of bound water between this aggregate and bulk water. This interface is a layer of slow moving, bound, hydrogen bonded, water which is a mixture of the 1st water layer on the oxyanion and the 2nd water layer on the cation. This is the beginning of the DL phase.
Further exchange of waters, either an ID of waters for the oxyanion or an IA of waters for the cation (or for both ions), expels more water from this aggregate and the two layers of water between the two ions collapses into one layer of water between them. After this exchange, the 2nd layer of hydration around the cation becomes the 1st layer of hydration for the oxyanion and this layer extends around the ion pair as a shared outer hydration shell forming an “outer sphere complex” (Richens, 1997) where the oxyanion now occupies the 2nd hydration layer of the metal (Fig. 5d). This outer sphere complex exists as a solvent sharing ion pair. The distance in between the oxyanion and the cation is reduced to ∼0.5 nm (water + H-bond) and the outer layer of water surrounding the aggregate is a smaller, more ordered combination of the 1st layer waters of the oxyanion and 2nd layer waters of the cation as compared to a mutually shared layer of 2nd shell waters.
The final expulsion of water between ions is driven by the favorable electrostatic interaction between the oppositely charged ions in a typical Lewis acid-base substitution reaction. In this final step, the oxyanion (carbonate or phosphate) behaves as a water molecule and exchanges for a 1st layer water to form a charge satisfying bond between the oxygen on the anion and the metal (Fig. 5e.) this is an “inner-sphere complex” (Richens, 1997) or a solvated ion pair.
The DL phase can be imagined as composed of aggregates, in assorted variations including hydrated ions, hydrated small ion clusters, and solid amorphous particles, but in all cases with the bulk water expelled (as shown in supplemental Figure S2). All of the molecules in the DL will have longer residence times than in free water. Though the rate of movement of the water within the DL phase would be less than the of the bulk water, the DL water is still a liquid, but denser (water of hydration density = 1.1 g/ml) (Ikegami, 1968; Svergun et al., 1998) and with a higher viscosity than purely bulk water. The brief water relaxation times on the order of pico-nanoseconds still makes bound water fluidic and therefore imparts such fluidity to the DL phase. The fluidic nature of the DL phase gives the ions (which can have a lower free-energy in this state than in solution) and particles within this phase mobility not achievable to the same molecules found within a solid.
In concentrations up to roughly 0.1 M the relative viscosity of a salt solution compared to water (η/η0) at the same temperature varies with the salt concentration according to the Jones-Dole expression (Tansel et al., 2006):
| (Eqn. 3) |
Where A is a positive number that is large for strongly hydrated ions, and is associated with counter-ion screening. B is the degree of water structuring around the ions, weakly hydrated ions have negative B coefficients, while strongly hydrated ions have positive B coefficients (at 273K in dm3/mol, Ca2+ = 0.298, Mg2+ = 0.385, PO43− = 0.382, NH4+ = −0.008, K+ = −0.009, Na+ = 0.085, Cl− = −0.005) (Tansel et al., 2006). The relative viscosity is higher for low concentration calcium, magnesium, and phosphate salt solutions, and lower for sodium chloride solutions.
5.2. From the Dense Liquid to the Crystal
The bound water present in the DL would not be free, but would still serve to impart mobility to the ions in the system which can exist in a lower free-energy state than hydrated ions in bulk solution, but in a higher free-energy state than a solid aggregate. An ionic liquid (IL) is a salt in the liquid state, made of ions, short lived ion pairs, or even functionalized nanoparticles that when “cooled”, form an ionic solid that is either amorphous or crystalline (Bourlinos et al., 2005a; Bourlinos et al., 2005b; Fang et al., 2009; Fernandes et al., 2010; Giannelis et al., 2006; Mayy et al., 2011; Shah et al., 2005; Sun et al., 2010; Warren et al., 2006). A DL can be thought of as a IL composed of [M(OH2)n]z+ and [L(OH2)m]z−, but there is no bulk water present. Such an IL, in the material science world, can be termed a deep eutectic solvent (DES) which is a specific type of IL usually composed of both ionic and non-ionic molecules, and interaction is generally mediated by a hydrogen bonding network (Carriazo et al., 2012) in which the average hydrogen bond residence time is increased, while the metal and oxyanions retain their mobility and liquid nature.
It is this mobility and liquid nature which makes the DL phase comparable to a melt. While substantial undercooling is required to initiate crystallization from a melt, or a very high degree of supersaturation is required to drive crystallization from a solution, within the DL phase the final expulsion of the primary hydration layer is a kinetic limitation and its destabilization is the mechanism by which the solid phase ultimately forms Kinetically, anything that regulates the mobility of ions and the dwell time of the bound water within the DL will regulate the stability and lifetime of the DL phase as a whole, a phenomenon seen in the early experiments of Termine and Posner while exploring the synthesis of ACP (Termine and Posner, 1970). The presence of water contributes to the number of accessible orientation states, and the number of H-bond interactions of the aqua-ions. The more orientation states available the more kinetic freedom (configurational entropy) is available to find the optimum conformation to minimize the free-energy of the system, but the alignment of the molecules has to be more precise in order to receive the enthalpic reward of such binding. This limitation raises the free-energy barrier between the DL phase and the solid crystalline phase (Hedges and Whitelam, 2011).
Counterions such as Na+ and especially COOH− have distinct hydration layers and thus have H-bonding repercussions that affect the lifetime and long term stability of the DL phase. Counterions with distinct hydration layer structures can participate in H-bonding to increase the stability and lifetime of the DL phase such as the case with Mg2+ (Loste et al., 2003), while counterions such as H+ (for phosphoric or carbonic acid) and OH− (for calcium hydroxide) that have short-lived hydration shells, increase H-bond exchange and cause instability and short lifetimes for the DL phase. A long-lived DL phase can also be achieved through the interactions with hydrated interfaces such as found on polymer additives (Fayer, 2012).
In the case of the formation of polymorphs of calcium carbonate, we propose that the densification of the DL, and destruction of the DES state reveals the consequences of decoupling the order parameter density from structure. The thermodynamically stable crystalline polymorph calcite is more dense than the less stable polymorph vaterite, but calcite is less dense than the less stable aragonite polymorph (Navrotsky, 2004). We speculate that the differences in density found in these crystal structures of the same chemical composition show that the degree of densification before structuring can have an effect on the polymorph generated; while complete densification without structuring would lead to a solid amorphous state.
As water is expelled from DL, the availability of H-bond donators and acceptors would be reduced, and the H-bonding network which gave the DES its mobility and liquid like nature would take on a limited efficacy. This dependence on labile bound water would make the DES thermodynamically less stable than the final crystal. The final densification and structuring step in which the oxyanion exchanges and replaces a 1st layer water on the metal would be restricted by two factors, the free-energy penalty associated with the dehydration of the metal and by the kinetic barrier associated with the need to align the oxyanion with the metal ion so that the electrostatic attraction is the most favorable for coordination to occur. Unlike the large theoretical free energy penalty for the complete dehydration of the cation (Lei and Pan, 2010), as discussed earlier and shown in Fig. 2 in this case there would only be a penalty associated with the reduction in the coordination number of waters attached to the metal. For instance, if in the end a 6-fold coordination of carbonate atoms to a calcium atom is required to form calcite (9-fold for aragonite, 8-fold for vaterite (Vecht and Ireland, 2000)) then the free energy barrier to create a 6-fold coordinated calcium carbonate complex, is the reduction of coordinated waters to the calcium atom down to 6 waters. After that, the free-energy penalty of dehydration is less significant since each water molecule will ultimately be exchanged for carbonate molecule and the coordination number will be preserved. Figure 5 depicts the path for expulsion of the 1st layer water, and the shortening of the distance between the anion and the cation. The kinetics of the exchange of water for a respective ion within the DL phase, to this final coalesced coordination of ions, is important. If at the edge of the DL phase oxyanion ligands are exchanged for the water residing on the cation at a rate which is so high that bound waters within the core of the DL phase cannot exchange out fast enough the internal water could become trapped. Such a trapping of water would disrupt the developing order of the solid phase and create an amorphous rather than crystalline solid product.
5.3. Role of Additives and Proteins
At several points we have stated that various additives, polymers and proteins had a major part in guiding crystallization via formation of a DL phase, and that the structure of the DL phase is crucially dependent on the hydration layers that form around ions. Here we take the Vekilov work (Vekilov, 2004) on lysozyme crystallization to present a detailed example. In that case, addition of 4% NaCl (0.68 M) was required to form the DL phase for a lysozyme solution at 70mg/mL concentration. Lysozyme, 14.5 kDa, (Svergun et al., 1998) has an excluded volume of 17.4 nm3 and a single layer of bound water that has a density 15% greater than bulk water (Svergun et al., 1998) (normal water density ∼33 molecules/nm), with ∼440 bound waters for every lysozyme molecule. Thus, at a concentration of 70 mg/mL, ∼3.8% of the water in the system would be bound, corresponding nicely with the ratio of 0.57g H2O/g protein (Squire and Himmel, 1979). With the addition of 0.68 M NaCl the contribution of the Cl− ion alone will remove an additional ∼6.12% of the water from the bulk and depending on the level of hydration the Na+ ion will remove another ∼7.35% to 22.3% of the water from the bulk, leaving ∼76.61% to 82.73% of free water in the system. The presence of inorganic ions suddenly provides a greater number of bound waters than the protein itself. Despite likely having a lower activity than in solution, the mobility of the lysozyme within the DL phase allows the protein to explore more energy favorable conformations as achieved by both the chaotropic contribution of the NaCl and the movement of bound waters within the DL phase due to the presence of the inorganic ions. Additional changes to the solution conditions, such as pH and the introduction of a non-ionic polymer (such as polyethylene glycol) (tenWolde and Frenkel, 1997; Vekilov, 2004; Vekilov, 2010) to crowd the solution, could also contribute to the formation of the DL phase by affecting the dynamics of bound vs. free water thereby reducing the free energy difference between “mother liquor” (the initial supersaturated lysozyme solution), the prenucleation aggregates, and the DL along the crystallization pathway. The addition of other polymers or proteins to a salt solution creates additional interfaces and increases the crowding of the system. Fayer has demonstrated that the addition of an interface regardless of geometry or charge slows the orientational relaxation of water from 2.6 ps to ∼15-20 ps (Fayer, 2012). So not only is the amount of bound water increased with the introduction of polymers or proteins, the residence time of those bound waters is also increased, thus the introduction of polymers or proteins has an effect on the kinetics of the system.
In vivo, a biogenic mineralization system uses proteins and inorganic salts to contribute cooperatively to facilitate a similar construction of a DL phase. As a biological IL or deep-eutectic solvent the separation of the roles of proteins or small ions as either principal components or as additives to the DL phase, though convenient, is not entirely practical. The formation of a DL phase from the solution phase, is the result of an energy minimization of the components involved (proteins, ions, clusters of ions, polynuclear oxo(hydroxo) bridged structures, water, etc.) and is not created with the obligatory goal of forming a particular crystal or aggregate. The composition of this deep-eutectic solvent, the biologically mediated DL phase, will ultimately direct the end product, but the formation of a solid phase, be it amorphous or crystalline, is the result of a further energy minimization of the DL phase, governed by the exchange and ultimate removal of bound water. The thermodynamically stable product is achieved by the path dependent regulation of the kinetics of the system.
6. The Map to Crystallization
This section re-examines, and explains the conceptual map of crystallization (Fig. 1) from the perspective of bound water. Figure 1 shows multiple pathways to the formation of crystals from free ions, each pathway is associated with free-energy barriers governed by both thermodynamics and kinetics. The simple picture of crystallization through the gradual monomer-by-monomer assembly into a low energy 3D periodic array of unit cells is inspired by the mathematical treatment of the kinetics by Becker and Döring (Becker and Doring, 1935; Dreyer and Duderstadt, 2006). In reality chemical and physical reactions, including crystallization are never “simple”. The additional crystallization pathways seen on the continuum of coalesced states, Fig.1, have been introduced over the years by various researchers with each pathway having its own proposed set of mechanisms. The common three elements of these pathways, are: fluctuations in two order parameters (structure & density), and the removal of water to the bulk state. Here we briefly show how each of these pathways are described by their respective authors and then we show that all of these pathways and these common elements, point to a transition of states that occurs via the movement of bound water, leading to a common conceptual phase diagram for these crystallization pathways, Fig 6.
Figure 6.
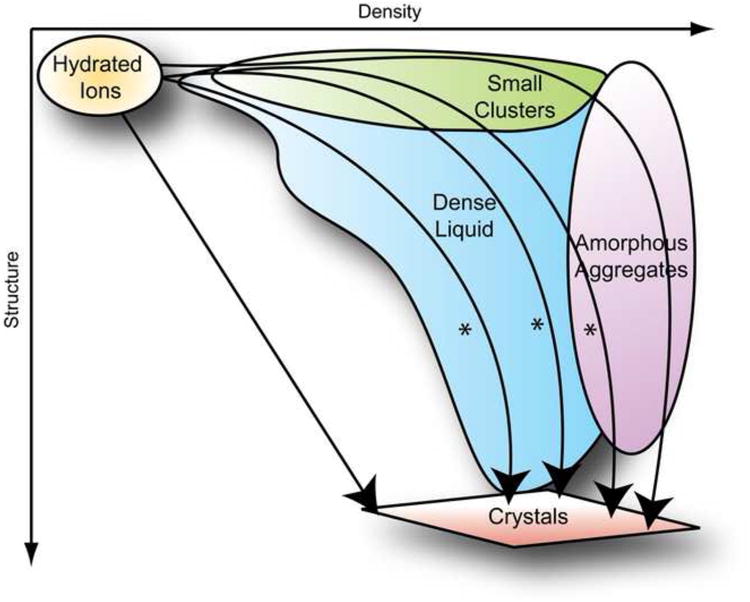
A rearrangement of the complex crystallization map from Figure 1 to a common conceptual phase diagram for crystallization where the various states between pre-coalesced hydrated ions and completely coalesced crystals are plotted against the two order parameters of structure and density. Examples of five possible (out of many) pathways in the transition from Hydrated Ions to Crystals are shown, with three (*) pathways passing through the DL phase and are the most likely pathways to occur in vivo due to the crowded water found in aqueous biological systems..
Before we continue, the term amorphous must first be defined. The term amorphous applies to a material that is structurally non-crystalline (Eanes et al., 1965), with crystalline being a material that has long range order. The distinction between amorphous and crystalline becomes less clear the smaller a material becomes. A line can be drawn, where if a material larger than a crystal nucleus does not have long range order it is amorphous; in the same line of thought, any material smaller than crystal nucleus for that material, regardless of order, is amorphous because it is not large enough to be a crystal. Loose aggregates (smaller than a crystal nucleus), hydrated ion clusters, ion pairs, and liquids, by the strictest definition are all amorphous. In an attempt to create a distinction and maintain clarity we refer to amorphous solids as amorphous aggregates with the recognition that free ions, sub-nucleus sized clusters and DL phases (both of which are prenucleation clusters), are all amorphous, but will be addressed by their description and not as the general term of “amorphous”.
6.1. Ions to Dense Liquid, Dense Liquid to Crystals
We have already described how the works by Rieger et al. and Wolf et al. (Rieger et al., 2007; Wolf et al., 2008) demonstrated the possibility of creating a DL phase directly from ions, through the densification of hydrated ions in solution into a viscous liquid state. Inadvertently Faatz et al. demonstrated that all things being equal, the bifurcated pathway between the formation of a noticeable DL phase (from ions) and the creation of a crystalline phase directly from ions is created by affecting the kinetics of water movement in the system (Faatz et al., 2005). When the solution was stirred rapidly, forcing the solvent and ions to interact more readily, spherical particles (assumed to have formed from a liquid precursor) were not seen, instead only calcite of differing morphologies was witnessed, while under quiescent conditions the spherical particles were seen (Faatz et al., 2005). Additionally, Faatz et al. demonstrated that higher temperatures produced smaller spherical particles (Faatz et al., 2005), suggesting that heightened activation energy may have caused greater water loss leading to smaller particles. In section 5 we have addressed, in detail, how ions and clusters in the DL phase can transition to a crystal, through coupled fluctuation in structure and density and a loss of water leading to formation of a critical crystal cluster n* (where the driving force for growth and dissolution are in equilibrium), followed by a nucleation cluster (n*+1) and then a growing crystal within the DL phase.
6.2. Ion clusters, and Clusters to Dense Liquid
“Classical homogeneous nucleation theory assumes clustering of solute prior to nucleation” (Larson and Garside, 1986a). In the absence of any quantifiable metric, ten Wolde and Frenkel described the formation of a cluster as a function of the degree to which particles were aggregated; if the distance between two clusters is less than 1.5a (where σ is the effective diameter of a particle) then the particles are considered to be a part of the same cluster (tenWolde and Frenkel, 1997). On an atomic scale, a pair of Ca2+ and PO43− ions separated by a distance of ∼0.5 nm (the diameter of water and a H-bond) would constitute a cluster, making a collection of ions in the DL state a set of prenucleation clusters. A compilation of studies where clusters of sub nuclei size have been discovered in aqueous solutions is presented in Table 6 with a corresponding estimation of bound water base on the hydration of the components for each study.
Table 6. Discovery of sub-nuclei sized clusters in aqueous solutions.
| Experimental conditions | Size of the Clusters | Detection Method | Reference | Bound Water |
|---|---|---|---|---|
| pH 7-10.5 Ca × PO4 mM = 132 to 800 mM2 |
0.9-1.0 nm (Posner's clusters) |
X-ray Scattering | (Posner and Betts, 1975) | ∼98.2%-95.5% |
| Saturated solutions of Citric Acid, Urea, NaNO3 and K2SO4 | 4-10 nm (∼103 molecules/cluster) |
Density measurements | (Larson and Garside, 1986a) | ∼1-45% |
| 2.5 mM CaCl2 1 mM K2HPO4 140 mM NaCl Tris Buffer (unkown mM) pH 7.4 |
0.7-1.0 nm | Light Scattering | (Onuma and Ito, 1998) | ∼92.75 |
| 10 mM CaCl2 10 mM Na(HCO3)2 & Na2CO3 |
2-6 nm 70 Atoms |
Activity & Ultracentrifugation | (Gebauer et al., 2008) | ∼98.6% |
| 9 mM Ca(HCO3)2 Slowly degassed 22 °C, 100% humidity |
hydrated ions 0.6 to 1.1 nm clusters <4 nm clusters |
Cryo-TEM | (Pouget et al., 2009) | ∼99.2% |
| 2.5 mM Ca2+ 1.0 mM HPO43− 10 mM HCO3− 142 mM Na+ 126 mM Cl− 5 mM K+ 1.0 mM Mg+ 1 mM SO42− |
∼0.87 nm ± 0.2 nm | Cryo-TEM | (Dey et al., 2010) | ∼93.75% |
| 2.5 mM Ca2+ 2.5 mM Cl− 1.0 mM HPO43− 5 mM K+ Tris Buffer (unkown mM) pH 7.4 |
30-80 nm | ∼99.8% |
In 1986, prompted by the work of Mullin and Leci (1969), Larson and Garside examined several aqueous supersaturated solutions in vertical columns (Larson and Garside, 1986a); over time these solutions developed density gradients which corresponded to clusters forming in the quasi-equilibrium of the solutions (Larson and Garside, 1986a). The researchers also determined that the less soluble substances only supported very small clusters, while the greater the supersaturation, the larger the cluster size for a given substance, additionally all the clusters observed were smaller than the size of a crystal nucleus for a given substance (Larson and Garside, 1986a). Larson and Garside mathematically showed that for small cluster sizes there is “a substantial decrease in the surface tension for very small entities” and that this leads to a lower Gibbs' free energy within a very small size range that is roughly an order of magnitude smaller than the size of a crystal nucleus (Larson and Garside, 1986b; Sohnel and Garside, 1988).
In 1998 Onuma and Ito described the presence of 0.7-1.0 nm sized cluster in solutions of calcium and phosphate, and described them as similar to the clusters originally detected by Posner and coined the term “Posner's Clusters” (Onuma and Ito, 1998; Posner and Betts, 1975). In 2008 Gebauer et al. using a constant composition system, were able to establish the existence of prenucleation clusters in calcium carbonate solutions, even in undersaturated solutions (Gebauer et al., 2008). They report that the formation of clusters is based on the idea that these clusters are thermodynamically stable (not metastable), in agreement with the predictions by Garside and Larson. These clusters are the result of their existence in a local Gibbs free-energy minimum shown in a free-energy diagram (Gebauer et al., 2008) similar to the one proposed by Vekilov, involving a two stage nucleation process where clusters are first formed at a local energy-minimum (like Vekilov's DL phase) and then proceed over a small energy barrier to the crystalline state (supplemental Figure S1) (Vekilov, 2004; Vekilov, 2010). Gebauer et al. describe an equilibrium that exists between ions and clusters, but were unable to quantify the number of clusters or the number of ions in clusters because of an excess of variables involved (Gebauer et al., 2008). Gebauer et al. speculate that the cluster formation mechanism can be explained by entropic solvent effects, where the release of water from the hydration layer of the ions, promotes stable cluster formation (Gebauer et al., 2008). Gebauer et al. state that this collection of ions, and clusters have “solute character” and hydration energy in lieu of surface tension despite the free energy barrier that exists between ions and clusters (Gebauer et al., 2008). Yet, in contrast, the consideration of hydration energy and the energies involved in the kinetics of water exchange, in the context we have described, would provide for the existence of slow moving bound water as the outer shell of the DL phase, serving as phase boundary for this collection of clusters and ions.
In 2009 Pouget et al. examined cluster formation on functionalized surfaces with Cryo-TEM (Pouget et al., 2009). In the solution, prior to the start of the experiment Pouget et. al. report the existence of clusters coexisting with the free ions in solution, confirmed by ultracentrifugation (Pouget et al., 2009) and consistent with the cluster-ion equilibrium description and findings by Gebauer (Gebauer et al., 2008). After 2-6 minutes of CO2 out gassing, larger 30 nm clusters were observed (Pouget et al., 2009).
Dey et. al. examined “surface induced formation of apatite from SBF” using cryoTEM, and showed the progressive formation of prenucleation ion clusters (Dey et al., 2010) similar to those described by Posner (Posner and Betts, 1975). Dey et al. described isolated, nanometer sized, prenucleation clusters ∼0.87 nm ± 0.2 nm in diameter. These clusters were long lived at 25 °C, unlike the short-lived tiny CaCO3 particles seen by Pouget et al (Pouget et al., 2009), that later coalesced into “loose aggregated networks” at 37 °C (Dey et al., 2010). From the TEM images, these loose aggregated networks can be described as similar to a “collection of schooling fish” (Sommerdijk, 2010), an appropriate description of the DL phenomenon. The authors explain how loose aggregations of prenucleation clusters exist in equilibrium with free ions in an SBF solution (Dey et al., 2010) as previously described by Gebauer et al. (Gebauer et al., 2008).
Recently Habraken et. al. discovered a myriad of configurations for these ion clusters (Habraken et al., 2013). In their observation of calcium phosphate solutions using cryo-TEM, it was found that the first clusters to form were polynuclear oxo(hydroxo) bridged structures, a familiar phenomenon in inorganic chemistry, which Habraken et al. describe as polymeric aggregates (Habraken et al., 2013). These bridged structures were previously seen (in a publication published online 10 days earlier) by Baumgartner et al. in solutions of iron oxide (Baumgartner et al., 2013) and previously modeled by Demichelis et al. for calcium carbonates (Demichelis et al., 2011). After a few minutes these polynuclear oxo(hydroxo) bridged structures transformed into: nodules, aggregated spheres, aggregated spheres plus “ribbons”, and finally took on the configuration of “ribbons” (Habraken et al., 2013).
6.3. Ion clusters to Crystals
The transition from ion-pairs or small clusters to a crystalline state is not much different than the transition from free ions in solution to a single crystalline phase. The transition will occur through fluctuations in density and structure, in tandem or simultaneously; in the end the clusters need to aggregate together and find registry with each other such that they achieve aligned aggregation and the lowest possible free energy state. Having already obtained a degree of density and order, the aggregation of prenucleation clusters, which leads to a gain in surface enthalpy (as seen by Pouget et al. for the formation of amorphous clusters (Pouget et al., 2009)), is likely a shorter path to crystal nucleation (in terms of evolving order parameters) than building solely from constituent ions, and their aggregation might be easily facilitated by agitation (since nucleation rate is low due to low free ion supersaturation) (Habraken et al., 2013; Pouget et al., 2009; Sohnel and Garside, 1988). The agitation would increase “greatly the probability [of nucleation] if several (say 2-10) clusters coming into contact, coalescing and becoming larger than the critical size” (Larson and Garside, 1986b) required to form a crystal.
This transition from clusters to crystal is mediated by water. Crystal formation from ion clusters of course can occur via dissolution of the clusters followed by a reprecipitation, which becomes less straightforward conceptually, if the solutes of clusters themselves are already at an energy minimum below the free-energy of ions in solution (Gebauer et al., 2008). It should be noted that one of the first ideas with regards to dissolution-reprecipitation that comes from Posner et. al, (Boskey and Posner, 1973; Eanes and Posner, 1968; Eanes et al., 1965; Posner and Betts, 1975; Termine and Posner, 1970) proposes a dissolution step base upon observation of visible precipitates (Eanes and Posner, 1968; Eanes et al., 1965; Termine and Posner, 1970) and the kinetics of the ACP to HAp transition (Boskey and Posner, 1973). However, all of this discussion was with regards to the amorphous aggregates and not necessary the stable prenucleation clusters that made up these aggregates; “it would be interesting to determine if the cluster remains intact in this dissolution process or whether it must dissociate completely before HA is formed” (Posner and Betts, 1975). If these clusters exist as or within a DL phase dissolution would not be required. If the clusters do dissolve, and if they are of the same composition and structure as the forming crystal, then such a dissolution reprecipitation would be termed Ostwald-ripening (Boistelle and Astier, 1988).
Though Habraken et al. do not provide evidence for the direct cluster to crystal transformation they do show time resolved images of the evolution from clusters to crystals. Harbraken et al. go on to state that they do not rule out the possibility for a direct cluster to crystal transformation, and indicate that the free energy state of theses clusters will impact the ability to form a crystalline phase (Habraken et al., 2013). Habraken et al. further point out that “to go directly from these complexes to the ordered crystal requires both more extensive chemical transformations than needed for ACP formation, as well as structural transformations that are not a factor in ACP nucleation” and that there may be a greater kinetic barrier to form a crystalline phase rather than an amorphous phase (Habraken et al., 2013). In contrast Baumgartner et al. witnessed the “fusion of nanometer-sized precursors concomitant with the formation of crystallinity without the intermediate formation of amorphous bulk phase” and describe that the formation of these primary particles, prior to this fusion, that have unique size and stability “may arise from the interaction of a Fe(II) ions with a ferrihydrite hydrogel that is formed locally in the initial stages of the reaction” (Baumgartner et al., 2013).
6.4. Ion Clusters and DL Phase to Amorphous Aggregates
These ion pairs and small clusters can further aggregate without a structuring order parameter; the rapid loss of bound water would lead to a densification of clusters without creating an ordered structure and lead to an amorphous aggregate. As demonstrated by Dey et al. and Pouget et al. this densification (in the case of cAp) may require the presence of an interface such as a Langmuir Bloget surface film of arachidic/stearic acid (Dey et al., 2010; Pouget et al., 2009). Pouget et al. found that clusters < 4 nm, in solution aggregated to form larger 30 nm clusters, but that larger clusters 70-120 nm formed on a functionalized monolayer of stearic acid, demonstrating that densification can occur in solution but that the presence of a monolayer may stabilize greater aggregation and densification (Pouget et al., 2009). Dey et al. found clusters in solutions of SBF, and found that the aggregation of a loose network of clusters into more dense amorphous aggregates only occurred with the introduction of a substrate, despite the fact that “no information that supports true epitaxial relation between the organic and inorganic phases” was found (Dey et al., 2010). In this case, aggregation to the surface may have been mediated by the slow moving water at the interface. While, site binding between the divalent Ca2+ and the acidic monolayer likely promoted the removal of bound water and the subsequent dehydration of the DL phase to form a more dense amorphous aggregate from the constituent hydrated ions and clusters.
Habraken et al. through thermodynamic calculations, assert that the formation of an amorphous aggregate from small calcium phosphate clusters is energetically more favorable than the direct formation from individual ions in solution due to the clusters having “a certain excess free energy over that of the free ions that is associated with their surface (in this regard they differ from the prenucleation clusters postulated in the calcium carbonate system, which are said to be lower in free energy than the free ions)” (Habraken et al., 2013)
For the DL phase, as described earlier, the transition to an amorphous aggregate phase occurs as a result of fluctuations in density (Vekilov, 2004; Vekilov, 2010) and a loss of water (Faatz et al., 2005). As we have discussed, this transition would occur through the rapid expulsion of bound water to the bulk water state. The trapping of internal waters would lead to an internally disordered structure with respect to the crystalline phase. This transition may occur with both the presence of (Dey et al., 2010) or in absence of a surface (Pouget et al., 2009) depending on the experimental conditions.
6.5. Amorphous Aggregates to Crystals
The persistence of amorphous aggregates has been attributed to their structural frustration, in that they may have regions of both disorder and order, but the order may “differ from that of the bulk phase” (Meldrum and Sear, 2008). Though amorphous aggregates do not have as much free-energy-benefit from both bulk and surface bond enthalpy as crystals, they are disordered (with respect to the crystalline phase) and therefore their entropic penalty is not high enough to cause dissolution. The lack of order makes it difficult to achieve any enthalpic benefit in adding additional material to the surface and therefore they can not support growth beyond a certain size. These restraints dictate that for a given material under a given set of conditions an amorphous aggregate will be restricted to a certain size (Dey et al., 2010; Pouget et al., 2009). An internal structural rearrangement or an increase in long range ordering of these amorphous aggregates lead to an evolution in the structural order parameter, leading to an increase in density and anisotropy both in the shape of the particle and in the surface energy, ultimately causing a crystal to grow from an amorphous aggregate (Dey et al., 2010; Pouget et al., 2009).
The transition from an amorphous aggregate to a crystalline solid occurs through the loss of water. In any solid-state diffusion or structural rearrangement without dissolution, a defect is required. This packing defect can be a dislocation, a vacancy or void, and in an aqueous system this defect can be internal waters. In all the cases of dissolution-reprecipitation, solid-state transformation or a mixture of both mechanisms, it must be understood that it all happens in the presence of water. In densification and the formation of structure, a pathway for water exchange needs to be facilitated. All amorphous aggregates, hydrated or anhydrous have a layer of hydration on the outside, whether a solid state diffusion of water forces the migration of water from the inside to the outside of the aggregate or there is a slight/complete dissolution (ID interchange) of one of the cation-anion bonds on the outside of the amorphous aggregate a pathway for water exchange must be established. Once there is a means for bound water expulsion, internal waters can exchange for internal cation-anion bonds via IA exchange, leading to structural ordering and densification while the bound water slowly migrates to the aggregate surface. Thus the loss of water leads to both densification and structural ordering and crystallization.
The presence of a surface may facilitate densification or structural ordering or both. With the introduction of a surface, the bound water surrounding a DL phase or amorphous aggregates will interact with the bound water on a surface facilitating the movement of bound water within the outer-sphere complex that is the aggregate and the surface, allowing the DL phase or amorphous aggregate to densify even further. The mechanism for the transition, of either the DL phase or an amorphous aggregate, to a crystal will involve the movement of water. If the substrate is charged or has a charge distribution that is analogous to the ion distribution on a particular crystal face, the outer-sphere complex can collapse to an inner-sphere complex due to an IA exchange between the surface functionality and the densified DL phase or amorphous aggregate as seen in the work by Dey and Pouget (Dey et al., 2010; Pouget et al., 2009). Once a critical density is reached, the introduction of structural ordering will lead to the formation of a nucleation cluster (Pouget et al., 2009).
Multiple site binding events on epitaxially related binding sites between the substrate and the DL phase or amorphous aggregate will lead to the formation of a densified and structurally ordered clusters, which can serve as a crystal nuclei with distinctly different surface energy than the preceding amorphous phase and lead to crystallization as the system seeks a lower free-energy state (Dey et al., 2010; Pouget et al., 2009).
6.6. A Common Conceptual Phase Diagram for Crystallization
The data for each of these systems discussed above, argue that the common feature for the development of mineralization in aqueous systems is that the principal reaction is not strictly defined by the ions that are being crystallized, but how the water itself can be ordered/re-ordered to direct the development of the selection, and proper ion paring of the ions to the minimum free energy state. In each of these examples that we have addressed we have not only demonstrated that each of these various coalesced states can be connected to bound water, and ultimately a DL phase, but that each of these states essentially exist on a coordinate plane dictated by the two order parameters density and structure. Water molecules have to be considered as direct participants in the crystallization of ionic species. From this perspective, Figure 1 can be simplified to five states that have been seen in vitro and that depend upon the different rates, or order of development of density and structure and removal of water from the ions to the bulk phase, shown in Figure 6 as a common conceptual phase diagram for crystallization. As an example, five possible pathways have been shown in Figure 6 but many more paths than these can be drawn through this diagram. Three of the pathways shown pass through the dense liquid state and are the most likely pathways to occur in vivo due to the crowded water found in aqueous biological systems.
7. Mineralization of Collagen Matrices
Obviously, the prior discussion has presented the argument that a universal consideration must be the interactions that control the formation of the aqueous DL phase. However it is also clear that the nature and composition of the hydrated interface to be mineralized, and the concentration and the particular properties of other salts or polymers in the aqueous solution all need to be factored into each case. We consider three components particular to bone and dentin: 1) the hydration structure of the densely packed native fibrous collagen tissue; 2) the hydration and structure of the acidic polyelectrolytes of the DPP type; and 3) the control of specific loci for mineralization within the collagen fibrous tissue.
7.1. The Suitability of the Dense Collagen Matrix for Mineralization
The unique quarter stagger – overlap structure of the collagen fibril creates channels which penetrate the interior of fibril: and in bone and dentin these become filled with platy crystals of cAp. Additional cAp is deposited in larger aggregates in the interfibrillar spaces (Veis, 2003). There are two areas of hydrated interfaces within the fibril, the interface of the interior intra-channel hydration layers, and the exterior interface with the ECM water at the external surfaces and crevasses of the triple-helical molecule (Fullerton and Amurao, 2006). The platy intrafibrillar crystals within the intrachannel are on the order of 2 to 3 nm thick (Boothroyd, 1975; Landis et al., 1996; Weiner and Price, 1986; Weiner and Traub, 1992). The key point is that the in vivo collagen fibril system is established and already organized as packed fully hydrated fibrils in the osteoid or predentin before mineralization is initiated. For mineralization, this system requires an additional mechanism for either: the delivery of the calcium and phosphate ion moieties to be added at the mineralization front, or the presence of inhibitors of mineralization in the osteoid or predentin. In fact, both possibilities have support. The ECM of the osteoid and predentin is rich in sulfated glycosaminoglycans (GAGs), which do inhibit mineralization by complexing Ca2+ ions. Analyses of the predentin matrix showed that it contained more GAGs than the mineralized phase ECM, and (at the mineralization front) a high content of chondroitinases (Carmichael and Dodd, 1973; Dodd and Carmichael, 1979) that degrade the GAG chains before they enter the mineralized dentin. The phosphophoryn, on the other hand is excluded from the predentin and enters directly from the dentinal tubules only at the mineralization front (Rabie and Veis, 1995; Weinstock and Leblond, 1973; Weinstock and Leblond, 1974).
Odontoblasts and osteoblasts maintain a non-mineralized cell surface ECM territorial collagenous matrix. These cells regulate mineral formation by adding and then removing inhibitors and then localize the delivery of tissue specific components required (creating the localized prenucleation clusters) required for mineral deposition to create a mineralization front. At the same time the matrix has to be capable of specifically regulating the ordered growth (size, placement) of the ultimate apatite crystals. The dense collagen fibril matrix with its dense liquid single hydration layer (Fullerton and Amurao, 2006) reduces the mobility of the water and hence inhibits the final growth of the crystal nuclei, but favors the migration of the prenucleation clusters into the larger gap-region channels. In vivo the water in a collagen tendon is ∼62 % bound water (Fullerton and Amurao, 2006). Dry, the diameter of gap-zone channel within a collagen fibril is 1.2 nm, with the addition of water this diameter shrinks by 0.57-0.72 nm (depending on whether the walls of the channel are polar or non-polar) due to the layer of bound water within the channel (Fullerton and Amurao, 2006). The average distance between the hydrated walls of the channels (∼0.655 nm) would only facilitate a single water molecule participating in H-bonding, or two water molecules packed so close they can not H-bond. It is easy to see that most, if not all the crowded water in this gap-zone channel is bound water. The water within these fibrils must be replaced by the mineral component (Price et al., 2009), leading to the development of the thin, platy cAp, so characteristically aligned with the fibril periodicity.
7.1.1. Collagen Mineralization Without Macromolecules
Modeling and detailed analysis of the structure of collagen, shows that collagen fibrils have the capability to nucleate mineral on their own (Katz and Li, 1973; Landis and Silver, 2002; Landis and Silver, 2009; Mertz and Leikin, 2004; Orgel et al., 2011; Posner et al., 1978; Silver and Landis, 2011; Silver et al., 2001). The counter argument which has plagued this conclusion is why doesn't it? (Liu et al., 2011; Stetlerstevenson and Veis, 1986; Stetlerstevenson and Veis, 1987; Zeiger et al., 2011). Why is it that when collagen is placed in either SBF or highly saturated mineralizing solutions without macromolecular additives, does it not mineralize in the same way we see mineralized collagen in vivo (Deshpande and Beniash, 2008; Nudelman et al., 2010; Olszta et al., 2007; Price et al., 2009)? In these relatively clean in vitro systems, mineral forms on the outside of fibrils not within them (Deshpande and Beniash, 2008; Liu et al., 2011; Nudelman et al., 2010; Olszta et al., 2007; Price et al., 2009; Zeiger et al., 2011). The answer is in the kinetics of bound water exchange vs. the kinetics of mineral nucleation. If the rate of mineral formation is greater than the IA/ID exchange of bound water within the fibrils for inorganic ions in solution, then mineral will form exterior to the fibrils. If there is a mechanism for ion delivery and a facilitation (such as a regulated DL phase) of this bound water exchange between the exterior ions and the bound water with the fibrils, then mineralization within the fibrils can occur.
The only reported successful in vitro mineralization of collagen, in the absence of macromolecules, occurred under conditions where the collagen matrix was placed under dialysis for 2-3 weeks prior to placement in a highly saturated mineralizing solution (Wang et al., 2012). In many of these clean systems the concentration of reactants used is 1.5 times the concentration of SBF formulation as described by Kokubo and Takadama (Bohner and Lemaitre, 2009; Kokubo and Takadama, 2006), composed of ∼90% bulk water; while just calcium and phosphate at SBF concentrations is ∼99% bulk water. In SBF there are no polymer additives, nor proteins to provide added interfaces to crowd the water and slow the rapid exchange of bound water within any DL phase that may form. Under such conditions the DL phase would be short lived, in favor of a solid phase, while in contrast, the introduction of more ions or additives to provide additional interfaces would regulate the activity and serve to extend the lifetime of the DL state.
In the experiments by Wang et al (Wang et al., 2012), only a specific set of conditions made it possible to achieve intrafibrillar mineralization of collagen without the use of macromolecular additives, shown in Table 7. Wang et al. slowly injected a collagen solution into a dialysis system, to concentrate the collagen solution over the course of 12-16 days (Wang et al., 2012). The pH of the initially acidic solution was then raised to 9-10 by ammonia gas over an additional 4-8 days (Wang et al., 2012). This process was designed to concentrate the collagen well into the liquid crystalline regime, to mimic the structure and hydration state of collagen found in vivo (Giraudguille, 1989; Giraudguille, 1992; Wang et al., 2012). Due to various conditions for the preparation and ultimate mineralization of the collagen matrices the calculations for the amount of free water shown in Table 7 are presented as a range, based on conservative estimations that take into account the effect of acetic acid (Fedotova and Kruchinin, 2011), the dialyzing agent PEG 35kDa (Branca et al., 2002), and assuming the system reaches an osmotic equilibrium.
Table 7. Mineralization condition for collagen matrices in the absence of macromolecules.
| Author's Designation | End Collagen Concentration | Dialysis Conditions | Additional Mineralizing Conditions | Degree of mineralization Mineral/Matrix content | Free Water |
|---|---|---|---|---|---|
| Coll/CHA | 250 mg/mL | 46.1 mM CaCl2 13.8 mM NaH2PO4 13.8 mM NaHCO3 0.5 M acetic acid pH 2.2 raised to 9-10 + 300mg/mL 35kDa PEG on the outside |
N/A | ∼5% (not definitive) | ∼50-80% |
| Coll/CHA/SBF | 250 mg/mL | 46.1 mM CaCl2 13.8 mM NaH2PO4 13.8 mM NaHCO3 0.5 M acetic acid pH 2.2 raised to 9-10 + 300mg/mL 35kDa PEG on the outside |
3.8 mM CaCl2 1.5 mM K2HPO4, 6.3 mM NaHCO3 213 mM NaCl 4.5 mM KCl 2.3 mM MgCl 0.75 mM Na2SO4 10 mM Tirs Buffer pH 7.4 37°C stirring for 4-16 days (renewed every 4 days) |
mineralization within the fibrils ∼50% (similar to bone) |
∼70-85% |
| Coll-grad/CHA | ∼20 to 80 mg/mL | 46.1 mM CaCl2 13.8 mM NaH2PO4, 13.8 mM NaHCO3 0.5 M acetic acid pH 2.2 raised to 9-10 + Graded 35kDa PEG Conc. on the outside |
N/A | Spherulitic carbonated apatite crystals outside the fibrils | ∼80% |
| ∼80 to 100 mg/mL | “uniform mineral coating” | ∼50% | |||
| Coll/SBF | 250 mg/mL | 2.5 mM CaCl2 1.0 mM K2HPO4, 4.2 mM NaHCO3 142 mM NaCl 3 mM KCl 1.5 mM MgCl 0.5 mM Na2SO4 acetic acid pH 2.2 raised to 9-10 + 300mg/mL 35kDa PEG on the outside |
N/A | Spherulitic carbonated apatite crystals outside the fibrils | ∼49-79% |
| Coll/SBF/SBF | 250 mg/mL | 2.5 mM CaCl2 1.0 mM K2HPO4, 4.2 mM NaHCO3 142 mM NaCl 3 mM KCl 1.5 mM MgCl 0.5 Na2SO4 mM acetic acid pH 2.2 raised to 9-10 + 300mg/mL 35kDa PEG on the |
3.8 mM CaCl2 1.5 mM K2HPO4, 6.3 mM NaHCO3 213 mM NaCl 4.5 mM KCl 2.3 mM MgCl 0.75 mM Na2SO4 10 mM Tirs Buffer pH 7.4 37°C stirring for 4-16 days (renewed every 4 days) |
Spherulitic carbonated apatite crystals outside the fibrils | ∼69-84% |
The Coll/CHA/SBF matrix, was the only matrix that successfully achieved mineralization throughout the collagen fibrils with a mineral to matrix content of ∼50% (similar to that of bone) and achieved a WAXD pattern similar to that of hydrated two-year-old sheep bones (Wang et al., 2012). Under the conditions where a density gradient was created in the collagen matrix (Coll-grad/CHA) the results show the importance of a heavily hydrated liquid crystalline domain in collagen. The region of low density collagen (∼20 mg/mL) showed spherulitic cAp crystals, while in the high density region (above ∼80 mg/mL) “uniform mineral coating was observed” (Wang et al., 2012).
Wang et al demonstrated that through a biomimetic trick of selective bulk water expulsion, they were able to manipulate the amount of bound water in the system to create not only a collagen matrix existing in the liquid crystalline state, but a situation that promoted the formation of a DL phase for the calcium phosphate salts leading to mineralization within the liquid crystalline collagen matrix. Though it is possible to mineralize collagen fibrils without the aid of macromolecules, concentrations of ions higher than physiological were required.
7.2. Polyelectrolytes Enhance Intra-Fibrillar Collagen Mineralization
Non-Collagenous Proteins (NCPs) have been known for years to be related to mineralization in vivo (Veis and Perry, 1967), and have been speculated to be the means by which mineral forms in vivo (Boskey, 1989a; Boskey, 1989b; Boskey, 1989c; Boskey et al., 1989; Deshpande and Beniash, 2008; George and Veis, 2008; Price et al., 2009; Stetlerstevenson and Veis, 1986; Stetlerstevenson and Veis, 1987; Veis and Perry, 1967). Using dentin as the dense collagen matrix model, it has been hypothesized that DPP is the dentin NCP that participates in sequestering Ca ions and localizing apatite mineralization within the collagen fibril (George and Veis, 2008; Stetlerstevenson and Veis, 1986; Stetlerstevenson and Veis, 1987; Veis and Perry, 1967).
In solution NCPs are Intrinsically Disordered Proteins (IDPs) (Uversky, 2002) and recent examinations of these mineral-associated proteins show that they lack the periodic structure even when adsorbed to crystals (Hunter et al., 2010). Attention has turned to the idea that protein involvement with minerals is due to “a general electrostatic attraction rather than arrays of complimentary charges” (Hunter et al., 2010), specifically these examinations suggest that structure is not necessary for electrostatically mediated binding of a polyelectrolyte to a mineral face. Instead a flexible conformation of the polyelectrolyte is all that is minimally required for polyelectrolyte mineral interaction known as the “flexible polyelectrolyte hypothesis” (Hunter et al., 2010). Given such considerations we turn a generalized examination of polyelectrolytes.
In in vitro systems where polyelectrolytes are added to mineralizing solutions, mineral is seen forming within these collagen fibrils (Deshpande and Beniash, 2008; Liu et al., 2011; Nudelman et al., 2010; Olszta et al., 2007; Price et al., 2009; Zeiger et al., 2011). There are several explanations put forth to explain this phenomenon: “mineralization by inhibitor exclusion” where mineralization is inhibited everywhere except within the fibrils (Nudelman et al., 2010; Price et al., 2009); to crystals of a specific size that are nucleated outside the fibrils and then delivered to the interior of the fibrils (Deshpande and Beniash, 2008; Kirsch, 2012; Nudelman et al., 2010; Price et al., 2009); to cooperative actions between the polyelectrolytes and the collagen to promote mineralization within the fibrils (Olszta et al., 2007). But the fate of the polyelectrolyte in such cases has not yet been fully addressed (Olszta et al., 2007). In our view, common to each of these systems is the role of polyelectrolyte as a hydrated interface, a regulator of the DL phase.
7.2.1. Polyelectrolytes and Ions
Polyelectrolytes are considered weak electrolytes because their counterions are never fully dissociated from the polyion backbone chain (Manning, 1979). These counterions are not explicitly fixed to the polyions. Nevertheless, the self-diffusion coefficient of the counterion is equal to that of the polyion; the counterion and polyion move together as if the counterion was bound to the polyion without having a direct binding to each other. The activity coefficient (osmotic coefficient) of the polyelectrolyte salt is sharply reduced from that which would be obtained if the ions were all “free” in solution. If the osmotic coefficient was measured to be 0.4, for example, that would be equivalent to 60% of the counterions bound, with 40% free (Manning, 1979). This interaction between the counterion and the polyion is the result of mutual perturbation of their hydration layers detectable by changes in volume, ultrasonic absorption, index of refraction, and magnetic spin resonance (Manning, 1979). A counterion can either be “site bound” to a specific point charge site, forming what we have described earlier as an inner-sphere complex or solvated ion pair, or the counter ion can be “territorially bound” to any point along the polymer length forming an outer-sphere complex or solvent sharing ion pair where the two species are separated by a hydration layer. In territorial binding the counterion is trapped by the hydration layer surrounding the polyion, but is free to wander along the polyion surface (Manning, 1979) until the counterion is eventually dehydrated and site binds to a point charge.
7.2.2. Charge Satisfied Site Binding
The idea of divalent counterions site bound to a polyion has become intuitive in biomineralization, where it is well accepted that acidic residues play a role in mineralization (Addadi and Weiner, 1992), likely due to the interaction of these residues with calcium ions. In actuality the strong binding of counterions such as Mn2+ and Co2+ to a polyacid such as polyphosphate results in only half of the counterions undergoing complete dehydration leading to covalent site binding, the other half of the counterions are territorially bound (Karenzi et al., 1979; Manning, 1979; Spegt and Weill, 1976). Additionally, since the polyion is seen as a large ligand with a distributed charge density, the initial interaction between the polyion and the incoming counterion is primarily a territorial binding event (Manning, 1979). Thus the amount of exclusively available sites for counterion binding is not necessarily correlated 1:1 to the number of counterions that can be bound to the polyion. This still gives rise to the correlations that polyacids in solution bind up calcium ions, sequestering them, thereby inhibiting mineralization, but highlights that territorial binding of counterions to a polyion hydration shell needs to be considered in polyelectrolyte dynamics
7.2.3. Territorial Binding
Territorial binding is marked by the change in the counterion correlation time as compared to the free ion (Spegt and Weill, 1976). A polyion can be thought of as a linear array of unit point charges q with constant spacing b between charges (bearing univalent charged groups) taken along the contour length of the polymeric chain (Manning, 1979). To calculate the electrostatic free-energy Gel of polyelectrolytes a statistical mechanical approach is required (Manning, 1979), described by the following equation:
| (Eqn. 4) |
where np is the total number of moles of the univalent charged groups on the polyions, R is the gas constant, T is temperature in degrees Kelvin, N is the valance number of counterions in the system, θN is the number of bound counterions per charged group fixed to a polyion, ξ a dimensionless measure of the linear polyion charge density as defined by Manning (Manning, 1979), k is the Debye screening parameter that is proportional to the square root of the ionic strength and b is the distance between point charges on the polyion.
The chemical potentials μf for free counterions and μb for bound counterions can be described by the following:
| (Eqn. 5) |
with cf the molarity of free counterions in solution and
| (Eqn. 6) |
with the extra RT term originating from the standard osmotic contribution to the chemical potential of the bulk solvent, and the activity coefficient of bound counterions γb “derived from the electrostatic free energy required to form the linear arrays of charge together with the counterions bound to them” (Manning, 1979).
| (Eqn 7) |
and cb is the local molarity of territorially bound counterions
| (Eqn 8) |
Vp is the volume of the bound region in cm3/mol of polyion equivalent since the translational mixing of bound counterions occurs within the region of npVP close to the polyion (Manning, 1979).
The territorial binding of counterions MN+ to a polyion, where MN+ (free) → MN+ (bound), formulated as a change in chemical potential Δμ = μb-μf can be given by
| (Eqn 9) |
where δμo= μbo-μfo is the measure of change in solvation free energy of the counterion as it passes from the free to the bound state.
7.2.4. Charge Unsatisfied Site Binding
Site binding is defined by the loss of water in the counterion first hydration shell (Spegt and Weill, 1976), requiring dehydration, to transition from an outer-sphere complex (territorial binding) to an innersphere complex, but the end product does not necessarily require the quenching of charged species.
A Lewis Acid-Base substitution reaction between a hydrated cation and an uncharged lone-pair on a polymer (protonated acid group, primary amine, carbonyl, ester, etc.) would result in a non-charge satisfied, site binding event (a dative bond). As an example, calcium cations interacting with a chain of protonated poly-acid could eventual site bind to the lone pairs on the oxygen of the carbonyl and the structural charge of the polymer would transition from neutral to positive because the charge on the cation would not be quenched.
7.2.5. The Role of Polyelectrolytes in Collagen Mineralization
The use of polyacidic homopolymers in a synthetic construct to facilitate controlled biomimetic mineralization in vitro via a liquid-like precursor, is the primary strategy in what has been termed Polymer Induced Liquid Precursor or PILP (Dai et al., 2008; Gower and Odom, 2000; Olszta et al., 2007). Though in general any synthetic polyacidic homopolymer used to facilitate a liquid-like biommetic mineralization precursor can be termed PILP or PILP-like (Deshpande and Beniash, 2008; DiMasi et al., 2006; Liu et al., 2011), or more generally a deep-eutectic solvent, the traditional homopolymer used in PILP is poly(aspartic acid) (pAsp) (Dai et al., 2008; Gower and Odom, 2000; Olszta et al., 2007). It has been shown that the implementation of PILP and PILP-like strategies, which use a wide variety of polyacid-homopolymers, can drive mineral in a biomimetic capacity to form within collagen fibrils rather than exclusively on the surface of the fibrils (Deshpande and Beniash, 2008; Liu et al., 2011; Olszta et al., 2007). The technique of using a polyacidic homopolymer in collagen mineralization has been recently employed in the tissue engineering of dentin bonding materials (Tay and Pashley, 2009) and the biomimetic silicification of demineralized hierarchical collagenous tissues (Niu et al., 2013).
The specific experimental strategies for these models vary as shown in Table 8. The amount of bound vs. free water in each of these systems can be easily estimated given the experimental conditions and assuming hydration levels are ∼25 H2O/molecule of either HEPES or Tris, and ∼200 H2O/molecule pAsp (based on data for PEG) (Branca et al., 2002), and are shown in Table 8. In each of these models, mineralization occurred within the fibrils rather than on the outside. In a few of these cases researchers were able to see an amorphous phase develop within the fibrils prior to crystallization using TEM (Deshpande and Beniash, 2008; Nudelman et al., 2010; Olszta et al., 2007)
Table 8. Mineralization conditions of collagen using synthetic polyelectrolytes.
| Mineralizing Solution | Mineralizing Substrate and Time | Polyelectrolyte | Reference | Free Water |
|---|---|---|---|---|
| 2.1 mM K2HPO4, 4.5 mM CaCl2, 0.3 M Tris buffered saline (0.25 M NaCl, 0.05 M Tris) |
3D collagen collagen® sponge for 4 days | 75 μg/mL pAsp (6200 g/mol) |
(Olszta et al., 2007) | ∼92% |
| 1.67 mM CaCl2 1 mM (NH4)2PO4, 0.85× of a PBS solution composed of 131.17 mM NaCl, 8.5 mM sodium phosphate (as both a phosphate source and pH buffer), |
Single layer of collagen cast onto a TEM grid for 16 hrs | 62.5 μg/mL pAsp (5000-15000 g/mol) |
(Deshpande and Beniash, 2008) | ∼96.8% |
| 1.35 mM K2HPO4, 2.7 mM CaCl2, 10 mM HEPES buffer |
Isolated collagen fibrils on a TEM Grid for 3 days | 10 μg/mL (2000- 11000 g/mol) pAsp | (Nudelman et al., 2010) | 98.8%. |
In each of these cases, what we have described as a DL phase was formed with a small concentration of ions and a small amounts of polymer additives, and as little as 1.2% of the system containing bound water. Cryo-TEM of some of these pAsp calcium phosphate aggregates (Nudelman et al., 2010) reveal morphologies very similar the to emulsion-like state referred to by Luft et al. (Luft et al., 2011) and demonstrated by Rieger et al.(Rieger et al., 2007).
Kinetically, taking into account that the diffusion of counterions within the hydration shell along the polyion backbone will be more rapid than the exchange of the territorially bound ion with the bulk solution, and the extended residence time of water on the polymer as compared to the bulk; the territorial binding of ions with the polyelectrolyte extends the lifetime of DL phase. PILP, and other PILP-like systems employ the same biomimetic trick of removing bulk water similar to the previous polymer-free systems by Wang et al. (Wang et al., 2012), but they do so on a local scale, and more efficiently than globally removing bulk water. The polyelectrolyte facilitates the formation of a DES mixture between polymers and ions, where all bulk water is expelled (a dehydration while still in solution (Gower and Odom, 2000)), leaving the fluidity of the system to be dictated by the bound water, “the higher the pAsp concentration, the higher water content” (Dai et al., 2008).
pAsp does not exist in vivo, and homopolyers such a pAsp do not have collagen binding regions, as a result their interaction with the collagen is non-specific, and requires the use of polyelectrolyte concentrations greater than the physiological concentrations of NCPs such as DPP. The closest biological analog to the polyacidic homopolyelctrolyte pAsp would be polyphosphate, which has been hypothesized as a key component to biogenic mineralization (Liu et al., 2011; Omelon and Grynpas, 2011; Omelon et al., 2008; Omelon et al., 2009; Omelon and Grynpas, 2008; Orrielon and Grynpas, 2007). For biomimetic studies, it should be noted that the key differences between pAsp and polyphosphate is the linear charge density. Given the number of point charges q along the polymer backbone and given that the average distance b between charges is shorter for polyphosphate than pAsp, the linear charge density for a polyphosphate is greater than pAsp. As a result, for a given chain length, the total concentration of pAsp would have to be greater than an equivalent chain length of polyphosphate to achieve the same amount of site-bound/territorial bound counterions.
7.3. The Role of Specific Site Binding on the Collagen Matrix
7.3.1. The General Role of NCPs
NCPs, as anionically charged biomacromolecules, have been attributed to both mineral nucleation and mineral inhibition (Deshpande and Beniash, 2008; Nudelman et al., 2010; Price et al., 2009), largely dependent on the concentration, degree of phosphorylation, and the context in which they have been examined (in solution, in hydrogels or on substrates) (Boskey, 1989a; Boskey, 1989b; Boskey, 1989c; Boskey et al., 1989).
NCPs have a distinction over homopolymers, due to their heterogeneity, and not because they have structure, since in solution the strongly acidic SIBLING proteins found to be related to mineralization (of which DPP, DSP DMP1, BSP and OPN are members) are intrinsically disordered. The distinction of such proteins is that they have sequences containing hydrophobic side chains and basic side chains, which as IDPS offer the possibility of unordered domains that provide specific site binding of the SIBLING to collagen.
Like all polyelectrolytes, these proteins serve as an interface for bound water, but the distinction is that proteins because of their composition can be biologically targeted (George and Veis, 2008). As a polyelectrolyte, the counterion to the protein can be on the protein itself, such as a basic region (Manning, 1979), which causes the protein to move and take on particular confirmations with respect to its interaction with hydration layers. The counterion to the protein can also be a complimentary protein such as NCPs to collagen. pAsp when adsorbed to collagen inhibits mineralization (Zeiger et al., 2011), unlike bone sialoprotien (BSP). BSP is not only a strong mineralization promoter but has a specific collagen binding motif and has been shown that its capability as a nucleator is better when bound to collagen (Baht, 2008). pAsp does not participate in targeted site binding to collagen, and unlike BSP, the indiscriminate binding of the –COOH motif on pAsp seems to cause mineralization inhibition on pre-treated collagen (Zeiger et al., 2011).
Most of the biomineralization studies involving both collagen and NCPs have been performed in hydrogels (Baht, 2008; Boskey et al., 2000; Boskey, 1989a; Boskey et al., 1989; Boskey et al., 1990; Boskey et al., 1997; Boskey et al., 1993; Hunter and Goldberg, 1993; Hunter et al., 1994; Hunter et al., 1996; Hunter et al., 2000; Iijima and Moradian-Oldak, 2004; Iijima and Moradian-Oldak, 2005; Iijima et al., 2001; Iijima et al., 2000; Iijima et al., 2002; Silverman and Boskey, 2004); there have only been a few studies that have focused on the direct mineralization of collagen fibrils under a solution in the presence of NCPs (Nudelman et al., 2010; Price et al., 2009).
The mineralizing conditions for achieving collagen mineralization with NCPs, together with the amount of free water available in each system is shown in Table 9. In mineralization studies using the glycoprotein fetuin, solutions containing calcium and phosphate up to 5 times the concentrations found in SBF resulted clear solutions that would have otherwise begun to show cloudy precipitation without the fetuin (Price et al., 2009).
Table 9. Mineralization conditions of collagen using biological polyelectrolytes.
| Mineralizing Solution | Mineralizing Substrate | Non-collagenous Protein | Degree of Mineralization | Reference | Free Water |
|---|---|---|---|---|---|
| 10 mM CaCl2 10 mM Na2HPO4 0.2 M HEPES buffer |
Demineralized rat tibia | 5 mg/mL of a bovine Alpha-2-HS-glycoprotein (fetuin) | 5% of the original amount | (Price et al., 2009) | ∼90% |
| Demineralized Bovine bone sand | 70% of the original amount | ||||
| Unmineralized rat tail tendon | Within the Fibrils amount not indicated | ||||
| 4 mM CaCl2, 4 mM K2HPO4, 10 mM HEPES buffer |
Isolated collagen fibrils on a TEM | 1 mg/mL of a bovine Alpha-2-HS-glycoprotein (fetuin) | Within the Fibrils amount not indicated | (Nudelman et al., 2010) | ∼98.8% |
| 2.7 mM CaCl2, 1.35 mM K2HPO4, 10 mM HEPES |
Isolated collagen fibrils on a TEM | 15 μg/mL of C-DMP-1 | Outside the Fibrils | (Nudelman et al., 2010) | ∼ 98.8%. |
| 3-10 μg/mL of pAsp (2000-11000 g/mol) | Within the Fibrils Started After 48 hours | ||||
| 3-10 μg/mL of pAsp (2000-11000 g/mol 15 μg/mL of C- | Within the Fibrils Substantial and Heavy After 24 hours | ||||
| 15 μg/mL of C-DMP-1 Pre- adsorbed Followed by 3-10 μg/mL of pAsp (2000-11000 g/mol) | ACP in solution After 24 hours |
When placed in mineralizing solutions containing fetuin, collagen matrices (both demineralized and natively unmineralized) became mineralized within the fibrils appearing as they do in vivo. Without fetuin mineral formed in solution with barely any mineral forming within the collagen matrices (Nudelman et al., 2010; Price et al., 2009). In comparison to studies using pAsp as an electrolyte, while using fetuin researchers were unable to see the transient ACP precursor at any stage prior to the mineralization of the fibril as they had seen in their studies using pAsp; they speculated that mineral deposition with fetuin “occurs through a different mechanism”(Nudelman et al., 2010).
Studies using the c-terminus of DMP1 (C-DMP-1) a known promoter of mineralization with a collagen binding motif, revealed that despite having both apatite nucleation sites and a collagen binding domain, C-DMP-1 alone did not stimulate the formation of mineral within the collagen fibrils. The addition of pAsp was needed in order to achieve collagen mineralization using C-DMP-1 (Nudelman et al., 2010). The combination of C-DMP-1 and pAsp increased rate of mineral deposition as compared to pAsp alone, with “substantially” heavy mineralization within 24 hrs, as opposed to pAsp alone where crystallization did not start until after 48 hrs (Nudelman et al., 2010). Much of this data suggests that the apatite nucleation sites on C-DMP-1 may serve to accelerate crystallization kinetics, destabilizing the DL phase by facilitating nucleation and leading to a cascade dehydration of the DL phase. C-DMP-1 alone causes crystals to form outside the fibril (accelerating crystallization kinetics) while pAsp (as a promoter of the liquid phase) would aide in slowing the kinetic effect of C-DMP-1; slowing the process enough to allow mineral to form within, rather than on the fibrils, albeit at a faster rate than using pAsp alone.
7.3.2. The Specific Role of DPP
As stated before, pAsp (an acidic homopolymer) does not exist in vivo. pAsp does not have a collagen binding motif. Nudelman et al.(Nudelman et al., 2010) has shown that despite having: a collagen binding motif, two apatite binding sites (likely containing up to 5 phosphorylated serines,), 15% Glu residues and 12% Asp residues, that C-DMP-1, missing two-thirds of the total DMP-1 sequence, was unable to promote mineral formation within the collagen matrix on its own. Yet Nudelman et al. found that the combination of the C-DMP-1 binding motif and an acidic homopolymer (pAsp) produced mineral within the collagen fibril at a faster rate than pAsp alone. The work of Nudelman et al. highlights the importance of not just a polyacid, but also the importance of a collagen binding motif in collagen mineralization.
Although collagen is type I in both bone and dentin, bone is rich in DMP1, BSP and OPN while dentin is overwhelmingly rich in DPP. In bovine dentin, DPP has 1130 residues, 40% (452) are aspartic acid, 45% (518) are phosphorylated serine residues (Sabsay et al., 1991). DPP also has a collagen binding motif. Thus, DPP is a polyAsp-polyphosphorylated acidic heteropolymer, that binds to collagen. The PO4/COOH ratio for DPP is ≫1, whereas the bone SIBLINGS have PO4/COOH ≪1. Given this ratio, DPP has 1.3 times the charge density available for hydrated ion binding (both site and territorial) over the bone SIBLINGS. We propose that in-vivo the interaction of divalent cations with phosphorylated DPP is likely to produce a higher Ca binding, in general, delivering more Ca to the collagen matrix, as compared to BSP or OPN, and possibly contributes to a faster rate of dehydration of the DL phase. Comparatively, if the polyelectrolyte is an inorganic polyphosphate of the same size, the Ca sequestration by the polyphosphate should lead to inhibition (Hoac et al., 2013). If in such a case where polyphosphate is used it would create a DES of ions and the polymer; and if collagen mineralization happens to occur, it would likely proceed in a manner similar to the synthetic PILP processes, which as discussed earlier is absent a collagen binding motif.
DPP has been clearly demonstrated to bind to specific sites along collagen molecules (Dahl et al., 1998; Traub et al., 1992). In vitro binding experiments show that any non-specific binding of DPP to collagen is very DPP concentration dependent. The isoelectric pH of native collagen is pH ∼9, so the collagen at physiological pH has a slight positive charge, enhancing electrostatic interaction with DPP. In bovine dentin, there is approximately only 1 DPP molecule for every 5 collagen molecules. When an NCP like DPP first comes into contact with a collagen fibril, a DL existing within the territorial matrix of the protein combines with the hydration layer on the densely packed collagen fibrils, creating a territorial binding event, with the collagen fibril serving as the parent polyion and the protein serving as the complex counter ion. Eventually specific collagen site binding (like BSP in section 7.3.1) occurs between DPP and the e-band on collagen, providing the lowest free energy path within the DL phase for the development of the crystal phase within the hole zones as well as along exposed fibril surfaces of the collagen network.
Thus in vivo the localization of the DPP to a particular site within the fibril, either at the central gap e-band position (Traub et al., 1992), or at the nearby a-band boundary of the overlap region (George and Veis, 2008) may provide for an increase in DPP concentration at the gap-region, and lead to the nucleation of crystals (as we discussed with the work by Nudelman in section 7.3.1), so that growth can proceed without additional DPP.
Broadening the discussion to bone, Addadi and Weiner, (Addadi and Weiner, 1992) have pointed out that many of the proteins implicated in mineralization do not have unusually acidic compositions and argued that the interaction between the growing mineral and the polyelectrolyte or other polymer need not be specific. This is entirely consistent within the context of our proposed theory of DL phase promotion by polyelectrolytes, polymers or interfaces. A mineral associated protein does not need to be involved with epitactic nucleation of the mineral or even registry with a regular crystal lattice in order to promote DL phase formation. The ability to promote the formation of the DL phase and the ability to promote the nucleation of a crystalline mineral phase may be two different roles of a polyelectrolyte molecule.
8. Summary and Conclusions
The Weiner laboratory emphasized that crystal development in biomineralization must pass through an intermediate coalesced state (or states) and proposed that this was an amorphous solid phase which then transformed to the final crystalline state; specifically ACP to cAp or ACC to Aragonite or Calcite. They and many others did not focus attention on the nature of the initial densification process. But they did recognize that as the system spontaneously reached a lower state of free energy through crystallization that excess solvent needed to some how be removed at the same time. The purpose of this presentation is to show, in both apatite or carbonate systems in vivo, that densification follows a free energy trajectory in aqueous solutions in which ions and prenucleation clusters aggregate and proceed through a non-solid DL phase. Through coupled fluctuations in structure and density and a loss of water, critical clusters, n* (where the driving forces for growth and dissolution are in equilibrium) form. The prenucleation clusters of ions can grow further by single ion additions or by aggregation with other clusters that may increase in size in the DL to n*+1 (a nucleation cluster). This sequence can repeat itself more than once for multiple phases, eventually leading to a crystalline phase which has a lower cost (compared to within a solution) for further growth within the DL phase. The kinetics of the further densification and dehydration reaction is critically dependent on the state of the hydration of the interacting ions, and as discussed, this is affected by the composition of other components of the bulk solution and the ambient temperature. Thus we have focused this work not on crystallization itself but on the removal of water in this process.
In vivo, a biogenic mineralization system uses proteins and inorganic salts to contribute cooperatively to facilitate the construction of deep-eutectic solvent, a DL phase. The hydration structure of a biopolymer or protein matrix provides the information which dictates where the crystals grow within the protein matrix. The composition of this biologically mediated DL phase, will ultimately direct the end product, but the formation of a solid phase, be it amorphous or crystalline is the result of a further energy minimization of the DL phase, governed by the exchange and ultimate removal of bound water. The specialized structure of the collagen fibril, and the gap region spaces, have an arrangement of surface (1st layer) bound water particular to the D-periodic deposition of a dense liquid, which can facilitate a preferential pathway to crystal growth within the gap region. The presence of DPP at the border or within the gap zone (as revealed by the electron microscopic data) and its polyelectrolyte character with mobile territorially bound Ca2+ and the equally territorially bound, mobile, counter ion PO43− can provide the enhanced, localized, concentration required for apatite nucleation within the localized DL associated with the collagen fibrils. The final peeling away of these localized hydration layers provide the mechanism of formation of biogenic minerals.
Supplementary Material
Supplemental Figure S1: A comparison between a single-step (dotted red line) multi-step (solid black line), multi-phase, free energy diagram, which shows the discontinuous transitions from one phase to another, when the free energy is plotted as a function of a nucleation reaction coordinate. The thermodynamic stability of Phase B (i) and the free energy barrier (ii) to form Phase C can vary based on experimental conditions.
Supplemental Figure S2: A 2D schematic representation of a 3D dense liquid phase composed of hydrated ions and hydrated ion clusters resulting from Na2HPO4 and CaCl2 salts. Water molecules with light green and dark blue oxygen atoms represent bound water, while water molecules with red oxygen atoms represent free water. Calcium atoms are shown in orange with a ‘+’ designation, while phosphate molecules are shown with a dark green phosphorous atom, four light blue oxygen atoms and a ‘−’designation. The counter ions: hydrogen (small grey), sodium (red with a ‘+’ designation) and chloride (yellow with a ‘−’designation) are also shown. (a) Shows a full color representation of the bound water state while (b) shows a 50% faded color representation of the bound water state to highlight various possible ion configurations within the dense liquid phase.
Acknowledgments
We are pleased to acknowledge support from the National Institutes of Health, National Institute for Dental Research, Grant RO1-DE001374-53 for support of this work, and all earlier studies of dentin mineralization in our laboratory. We would like to thank the authors of the works we have cited, for their contribution to our understanding of the physical, chemical and biological world.
Footnotes
Publisher's Disclaimer: This is a PDF file of an unedited manuscript that has been accepted for publication. As a service to our customers we are providing this early version of the manuscript. The manuscript will undergo copyediting, typesetting, and review of the resulting proof before it is published in its final citable form. Please note that during the production process errors may be discovered which could affect the content, and all legal disclaimers that apply to the journal pertain.
References
- Abraham FF. Homogeneous nucleation theory: the pretransition theory of vapor condensation. Academic Press; 1974. [Google Scholar]
- Addadi L, Weiner S. Control and Design Principles in Biological Mineralization. Angewandte Chemie-International Edition in English. 1992;31:153–169. [Google Scholar]
- Alberts B. Essential Cell Biology: An Introducton to the Molecular Biology of the Cell. Garland Pub; 1998. [Google Scholar]
- Aliev MK, Dos Santos P, Hoerter JA, Soboll S, Tikhonov AN, et al. Water content and its intracellular distribution in intact and saline perfuse d rat hearts revisited. Cardiovascular Research. 2002;53:48–58. doi: 10.1016/s0008-6363(01)00474-6. [DOI] [PubMed] [Google Scholar]
- Anderson NL, Anderson NG. The Human Plasma Proteome. Molecular & Cellular Proteomics. 2002;1:845–867. doi: 10.1074/mcp.r200007-mcp200. [DOI] [PubMed] [Google Scholar]
- Baht GS, Hunter, Graeme K, Goldberg, Harvey A. Bone sialoprotein-collagen interaction promotes hydroxyapatite nucleation. Matrix Biology. 2008;27:600–608. doi: 10.1016/j.matbio.2008.06.004. [DOI] [PubMed] [Google Scholar]
- Balluffi RW, Allen SM, Carter WC. Kinetics of Materials. Wiley-Intersceince; 2005. [Google Scholar]
- Baumgartner J, Dey A, Bomans PHH, Le Coadou Cc, Fratzl P, et al. Nucleation and growth of magnetite from solution. Nat Mater. 2013;12:310–314. doi: 10.1038/nmat3558. [DOI] [PubMed] [Google Scholar]
- Becker GL, Chen CH, Greenawa Jw, Lehninge Al. Calcium-Phosphate Granules in Hepatopancreas of Blue-Crab Callinectes-Sapidus. Journal of Cell Biology. 1974;61:316–326. doi: 10.1083/jcb.61.2.316. [DOI] [PMC free article] [PubMed] [Google Scholar]
- Becker R, Doring W. Kinetic treatment of germ formation in supersaturated vapour. Annalen Der Physik. 1935;24:719–752. [Google Scholar]
- Beniash E, Aizenberg J, Addadi L, Weiner S. Amorphous calcium carbonate transforms into calcite during sea urchin larval spicule growth. Proceedings of the Royal Society B-Biological Sciences. 1997;264:461–465. [Google Scholar]
- Bewernitz MA, Gebauer D, Long J, Colfen H, Gower LB. A metastable liquid precursor phase of calcium carbonate and its interactions with polyaspartate. Faraday Discussions. 2012;159:291–312. [Google Scholar]
- Blumenthal NC, Betts F, Posner AS. Formation and Structure of Ca-Deficient Hydroxyapatite. Calcified Tissue International. 1981;33:111–117. doi: 10.1007/BF02409422. [DOI] [PubMed] [Google Scholar]
- Boedtker H, Doty P. The Native and Denatured States of Soluble Collagen. Journal of the American Chemical Society. 1956;78:4267–4280. [Google Scholar]
- Bohner M, Lemaitre J. Can bioactivity be tested in vitro with SBF solution? Biomaterials. 2009;30:2175–2179. doi: 10.1016/j.biomaterials.2009.01.008. [DOI] [PubMed] [Google Scholar]
- Boistelle R, Astier JP. Crystallization Mechanisms in Solution. Journal of Crystal Growth. 1988;90:14–30. [Google Scholar]
- Boothroyd B. Observations on Embryonic Chick-Bone Crystals by High Resolution Transmission Electron-Microscopy. Clinical Orthopaedics and Related Research. 1975:290–310. doi: 10.1097/00003086-197501000-00042. [DOI] [PubMed] [Google Scholar]
- Boskey AL. Noncollagenous Matrix Proteins and Their Role in Mineralization. Bone and Mineral. 1989a;6:111–123. doi: 10.1016/0169-6009(89)90044-5. [DOI] [PubMed] [Google Scholar]
- Boskey AL. Hydroxyapatite Formation in a Dynamic Collagen Gel System - Effects of Type-I Collagen, Lipids, and Proteoglycans. Journal of Physical Chemistry. 1989b;93:1628–1633. [Google Scholar]
- Boskey AL. Whats in a Name - the Function of the Mineralized Tissue Matrix Proteins. Journal of Dental Research. 1989c;68:159–159. doi: 10.1177/00220345890680021201. [DOI] [PubMed] [Google Scholar]
- Boskey AL, Posner AS. Conversion of Amorphous Calcium Phosphate to Microcrystalline Hydroxyapatite - Ph-Dependent, Solution-Mediated, Solid-Solid Conversion. Journal of Physical Chemistry. 1973;77:2313–2317. [Google Scholar]
- Boskey AL, Maresca M, Appel J. The Effects of Noncollagenous Matrix Proteins on Hydroxyapatite Formation and Proliferation in a Collagen Gel System. Connective Tissue Research. 1989;21:501–508. doi: 10.3109/03008208909050007. [DOI] [PubMed] [Google Scholar]
- Branca C, MagazÃ1 S, Maisano G, Migliardo F, Migliardo P, et al. Hydration Study of PEG/Water Mixtures by Quasi Elastic Light Scattering, Acoustic and Rheological Measurements. The Journal of Physical Chemistry B. 2002;106:10272–10276. [Google Scholar]
- Brooks R, Clark LM, Thurston EF. Calcium Carbonate and Its Hydrates. Philosophical Transactions of the Royal Society of London Series a-Mathematical and Physical Sciences. 1950;243:145–167. [Google Scholar]
- Brown BE. The Form and Function of Metal-Containing Granules in Invertebrate Tissues. Biological Reviews of the Cambridge Philosophical Society. 1982;57:621–667. [Google Scholar]
- Burgess J. Metal ions in solution. Ellis Horwood; 1978. [Google Scholar]
- Callister WD., Jr . Materials Science and Engineering an Introduction. 6th. John Wiley & Sons, Inc.; Hoboken, NJ: 2003. [Google Scholar]
- Carmichael DJ, Dodd CM. Investigation of Phosphoprotein of Bovine Dentin Matrix. Biochimica Et Biophysica Acta. 1973;317:187–192. doi: 10.1016/0005-2795(73)90211-0. [DOI] [PubMed] [Google Scholar]
- Carriazo D, Serrano MC, Gutierrez MC, Ferrer ML, del Monte F. Deep-eutectic solvents playing multiple roles in the synthesis of polymers and related materials. Chemical Society Reviews. 2012;41:4996–5014. doi: 10.1039/c2cs15353j. [DOI] [PubMed] [Google Scholar]
- Cygan RT, Wright K, Fisler DK, Gale JD, Slater B. Atomistic models of carbonate minerals: Bulk and surface structures, defects, and diffusion. Molecular Simulation. 2002;28:475–495. [Google Scholar]
- D'Angelo P, Migliorati V, Guidoni L. Hydration Properties of the Bromide Aqua Ion: the Interplay of First Principle and Classical Molecular Dynamics, and X-ray Absorption Spectroscopy. Inorganic Chemistry. 2010;49:4224–4231. doi: 10.1021/ic9025574. [DOI] [PubMed] [Google Scholar]
- Dahl T, Sabsay B, Veis A. Type I collagen-phosphophoryn interactions: Specificity of the monomer-monomer binding. J Struct Biol. 1998;123:162–168. doi: 10.1006/jsbi.1998.4025. [DOI] [PubMed] [Google Scholar]
- Dai LJ, Douglas EP, Gower LB. Compositional analysis of a polymer-induced liquid-precursor (PILP) amorphous CaCO3 phase. Journal of Non-Crystalline Solids. 2008;354:1845–1854. [Google Scholar]
- Dedek J. Le Carbonate De Chaux. Libraire Universitaire; Louvain: 1966. [Google Scholar]
- Demichelis R, Raiteri P, Gale JD, Quigley D, Gebauer D. Stable prenucleation mineral clusters are liquid-like ionic polymers. Nature Communications. 2011;2 doi: 10.1038/ncomms1604. [DOI] [PMC free article] [PubMed] [Google Scholar]
- Deshpande AS, Beniash E. Bioinspired synthesis of mineralized collagen fibrils. Crystal Growth & Design. 2008;8:3084–3090. doi: 10.1021/cg800252f. [DOI] [PMC free article] [PubMed] [Google Scholar]
- Dey A, Bomans PHH, Muller FA, Will J, Frederik PM, et al. The role of prenucleation clusters in surface-induced calcium phosphate crystallization. Nature Materials. 2010;9:1010–1014. doi: 10.1038/nmat2900. [DOI] [PubMed] [Google Scholar]
- DiMasi E, Kwak SY, Amos FF, Olszta MJ, Lush D, et al. Complementary control by additives of the kinetics of amorphous CaCO3 mineralization at an organic interface: In-situ synchrotron x-ray observations. Physical Review Letters. 2006;97 doi: 10.1103/PhysRevLett.97.045503. [DOI] [PubMed] [Google Scholar]
- Dodd CM, Carmichael DJ. Collagenous Matrix of Bovine Predentine. Biochimica Et Biophysica Acta. 1979;577:117–124. doi: 10.1016/0005-2795(79)90013-8. [DOI] [PubMed] [Google Scholar]
- Dorozhkin SV. Amorphous calcium (ortho)phosphates. Acta Biomaterialia. 2010;6:4457–4475. doi: 10.1016/j.actbio.2010.06.031. [DOI] [PubMed] [Google Scholar]
- Dreyer W, Duderstadt F. On the Becker/Doring theory of nucleation of l iquid droplets in solids. Journal of Statistical Physics. 2006;123:55–87. [Google Scholar]
- Dunitz JD. The Entropic Cost of Bound Water in Crystals and Biomolecules. Science. 1994;264:670–670. doi: 10.1126/science.264.5159.670. [DOI] [PubMed] [Google Scholar]
- Eanes ED, Posner AS. Intermediate Phases in Basic Solution Preparation of Alkaline Earth Phosphates. Calcified Tissue Research. 1968;2:38–&. doi: 10.1007/BF02279192. [DOI] [PubMed] [Google Scholar]
- Eanes ED, Gillessen IH, Posner AS. Intermediate states in the precipitation of hydroxyapatite. Nature. 1965;208:365–367. doi: 10.1038/208365a0. [DOI] [PubMed] [Google Scholar]
- Faatz M, Grohn F, Wegner G. Amorphous calcium carbonate: Synthesis and potential intermediate in biomineralization. Advanced Materials. 2004;16:996–+. [Google Scholar]
- Faatz M, Grohn F, Wegner G. Mineralization of calcium carbonate by controlled release of carbonate in aqueous solution. Materials Science & Engineering C-Biomimetic and Supramolecular Systems. 2005;25:153–159. [Google Scholar]
- Fayer MD. Dynamics of Water Interacting with Interfaces, Molecules, and Ions. Accounts of Chemical Research. 2012;45:3–14. doi: 10.1021/ar2000088. [DOI] [PMC free article] [PubMed] [Google Scholar]
- Fedotova MV, Kruchinin SE. Hydration of acetic acid and acetate ion in water studied by 1D-RISM theory. Journal of Molecular Liquids. 2011;164:201–206. [Google Scholar]
- Fullerton GD, Amurao MR. Evidence that collagen and tendon have monolayer water coverage in the native state. Cell Biology International. 2006;30:56–65. doi: 10.1016/j.cellbi.2005.09.008. [DOI] [PubMed] [Google Scholar]
- Fulton AB. How Crowded Is the Cytoplasm. Cell. 1982;30:345–347. doi: 10.1016/0092-8674(82)90231-8. [DOI] [PubMed] [Google Scholar]
- Gallicchio E, Kubo MM, Levy RM. Entropy-enthalpy compensation in solvation and ligand binding revisited. Journal of the American Chemical Society. 1998;120:4526–4527. [Google Scholar]
- Gebauer D, Volkel A, Colfen H. Stable Prenucleation Calcium Carbonate Clusters. Science. 2008;322:1819–1822. doi: 10.1126/science.1164271. [DOI] [PubMed] [Google Scholar]
- George A, Veis A. Phosphorylated Proteins and Control over Apatite Nucleation, Crystal Growth, and Inhibition. Chemical Reviews. 2008;108:4670–4693. doi: 10.1021/cr0782729. [DOI] [PMC free article] [PubMed] [Google Scholar]
- Gibbs JW, Bumstead HA, Van Name RG. Scientific Papers of J Willard Gibbs …: Thermodynamics. Longmans, Green and Company; 1906. [Google Scholar]
- Gibbs JW, Bumstead HA, Van Name RG, Longley WR. The collected works of J Willard Gibbs. Longmans Green and Co; 1928. [Google Scholar]
- Giraudguille MM. Liquid-Crystalline Phases of Sonicated Type-I Collagen. Biology of the Cell. 1989;67:97–101. doi: 10.1111/j.1768-322x.1989.tb03014.x. [DOI] [PubMed] [Google Scholar]
- Giraudguille MM. Liquid Crystallinity in Condensed Type-I Collagen Solutions -a Clue to the Packing of Collagen in Extracellular Matrices. Journal of Molecular Biology. 1992;224:861–873. doi: 10.1016/0022-2836(92)90567-4. [DOI] [PubMed] [Google Scholar]
- Glimcher M, Bonar L, Grynpas M, Landis W, Roufosse A. Recent studies of bone-mineral - is the amorphous calcium-phosphate theory valid. Journal of Crystal Growth. 1981;53:100–119. [Google Scholar]
- Gower LB, Odom DJ. Deposition of calcium carbonate films by a polymer-induced liquid-precursor (PILP) process. Journal of Crystal Growth. 2000;210:719–734. [Google Scholar]
- Habraken WJEM, Tao J, Brylka LJ, Friedrich H, Bertinetti L, et al. Ion-association complexes unite classical and non-classical theories for the biomimetic nucleation of calcium phosphate. Nat Commun. 2013;4:1507. doi: 10.1038/ncomms2490. [DOI] [PubMed] [Google Scholar]
- Hall CE, Doty P. A Comparison between the Dimensions of Some Macromolecules Determined by Electron Microscopy and by Physical Chemical Methods. Journal of the American Chemical Society. 1958;80:1269–1274. [Google Scholar]
- Hedges LO, Whitelam S. Limit of validity of Ostwald's rule of stages in a statistical mechanical model of crystallization. Journal of Chemical Physics. 2011;135 doi: 10.1063/1.3655358. [DOI] [PubMed] [Google Scholar]
- Henderson LJ. The fitness of the environment: an inquiry into the biological significance of the properties of matter. The Macmillan Company; 1913. [Google Scholar]
- Hoac B, Kiffer-Moreira T, Millan JL, McKee MD. Polyphosphates inhibit extracellular matrix mineralization in MC3T3-E1 osteoblast cultures. Bone. 2013;53:478–486. doi: 10.1016/j.bone.2013.01.020. [DOI] [PMC free article] [PubMed] [Google Scholar]
- Hunt TS. Further Contributions to the History of Lime and Mangesia Salts. American Journal of Science and Arts. 1866;42:49–67. [Google Scholar]
- Hunter GK, O'Young J, Grohe B, Karttunen M, Goldberg HA. The Flexible Polyelectrolyte Hypothesis of Protein-Biomineral Interaction. Langmuir. 2010;26:18639–18646. doi: 10.1021/la100401r. [DOI] [PubMed] [Google Scholar]
- Ikeda T, Boero M, Terakura K. Hydration properties of magnesium and calcium ions from constrained first principles molecular dynamics. Journal of Chemical Physics. 2007;127 doi: 10.1063/1.2768063. [DOI] [PubMed] [Google Scholar]
- Ikegami A. Hydration of polyacids. Biopolymers. 1968;6:431–440. doi: 10.1002/bip.1968.360060314. [DOI] [PubMed] [Google Scholar]
- Karenzi PC, Meurer B, Spegt P, Weill G. Divalent Paramagnetic Counterions Site Binding in Polyelectrolyte Solutions - Analysis of the Frequency-Dependence of the Water Protons Magnetic-Relaxation and the Characteristic Parameters of Site Binding. Biophys Chem. 1979;9:181–194. doi: 10.1016/0301-4622(79)87013-1. [DOI] [PubMed] [Google Scholar]
- Kashchiev D. Nucleation. Elsevier Science; 2000. [Google Scholar]
- Katz EP, Li S. Structure and Function of Bone Collagen Fibrils. Journal of Molecular Biology. 1973;80:1–15. doi: 10.1016/0022-2836(73)90230-1. [DOI] [PubMed] [Google Scholar]
- Kendall J. Pure liquids and liquid mixtures. (General introductory paper.) Transactions of the Faraday Society. 1937;33:0002–0007. [Google Scholar]
- Kerisit S, Liu CX. Molecular simulation of the diffusion of uranyl carbonate species in aqueous solution. Geochimica Et Cosmochimica Acta. 2010;74:4937–4952. [Google Scholar]
- Kirsch T. Biomineralization-An Active or Passive Process? Connective Tissue Research. 2012;53:438–445. doi: 10.3109/03008207.2012.730081. [DOI] [PubMed] [Google Scholar]
- Kokubo T, Takadama H. How useful is SBF in predicting in vivo bone bioactivity? Biomaterials. 2006;27:2907–2915. doi: 10.1016/j.biomaterials.2006.01.017. [DOI] [PubMed] [Google Scholar]
- Kritayakornupong C, Vchirawongkwin V, Hofer TS, Rodo BM. Structural and dynamical properties of hydrogen fluoride in aqueous solution: An ab initio quantum mechanical charge field molecular dynamics simulation. Journal of Physical Chemistry B. 2008;112:12032–12037. doi: 10.1021/jp805321c. [DOI] [PubMed] [Google Scholar]
- Landis WJ, Silver FH. The structure and function of normally mineralizing avian tendons. Comparative Biochemistry and Physiology a-Molecular & Integrative Physiology. 2002;133:1135–1157. doi: 10.1016/s1095-6433(02)00248-9. [DOI] [PubMed] [Google Scholar]
- Landis WJ, Silver FH. Mineral Deposition in the Extracellular Matrices of Vertebrate Tissues: Identification of Possible Apatite Nucleation Sites on Type I Collagen. Cells Tissues Organs. 2009;189:20–24. doi: 10.1159/000151454. [DOI] [PMC free article] [PubMed] [Google Scholar]
- Landis WJ, Hodgens KJ, Arena J, Song MJ, McEwen BF. Structural relations between collagen and mineral in bone as determined by high voltage electron microscopic tomography. Microscopy Research and Technique. 1996;33:192–202. doi: 10.1002/(SICI)1097-0029(19960201)33:2<192::AID-JEMT9>3.0.CO;2-V. [DOI] [PubMed] [Google Scholar]
- Lang T, Johanning K, Metzler H, Piepenbrock S, Solomon C, et al. The Effects of Fibrinogen Levels on Thromboelastometric Variables in the Presence of Thrombocytopenia. Anesthesia and Analgesia. 2009;108:751–758. doi: 10.1213/ane.0b013e3181966675. [DOI] [PubMed] [Google Scholar]
- Langford CH, Gray HB. Ligand substitution processes. W.A. Benjamin; 1966. [Google Scholar]
- Langmuir I. The constitution and fundamental properties of solids and liquids. II. Liquids. Journal of the American Chemical Society. 1917;39:1848–1906. [Google Scholar]
- Larson MA, Garside J. Solute Clustering in Supersaturated Solutions. Chemical Engineering Science. 1986a;41:1285–1289. [Google Scholar]
- Larson MA, Garside J. Solute Clustering and Interfacial-Tension. Journal of Crystal Growth. 1986b;76:88–92. [Google Scholar]
- Lay PA. Recent Developments on the Mechanisms of Substitution-Reactions of Octahedral Coordination-Complexes. Coordination Chemistry Reviews. 1991;110:213–233. [Google Scholar]
- Lei XL, Pan BC. Structures, Stability, Vibration Entropy and IR Spectra of Hydrated Calcium Ion Clusters [Ca(H2O)(n)](2+) (n=1-20, 27): A Systematic Investigation by Density Functional Theory. Journal of Physical Chemistry A. 2010;114:7595–7603. doi: 10.1021/jp102588m. [DOI] [PubMed] [Google Scholar]
- Lengyel VE. Zum Problem der Sphaerokristalle. Zeitschrift Fuer Kristallographie. 1937;97:67–87. [Google Scholar]
- Levy R, Shainber I. Calcium-Magnesium Exchange in Montmorillonite and Vermiculite. Clays and Clay Minerals. 1972;20:37–&. [Google Scholar]
- Liu Y, Kim YK, Dai L, Li N, Khan SO, et al. Hierarchical and non-hierarchical mineralisation of collagen. Biomaterials. 2011;32:1291–1300. doi: 10.1016/j.biomaterials.2010.10.018. [DOI] [PMC free article] [PubMed] [Google Scholar]
- Lodish H, Berk A, Kaiser CA, Krieger M, Scott MP. Molecular Cell Biology. Macmillan Higher Education; 2007. [Google Scholar]
- Loste E, Wilson RM, Seshadri R, Meldrum FC. The role of magnesium in stabilising amorphous calcium carbonate and controlling calcite morphologies. Journal of Crystal Growth. 2003;254:206–218. [Google Scholar]
- Lowenstam HA, Weiner S. Transformation of Amorphous Calcium-Phosphate to Crystalline Dahllite in the Radular Teeth of Chitons. Science. 1985;227:51–53. doi: 10.1126/science.227.4682.51. [DOI] [PubMed] [Google Scholar]
- Lowenstam HHA, Weiner S. On Biomineralization. Oxford University Press; 1989. [Google Scholar]
- Luft JR, Wolfley JR, Snell EH. What's in a Drop? Correlating Observations and Outcomes to Guide Macromolecular Crystallization Experiments. Crystal Growth & Design. 2011;11:651–663. doi: 10.1021/cg1013945. [DOI] [PMC free article] [PubMed] [Google Scholar]
- Lutsko JF. Nucleation of colloids and macromolecules: Does the nucleation pathway matter? Journal of Chemical Physics. 2012;136 doi: 10.1063/1.3698603. [DOI] [PubMed] [Google Scholar]
- Mahamid J, Addadi L, Weiner S. Crystallization Pathways in Bone. Cells Tissues Organs. 2011a;194:92–97. doi: 10.1159/000324229. [DOI] [PubMed] [Google Scholar]
- Mahamid J, Sharir A, Addadi L, Weiner S. Amorphous calcium phosphate is a major component of the forming fin bones of zebrafish: Indications for an amorphous precursor phase. Proceedings of the National Academy of Sciences of the United States of America. 2008;105:12748–12753. doi: 10.1073/pnas.0803354105. [DOI] [PMC free article] [PubMed] [Google Scholar]
- Mahamid J, Sharir A, Gur D, Zelzer E, Addadi L, et al. Bone mineralization proceeds through intracellular calcium phosphate loaded vesicles: A cryo-electron microscopy study. J Struct Biol. 2011b;174:527–535. doi: 10.1016/j.jsb.2011.03.014. [DOI] [PubMed] [Google Scholar]
- Mahamid J, Aichmayer B, Shimoni E, Ziblat R, Li CH, et al. Mapping amorphous calcium phosphate transformation into crystalline mineral from the cell to the bone in zebrafish fin rays. Proceedings of the National Academy of Sciences of the United States of America. 2010;107:6316–6321. doi: 10.1073/pnas.0914218107. [DOI] [PMC free article] [PubMed] [Google Scholar]
- Manning GS. Counterion Binding in Polyelectrolyte Theory. Accounts of Chemical Research. 1979;12:443–449. [Google Scholar]
- Meldrum FC, Sear RP. Materials Science Now You See Them. Science. 2008;322:1802–1803. doi: 10.1126/science.1167221. [DOI] [PubMed] [Google Scholar]
- Mertz EL, Leikin S. Interactions of inorganic phosphate and sulfate anions with collagen. Biochemistry. 2004;43:14901–14912. doi: 10.1021/bi048788b. [DOI] [PubMed] [Google Scholar]
- Mullaugh KM, Luther GW. Growth kinetics and long-term stability of CdS nanoparticles in aqueous solution under ambient conditions. J Nanopart Res. 2011;13:393–404. [Google Scholar]
- Navrotsky A. Energetic clues to pathways to biomineralization: Precursors, clusters, and nanoparticles. Proceedings of the National Academy of Sciences of the United States of America. 2004;101:12096–12101. doi: 10.1073/pnas.0404778101. [DOI] [PMC free article] [PubMed] [Google Scholar]
- Niederberger M, Colfen H. Oriented attachment and mesocrystals: Non-classical crystallization mechanisms based on nanoparticle assembly. Physical Chemistry Chemical Physics. 2006;8:3271–3287. doi: 10.1039/b604589h. [DOI] [PubMed] [Google Scholar]
- Niu L, Jiao K, Ryou H, Diogenes A, Yiu CKY, et al. Biomimetic silicification of demineralized hierarchical collagenous tissues. Biomacromolecules. 2013 doi: 10.1021/bm400316e. [DOI] [PMC free article] [PubMed] [Google Scholar]
- Nudelman F, Pieterse K, George A, Bomans PHH, Friedrich H, et al. The role of collagen in bone apatite formation in the presence of hydroxyapatite nucleation inhibitors. Nature Materials. 2010;9:1004–1009. doi: 10.1038/nmat2875. [DOI] [PMC free article] [PubMed] [Google Scholar]
- Olszta MJ, Cheng XG, Jee SS, Kumar R, Kim YY, et al. Bone structure and formation: A new perspective. Materials Science & Engineering R-Reports. 2007;58:77–116. [Google Scholar]
- Omelon S, Grynpas M. Polyphosphates Affect Biological Apatite Nucleation. Cells Tissues Organs. 2011;194:171–175. doi: 10.1159/000324845. [DOI] [PubMed] [Google Scholar]
- Omelon S, Baer A, Coyle T, Pilliar RM, Kandel R, et al. Polymeric crystallization and condensation of calcium polyphosphate glass. Materials Research Bulletin. 2008;43:68–80. [Google Scholar]
- Omelon S, Georgiou J, Henneman ZJ, Wise LM, Sukhu B, et al. Control of Vertebrate Skeletal Mineralization by Polyphosphates. Plos One. 2009;4 doi: 10.1371/journal.pone.0005634. [DOI] [PMC free article] [PubMed] [Google Scholar]
- Omelon SJ, Grynpas MD. Relationships between Polyphosphate Chemistry, Biochemistry and Apatite Biomineralization. Chemical Reviews. 2008;108:4694–4715. doi: 10.1021/cr0782527. [DOI] [PubMed] [Google Scholar]
- Onuma K, Ito A. Cluster growth model for hydroxyapatite. Chemistry of Materials. 1998;10:3346–3351. [Google Scholar]
- Orgel JPRO, Antonio JDS, Antipova O. Molecular and structural mapping of collagen fibril interactions. Connective Tissue Research. 2011;52:2–17. doi: 10.3109/03008207.2010.511353. [DOI] [PubMed] [Google Scholar]
- Orrielon S, Grynpas M. A nonradioactive method for detecting phospha t es and polyphosphates separated by PAGE. Electrophoresis. 2007;28:2808–2811. doi: 10.1002/elps.200600638. [DOI] [PubMed] [Google Scholar]
- Oxtoby DW. Homogeneous Nucleation - Theory and Experiment. J Phys-Condens Mat. 1992;4:7627–7650. [Google Scholar]
- Paolantoni M, Sassi P, Morresi A, Santini S. Hydrogen bond dynamics and water structure in glucose-water solutions by depolarized Rayleigh scattering and low-frequency Raman spectroscopy. Journal of Chemical Physics. 2007;127 doi: 10.1063/1.2748405. [DOI] [PubMed] [Google Scholar]
- Pavlov M, Siegbahn PEM, Sandstrom M. Hydration of beryllium, magnesium, calcium, and zinc ions using density functional theory. Journal of Physical Chemistry A. 1998;102:219–228. [Google Scholar]
- Politi Y, Arad T, Klein E, Weiner S, Addadi L. Sea urchin spine calcite forms via a transient amorphous calcium carbonate phase. Science. 2004;306:1161–1164. doi: 10.1126/science.1102289. [DOI] [PubMed] [Google Scholar]
- Posner AS, Betts F. Synthetic Amorphous Calcium-Phosphate and Its Relation to Bone-Mineral Structure. Accounts of Chemical Research. 1975;8:273–281. [Google Scholar]
- Posner AS, Betts F, Blumenthal NC. Properties of Nucleating Systems. Metabolic Bone Disease & Related Research. 1978;1:179–183. [Google Scholar]
- Pouget EM, Bomans PHH, Goos JACM, Frederik PM, de With G, et al. The Initial Stages of Template-Controlled CaCO3 Formation Revealed by Cryo-TEM. Science. 2009;323:1455–1458. doi: 10.1126/science.1169434. [DOI] [PubMed] [Google Scholar]
- Pribil AB, Hofer TS, Randolf BR, Rode BM. Structure and dynamics of phosphate ion in aqueous solution: An ab initio QMCF MD study. Journal of Computational Chemistry. 2008;29:2330–2334. doi: 10.1002/jcc.20968. [DOI] [PubMed] [Google Scholar]
- Price PA, Toroian D, Lim JE. Mineralization by Inhibitor Exclusion The calcfiication of collagen with fetuin. Journal of Biological Chemistry. 2009;284:17092–17101. doi: 10.1074/jbc.M109.007013. [DOI] [PMC free article] [PubMed] [Google Scholar]
- Putnam FW. The plasma proteins: structure, function, and genetic control. Academic Press; 1975. [Google Scholar]
- Qi L, Coelfen H, Antonietti M. Synthesis and Characterization of CdS Nanoparticles Stabilized by Double-Hydrophilic Block Copolymers. Nano Letters. 2001;1:61–65. [Google Scholar]
- Rabie AM, Veis A. An immunocytochemical study of the routes of secretion of collagen and phosphophoryn from odontoblasts into dentin. Connective Tissue Research. 1995;31:197–209. doi: 10.3109/03008209509010811. [DOI] [PubMed] [Google Scholar]
- Ramachandran GN, Kartha G. Structure of Collagen. Nature. 1954;174:269–270. doi: 10.1038/174269c0. [DOI] [PubMed] [Google Scholar]
- Ramachandran GN, Kartha G. Structure of Collagen. Nature. 1955;176:593–595. doi: 10.1038/176593a0. [DOI] [PubMed] [Google Scholar]
- Rich A, Crick FHC. Structure of Collagen. Nature. 1955;176:915–916. doi: 10.1038/176915a0. [DOI] [PubMed] [Google Scholar]
- Richens DT. The chemistry of aqua ions: synthesis, structure, and reactivity : a tour through the periodic table of the elements. J. Wiley; 1997. [Google Scholar]
- Rieger J, Frechen T, Cox G, Heckmann W, Schmidt C, et al. Precursor structures in the crystallization/precipitation processes of CaCO3 and control of particle formation by polyelectrolytes. Faraday Discussions. 2007;136:265–277. doi: 10.1039/b701450c. [DOI] [PubMed] [Google Scholar]
- Sabsay B, Stetlerstevenson WG, Lechner JH, Veis A. Domain-Structure and Sequence Distribution in Dentin Phosphophoryn. Biochemical Journal. 1991;276:699–707. doi: 10.1042/bj2760699. [DOI] [PMC free article] [PubMed] [Google Scholar]
- Silver FH, Landis WJ. Deposition of apatite in mineralizing vertebrate extracellular matrices: A model of possible nucleation sites on type I collagen. Connective Tissue Research. 2011;52:242–254. doi: 10.3109/03008207.2010.551567. [DOI] [PubMed] [Google Scholar]
- Silver FH, Freeman JW, Horvath I, Landis WJ. Molecular basis for elastic energy storage in mineralized tendon. Biomacromolecules. 2001;2:750–756. doi: 10.1021/bm0100615. [DOI] [PubMed] [Google Scholar]
- Sohnel O, Garside J. Solute Clustering and Nucleation. Journal of Crystal Growth. 1988;89:202–208. [Google Scholar]
- Sommerdijk NAJM. Personal Communication. 2010. [Google Scholar]
- Spegt P, Weill G. Magnetic-Resonance Distinction between Site Bound and Atmospherically Bound Paramagnetic Counterions in Polyelectrolyte Solutions. Biophys Chem. 1976;4:143–149. doi: 10.1016/0301-4622(76)85004-1. [DOI] [PubMed] [Google Scholar]
- Squire PG, Himmel ME. Hydrodynamics and Protein Hydration. Archives of Biochemistry and Biophysics. 1979;196:165–177. doi: 10.1016/0003-9861(79)90563-0. [DOI] [PubMed] [Google Scholar]
- Stetlerstevenson WG, Veis A. Type-I Collagen Shows a Specific Binding-Affinity for Bovine Dentin Phosphophoryn. Calcified Tissue International. 1986;38:135–141. doi: 10.1007/BF02556873. [DOI] [PubMed] [Google Scholar]
- Stetlerstevenson WG, Veis A. Bovine Dentin Phosphophoryn - Calcium-Ion Binding-Properties of a High-Molecular-Weight Preparation. Calcified Tissue International. 1987;40:97–102. doi: 10.1007/BF02555712. [DOI] [PubMed] [Google Scholar]
- Svergun DI, Richard S, Koch MHJ, Sayers Z, Kuprin S, et al. Protein hydration in solution: Experimental observation by x-ray and neutron scattering. Proceedings of the National Academy of Sciences of the United States of America. 1998;95:2267–2272. doi: 10.1073/pnas.95.5.2267. [DOI] [PMC free article] [PubMed] [Google Scholar]
- Talanquer V, Oxtoby DW. Crystal nucleation in the presence of a metastable citical point. Journal of Chemical Physics. 1998;109:223–227. [Google Scholar]
- Tansel B, Sager J, Rector T, Garland J, Strayer RF, et al. Significance of hydrated radius and hydration shells on ionic permeability during nanofiltration in dead end and cross flow modes. Separation and Purification Technology. 2006;51:40–47. [Google Scholar]
- Tao JH, Pan HH, Wang JR, Wu J, Wang B, et al. Evolution of amorphous calcium phosphate to hydroxyapatite probed by gold nanoparticles. J Phys Chem C. 2008;112:14929–14933. [Google Scholar]
- Tay FR, Pashley DH. Biomimetic Remineralization of Resin-bonded Acid-etched Dentin. Journal of Dental Research. 2009;88:719–724. doi: 10.1177/0022034509341826. [DOI] [PMC free article] [PubMed] [Google Scholar]
- tenWolde PR, Frenkel D. Enhancement of protein crystal nucleation by critical density fluctuations. Science. 1997;277:1975–1978. doi: 10.1126/science.277.5334.1975. [DOI] [PubMed] [Google Scholar]
- Termine JD, Posner AS. Calcium Phosphate Formation in-Vitro .1. Factors Affecting Initial Phase Separation. Archives of Biochemistry and Biophysics. 1970;140:307–&. doi: 10.1016/0003-9861(70)90071-8. [DOI] [PubMed] [Google Scholar]
- Traub W, Jodaikin A, Arad T, Veis A, Sabsay B. Dentin Phosphophoryn Binding to Collagen Fibrils. Matrix. 1992;12:197–201. doi: 10.1016/s0934-8832(11)80062-4. [DOI] [PubMed] [Google Scholar]
- Tung MS, Brown WE. An Intermediate State in Hydrolysis of Amorphous Calcium-Phosphate. Calcified Tissue International. 1983;35:783–790. doi: 10.1007/BF02405124. [DOI] [PubMed] [Google Scholar]
- Uversky VN. What does it mean to be natively unfolded? European Journal of Biochemistry. 2002;269:2–12. doi: 10.1046/j.0014-2956.2001.02649.x. [DOI] [PubMed] [Google Scholar]
- Vchirawongkwin V, Rode BM, Persson I. Structure and Dynamics of Sulfate Ion in Aqueous SolutionAn ab initio QMCF MD Simulation and Large Angle X-ray Scattering Study. The Journal of Physical Chemistry B. 2007;111:4150–4155. doi: 10.1021/jp0702402. [DOI] [PubMed] [Google Scholar]
- Vchirawongkwin V, Kritayakornupong C, Tongraar A, Rode BM. Symmetry Breaking and Hydration Structure of Carbonate and Nitrate in Aqueous Solutions: A Study by Ab Initio Quantum Mechanical Charge Field Molecular Dynamics. The Journal of Physical Chemistry B. 2011;115:12527–12536. doi: 10.1021/jp204809f. [DOI] [PubMed] [Google Scholar]
- Vecht A, Ireland TG. The role of vaterite and aragonite in the formation of pseudo-biogenic carbonate structures: Implications for Martian exobiology. Geochimica Et Cosmochimica Acta. 2000;64:2719–2725. doi: 10.1016/s0016-7037(00)00381-1. [DOI] [PubMed] [Google Scholar]
- Veis A. Mineralization in organic matrix frameworks. Biomineralization. 2003;54:249–289. [Google Scholar]
- Veis A, Schlueter RJ. Presence of Phosphate-Mediated Cross-Linkages in Hard Tissue Collagens. Nature. 1963;197:1204–&. doi: 10.1038/1971204a0. [DOI] [PubMed] [Google Scholar]
- Veis A, Perry A. Phosphoprotein of Dentin Matrix. Biochemistry. 1967;6:2409–&. doi: 10.1021/bi00860a017. [DOI] [PubMed] [Google Scholar]
- Veis A, Sabsay B. Bone and Tooth Formation Insights into Mineralization Strategies. In: Westbroek P, Jong EW, editors. Biomineralization and Biological Metal Accumulation. Springer; Netherlands: 1982. pp. 273–284. [Google Scholar]
- Veis A, Dorvee JR. Biomineralization Mechanisms: A New Paradigm for Crystal Nucleation in Organic Matrices. Calcified Tissue International. 2012:1–9. doi: 10.1007/s00223-012-9678-2. [DOI] [PMC free article] [PubMed] [Google Scholar]
- Vekilov PG. Dense liquid precursor for the nucleation of ordered solid phases from solution. Crystal Growth & Design. 2004;4:671–685. [Google Scholar]
- Vekilov PG. Nucleation. Crystal Growth & Design. 2010;10:5007–5019. doi: 10.1021/cg1011633. [DOI] [PMC free article] [PubMed] [Google Scholar]
- Wang Y, Azais T, Robin M, Vallee A, Catania C, et al. The predominant role of collagen in the nucleation, growth, structure and orientation of bone apatite. Nature Materials. 2012;11:724–733. doi: 10.1038/nmat3362. [DOI] [PubMed] [Google Scholar]
- Weiner S, Hood L. Soluble-Protein of Organic Matrix of Mollusk Shells -Potential Template for Shell Formation. Science. 1975;190:987–988. doi: 10.1126/science.1188379. [DOI] [PubMed] [Google Scholar]
- Weiner S, Price PA. Disaggregation of Bone into Crystals. Calcified Tissue International. 1986;39:365–375. doi: 10.1007/BF02555173. [DOI] [PubMed] [Google Scholar]
- Weiner S, Traub W. Bone-Structure - from Angstroms to Microns. Faseb Journal. 1992;6:879–885. [PubMed] [Google Scholar]
- Weinstock M, Leblond CP. Autoradiographic Visualization of Deposition of a Phosphoprotein at Mineralization Front in Dentin of Rat Incisor. Journal of Cell Biology. 1973;56:838–845. doi: 10.1083/jcb.56.3.838. [DOI] [PMC free article] [PubMed] [Google Scholar]
- Weinstock M, Leblond CP. Synthesis, Migration, and Release of Precursor Collagen by Odontoblasts as Visualized by Autoradiography after [H-3]Proline Administration. Journal of Cell Biology. 1974;60:92–127. doi: 10.1083/jcb.60.1.92. [DOI] [PMC free article] [PubMed] [Google Scholar]
- Weiss IM, Tuross N, Addadi L, Weiner S. Mollusc larval shell formation: Amorphous calcium carbonate is a precursor phase for aragonite. Journal of Experimental Zoology. 2002;293:478–491. doi: 10.1002/jez.90004. [DOI] [PubMed] [Google Scholar]
- Wolf SE, Leiterer J, Kappl M, Emmerling F, Tremel W. Early homogenous amorphous precursor stages of calcium carbonate and subsequent crystal growth in levitated droplets. Journal of the American Chemical Society. 2008;130:12342–12347. doi: 10.1021/ja800984y. [DOI] [PubMed] [Google Scholar]
- Xu XR, Han JT, Cho KL. Deposition of amorphous calcium carbonate hemispheres on substrates. Langmuir. 2005;21:4801–4804. doi: 10.1021/la047069v. [DOI] [PubMed] [Google Scholar]
- Zeiger DN, Miles WC, Eidelman N, Lin-Gibson S. Cooperative Calcium Phosphate Nucleation within Collagen Fibrils. Langmuir. 2011;27:8263–8268. doi: 10.1021/la201361e. [DOI] [PubMed] [Google Scholar]
Associated Data
This section collects any data citations, data availability statements, or supplementary materials included in this article.
Supplementary Materials
Supplemental Figure S1: A comparison between a single-step (dotted red line) multi-step (solid black line), multi-phase, free energy diagram, which shows the discontinuous transitions from one phase to another, when the free energy is plotted as a function of a nucleation reaction coordinate. The thermodynamic stability of Phase B (i) and the free energy barrier (ii) to form Phase C can vary based on experimental conditions.
Supplemental Figure S2: A 2D schematic representation of a 3D dense liquid phase composed of hydrated ions and hydrated ion clusters resulting from Na2HPO4 and CaCl2 salts. Water molecules with light green and dark blue oxygen atoms represent bound water, while water molecules with red oxygen atoms represent free water. Calcium atoms are shown in orange with a ‘+’ designation, while phosphate molecules are shown with a dark green phosphorous atom, four light blue oxygen atoms and a ‘−’designation. The counter ions: hydrogen (small grey), sodium (red with a ‘+’ designation) and chloride (yellow with a ‘−’designation) are also shown. (a) Shows a full color representation of the bound water state while (b) shows a 50% faded color representation of the bound water state to highlight various possible ion configurations within the dense liquid phase.