

Abstract
This chapter is devoted to the role of genetic variation and gene-exercise interactions in the biology of adaptation to exercise. There is evidence from genetic epidemiology research that DNA sequence differences contribute to human variation in physical activity level, cardiorespiratory fitness in the untrained state, cardiovascular and metabolic response to acute exercise, and responsiveness to regular exercise. Methodological and technological advances have made it possible to undertake the molecular dissection of the genetic component of complex, multifactorial traits, such as those of interest to exercise biology, in terms of tissue expression profile, genes, and allelic variants. The evidence from animal models and human studies is considered. Data on candidate genes, genome-wide linkage results, genome-wide association findings, expression arrays, and combinations of these approaches are reviewed. Combining transcriptomic and genomic technologies has been shown to be more powerful as evidenced by the development of a recent molecular predictor of the ability to increase VO2max with exercise training. For exercise as a behavior and physiological fitness as a state to be major players in public health policies will require that that the role of human individuality and the influence of DNA sequence differences be understood. Likewise, progress in the use of exercise in therapeutic medicine will depend to a large extent on our ability to identify the favorable responders for given physiological properties to a given exercise regimen.
Introduction
This chapter is devoted to the role of genetic variation and gene-exercise interactions in the biology of adaptation to exercise. The basic principles of genomics, genetics, epigenomics, and transcriptomics are introduced for the reader less familiar with these concepts and the underlying technologies and science. The evidence accumulated from quantitative genetics and genetic epidemiology research is summarized, as it provides a foundation for the advances that were later made at the molecular level. The role of genetic differences in the inclination to be physically active or to exercise vigorously is then reviewed. This is followed by comprehensive sections focused on the role of genetic variation in cardiorespiratory endurance and skeletal muscle strength and power. The contribution of genetic variation to the ability to respond to regular exercise is discussed. Studies on gene expression and the global transcriptome, as they pertain to adaptation to exercise and exercise-induced changes in performance indicators, risk factors, and disease outcomes are summarized. Emerging data on approaches combining genomics and transcriptomics with an emphasis on the physiological adaptation to regular exercise are highlighted. A brief discussion of the most promising research strategies and technologies for the discovery of the molecular mechanisms responsible for the cardiovascular, pulmonary, hormonal, and metabolic adaptation to acute exercise and exercise training and their influences on health indicators and disease outcomes completes the chapter.
Definitions, concepts, and models
Genomes and genes
The blueprint of the human organism is specified in the genetic code in the form of the deoxyribonucleic acid (DNA) sequence of the 23 pairs of chromosomes found in every nucleated cell and the genes encoded in the mitochondrial DNA. The term human genome refers to the total genetic information in human cells. The human nuclear genome consists of 22 pairs of autosomes (non-sex-specific chromosomes) and two sex chromosomes. Individuals inherit half of their genome from their father (22 autosomes and either X or Y sex chromosome) and half from their mother (22 autosomes and X chromosome).
A chromosome is constructed of two complementary strands of DNA. DNA molecules are large polypeptides in which the backbone of the molecule is composed of five-carbon sugar residues, deoxyribose. The adjacent deoxyribose molecules of a DNA strand are linked by covalent phosphodiester bonds. The genetic information in each chromosome is stored in a long string of the four DNA bases: adenine (A), cytosine (C), guanine (G), and thymine (T). The order and number of the bases determine the information content of each gene. The DNA bases are attached to a deoxyribose molecule by a covalent bond with a carbon atom in the l′-position of the molecule. A unit formed by a deoxyribose sugar, an attached base, and a phosphate group forms the basic repeat unit of a DNA strand, i.e., the nucleotide. The complementary DNA strands are held together with relatively weak hydrogen bonds between the complementary nucleotides (C pairs with G, A with T). The linear structure of bases in the DNA strands is called the primary structure of the chromosome. The secondary structure of the chromosome arises when the two complementary strands of DNA twist to form a double helix.
A typical gene consists of coding sequences (exons), noncoding regions (introns), and regulatory sequences located both before (5′-end; promoter region) and after (3′-untranslated region [UTR]) the coding regions of the gene. The number of exons is quite heterogeneous, with a range from one (e.g., intronless G-protein-coupled receptor genes) to several hundreds (e.g., titin gene with 363 exons). Introns may harbor several regulatory elements, such as alternative promoters, and splicing enhancers and suppressors. More recently, they were found to also contain small, noncoding RNA genes, such as microRNAs (miRNAs). DNA is constantly exposed to insults that cause damage, which is repaired by compensatory mechanisms that have specifically evolved for this purpose.
A genome refers to the complement of all genes of an organism. Human genomics is the science that investigates the features and properties of the human genome. With the completion of the first draft of the sequence of the human genome in 2001 (160, 348), it became possible to begin to investigate in depth the architecture of the human genome. An excellent expose of the organization of the human genome can be found in Strachan and Read (313). It was confirmed that the length of the genome is of the order of 3 billion base pairs of DNA. Most importantly, since then, the definition of what is a gene has been evolving. The number of human protein coding genes is slightly more than 20,000 but with each of these sequences generally encoding more than one protein through alternative splicing, reverse strand transcripts, and other mechanisms. Bidirectional transcription is also recognized to be a common occurrence. Some evidence suggests that there may be on average as many as five encoded transcripts per gene sequence. The sequences of the human genome that actually encode proteins represent only about 2% of the DNA complement. Of great importance, it is now realized that there are thousands of genomic regions encoding “noncoding RNA transcripts.” These RNAs are involved in the regulation of gene expression and of translation of messenger RNAs (mRNAs) (185). More than 6,000 small RNA transcripts have been identified thus far. They fall into several categories: small nuclear RNA (snRNA), small nucleolar RNA (snoRNA), miRNA, and short interfering RNA (siRNA), plus a few others. Noncoding RNAs are viewed as major regulatory molecules involved in embryonic development, adaptation to cellular stresses, cancer, and a variety of biological processes. Their role in adaptation to exercise is just beginning to be examined.
Epigenome
As alluded above, the double-stranded DNA of a chromosome is packaged very tightly. The basic unit of this packaging is the nucleosome, which is composed of 147 DNA base pairs wrapped around 8 histones, 2 each of the histone proteins H2A, H2B, H3, and H4. Each nucleosome is linked with the next one by a fragment of free DNA, stabilized by H1, the linker histone. A number of chemical modifications may alter the histone of nucleosomes, including acetylation, methylation, and phosphorylation. Histone modification patterns can influence the conformation of chromatin and thus potentially transcription activity. Moreover, DNA can also be modified when a cytosine base is methylated in the 5′-position. Methylation occurs when cytosine is followed by a guanine, a sequence known as a CpG island. DNA methylation has been linked with the repression of transcription (although it can occur at a binding site for a repressor and thus enhance transcription). The methyl group constitutes a signal recognized by methyl CpG binding proteins, which play a role in chromatin structure and gene expression. Most of the CpG islands in the genome are methylated in the basal, natural state. However, other sites can be methylated, as occurs during development or with the repression of tumor suppressor genes and as is commonly seen in the inactivation of one X chromosome in the complement of cells of females.
Epigenetic alterations do not involve changes in the DNA sequence. However, they are often transmitted from one cell to daughter cells at mitosis. Some of the epigenetic changes have also been shown to be passed from one generation to the next through the germ lines. It is widely accepted that epigenetic modifications can occur at all ages as a result of exposure to nutrients, cellular insults, stress, etc. Whether exercise or profound levels of inactivity are stimuli that can trigger epigenetic events remains to be established.
Gene expression
Since all somatic cells of mammalian organisms have the same set of chromosomes and genes of the species, the various types of cells result primarily from differential expression of informative DNA sequences of these cells. The main control point of differential expression regulation from the perspective of this chapter is at the level of transcription, but it is important to recognize that differential expression can also occur at the translation phase. The latter depends on key cellular elements and especially siRNAs and miRNAs, with miRNA being the predominant endogenous small, noncoding RNA regulatory species. Binding sites are commonly found for these noncoding RNAs in the 3′-untranslated segments of mRNA molecules, where binding can lead to transcript degradation or translation block in vivo.
Human studies based on large-scale exploration of transcript abundance have indicated that most of the nuclear DNA is actually transcribed. Since most of the DNA is in so-called noncoding regions, the significance of this observation is not clear yet. Comparisons of transcript abundance across tissues are needed to understand how the transcriptome profile relates to tissue type and function. This is an area in which exercise–focused studies are warranted. Chromatin conformation at sites of interest is a key determinant of transcription. Transcription requires at the site of initiation a large complex of tissue-specific transcription factors plus a number of activator or repressor elements. Transcription activity is also modulated by proteins that bind to specific DNA enhancing or repressing sequence motifs that can be at some distance from the initiation site. The key transcription molecule for peptide-encoding sequences and small, noncoding RNAs that needs to access the targeted DNA region and be activated is RNA polymerase II in humans.
Gene expression being so dependent on chromatin state, it is easy to see that epigenomic events altering DNA methylation levels and histone chemistry can have a strong influence on the transcription of a given gene or noncoding sequence. Again, this is a cutting-edge area of cellular biology that needs to be thoroughly investigated for the potential role of activity and inactivity.
Mitochondrial genome
A mitochondrion carries a simple circular DNA sequence of 16,569 DNA pairs that encode 37 genes, 13 of them coding for peptides of the oxidative phosphorylation system, 2 for mitochondrial ribosomal ribonucleic acid (rRNA) molecules, and 22 producing mitochondrial transfer RNAs (tRNAs). Mitochondrial DNA is derived from the mother and is characterized by cytoplasmic inheritance. The nuclear-encoded POLRMT gene serves as the RNA polymerase for mitochondrial DNA. Most of the proteins necessary for mitochondrial structure and function are encoded in the nuclear DNA and are exported to the mitochondria. Further, recent evidence suggests that several nuclear-encoded mRNAs are translated into protein in the mitochondria. Cells can contain thousands of mitochondrial DNA molecules. Mitochondrial DNA exhibits a higher mutation rate than nuclear DNA. The latter phenomenon has important consequences for the aging process and for disease risks, particularly in tissues that have a high oxidative capacity. However, in somatic cells, mutant mitochondrial DNA molecules generally cohabit with perfectly normal DNA molecules, a phenomenon known as heteroplasmy. The traits or diseases associated with defects in mitochondrial DNA may show variable penetrance depending on the population of mutated DNA relative to the normal DNA molecules in affected cells and tissues.
Genetics and inheritance
If genomics is the science of the characteristics of the genome, genetics is the science focused on the transmission of traits or phenotypes across generations. In the simplest situation, the observed trait is determined by a single gene with two alleles. In this case, the pattern of inheritance can be recognized in a pedigree analysis, is defined as Mendelian, and can be specified as recessive, dominant, or codominant. Whether the penetrance of the gene is variable and is associated with the sex of the parent or the offspring or some other characteristic can also generally be defined. Examples of such traits can be found in blood serology and in tissue antigenic properties. However, traits of interest to exercise biologists are rarely of this type. They tend to be influenced by many genes and are referred to as quantitative and polygenic phenotypes.
Quantitative traits such as total adiposity, heart size, or maximal oxygen uptake exhibit large interindividual differences. This human variation persists even if we divide subjects into more homogeneous groups based on sex, age, and body mass. The distribution of phenotype scores often approximates a normal Gaussian curve, but it can also be skewed. Given this large heterogeneity, it is a challenge to define the pattern of inheritance, as the effects of single genes are typically not recognizable. The study of these quantitative traits has given rise to the field of genetic epidemiology, whose aim is to define the contribution of genetic factors to human biological and behavioral traits and to specify the inheritance patterns. Genetic epidemiology has played a key role in providing evidence for a role of genetic differences in exercise-related phenotypes and in providing the foundation for ongoing studies at the molecular level. The next section reviews the methods used and the evidence obtained from genetic epidemiology approaches over the past few decades.
As progress is being made in defining the genetic anatomy of complex human traits, such as those of interest to exercise physiologists, it is becoming obvious that a major challenge is and will continue to be understanding what is driving the association between genotype and phenotype. It is clear that knowing one’s genotype is not sufficient to explain entirely the variation in a trait, as there are many modulating variables including epigenomic status, cellular and tissue energy and nutrient levels, role of alternate or compensatory pathways, and other contributing factors.
Evidence from genetic epidemiology
Two topics are discussed in this section. First, we briefly review the methods commonly used to determine whether a quantitative exercise-related trait has a genetic component significantly different from the null. Second, we summarize the evidence for the presence of a significant genetic variance for a number of traits of interest to exercise biologists.
Methods
The first question to address when dealing with quantitative traits of relevance to exercise biology is whether a phenotype is influenced by genetic differences at all. In rodent models, comparisons among strains and various breeding strategies between inbred or outbred strains have been used successfully to quantify the magnitude of the genetic effect in a trait variance or to select for a particular trait, assuming that there is a significant additive genetic component.
In humans, statistical genetic approaches have been traditionally used to investigate the contribution of genetic determinants to quantitative phenotypes and to test hypotheses regarding a variety of models of inheritance. In this regard, designs encompassing monozygotic (MZ) and dizygotic (DZ) twins, nuclear families, and/or families with adopted children have been the most commonly used. Genetic epidemiology has traditionally asked a series of interrelated questions that were designed to set the stage for molecular and gene-based studies.
Familial aggregation
A classical first step is to establish whether or not a quantitative trait aggregates in families. This is usually achieved by comparing the variance between families for a given trait to the variance among family members. A significantly higher between-family than within-family variance (significant Fratio) suggests that individuals of the same family are more similar than individuals of different families, which in turn suggests familial resemblance.
The presence of familial aggregation for a discrete trait or a disease can be quantified by the occurrence within families of cases (affected or exhibiting a high or a low level of a trait) as compared to families of controls (unaffected or normal level of a trait, etc.) or the population at large. If a reliable estimate of the trait prevalence in the general population is available, the familial aggregation (familial risk) of a discrete trait can be expressed by the lambda coefficient:
where P(A) is the population prevalence of the trait, and P(A|R) is the trait prevalence among relatives of an affected proband (268). For quantitative traits, the lambda coefficient is defined as:
where P(l) is the probability that a randomly selected person in the general population has a trait value in the lth segment of the trait distribution, and PR(l|h) is the probability that a person has a trait value in the lth segment given that a relative of type R has a trait value in the hth segment (103). For instance, using this approach, familial risk ratios for physical fitness phenotypes have been reported for a stratified sample of the Canadian population (140).
Heritability level
If a trait aggregates in families, the next step is to quantify the estimated contribution of genetic factors to the familial aggregation. The genetic analysis of multifactorial phenotypes is based on a partitioning of the total phenotypic variance (VP) into genetic and environmental components as follows:
where VG is the genetic component of the variance, VC is the common (shared) environmental variance, and VE is the residual or non-shared environmental variance. These variance components can be further partitioned to include specific components such as gene-by-environment interaction (GxE), gene-by-gene interactions, epistasis, or dominance deviations. The heritability (h2) of the trait is defined as the proportion of total phenotypic variance explained by the genetic factors (h2 = VG/VP).
The components of variance can be estimated from phenotypic covariance between pairs of relatives. The expected additive genetic, dominance genetic, and shared environmental covariances for different types of relatives are summarized in Table 1. The heritability estimates are based on comparisons of phenotypic similarities between pairs of relatives with different levels of biological relatedness. For example, biological siblings, who share about 50% of their genes identical by descent (IBD), should be phenotypically more similar than their parents (biologically unrelated individuals) if genetic factors contribute to the trait of interest. Likewise, a greater phenotypic resemblance between MZ twins (100% of genetic variation IBD) than between DZ twins (50% of genetic variation IBD) suggests a genetic contribution to the phenotype.
Table 1.
Expected covariances for different types of relative pairs
| Types of relatives | Coefficient for
|
||
|---|---|---|---|
| Additive genetic | Dominance | Shared environment | |
| Spouse-spouse | 0 | 0 | 1 |
| Parent-child (living together) | 1/2 | 0 | 1 |
| Full sibs (living together) | 1/2 | 1/4 | 1 |
| Full sibs (living apart) | 1/2 | 1/4 | 0 |
| Half sibs (living together) | 1/4 | 0 | 1 |
| Half sibs (living apart) | 1/4 | 0 | 0 |
| Aunt/uncle-niece/nephew | 1/4 | 0 | 0 |
| First cousins (living apart) | 1/8 | 0 | 0 |
| Dbl. first cousins (living apart) | 1/4 | 1/16 | 0 |
| DZ twins (living together) | 1/2 | 1/4 | 1 |
| MZ twins (living together) | 1 | 1 | 1 |
The quantification of the heritability of complex, multifactorial traits requires data on relatives with different degrees of relatedness. The study designs fall into one of the following broad categories: twin studies, adoption studies, and family studies.
Twin studies
The classical twin design compares the resemblance of MZ to DZ twins. MZ twins are considered genetically identical since they originate from the division of a single fertilized egg (one zygote), while DZ twins grow from two independent fertilization events and share only about one-half of their genes IBD. In this design, any difference in the resemblance between MZ and DZ twin pairs is ascribed to genetic factors, assuming that both types of twins are exposed to similar environmental conditions. This assumption is the most critical, is seldom met, and represents a major limitation of the twin method.
The analysis of twin data was traditionally based on analysis of variance (ANOVA). If genetic factors are involved in determining the phenotype under study, the within-pair variance will be lower for MZ twins than for DZ twins. The F ratio of the ANOVA was thus used to test for the presence of a genetic effect. Several methods have been proposed to estimate heritability from twin data, but the most widely used in the past was from twice the difference between the MZ and DZ intraclass correlations:
Nowadays, twin data are analyzed with more complex modeling and variance decomposition methods. The total phenotypic variance (VP) is decomposed into genetic (VG), shared environmental (VC), and unique environmental (VE) components, and the genetic heritability is defined as the proportion of total phenotypic variance explained by the genetic component (VG/VP). An example of a basic univariate path model to estimate the variance components is shown in Figure 1. The shared environmental component is assumed to affect phenotypic covariance similarly in both types of twins, whereas the effect of the genetic component on covariance is two times greater in MZ twins as compared to DZ pairs. Hypotheses about genetic and nongenetic effects can be tested using a number of structural equation modeling-based software packages that have been developed to deal specifically with twin data and continuous or discrete traits, e.g., LISREL (55) and MX (211).
Figure 1.
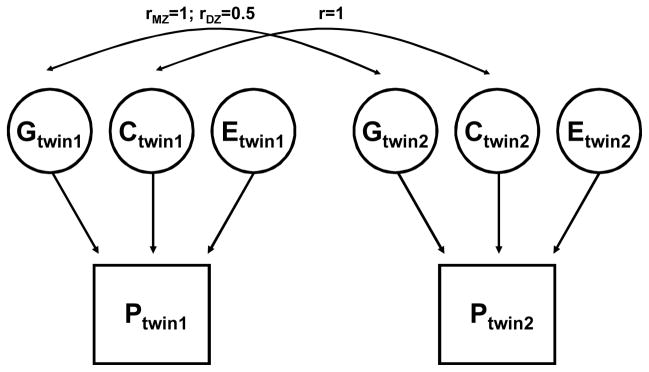
An example of a basic univariate genetic path model in monozygotic (MZ) and dizygotic (DZ) twins.
Several extensions of the classical twin method can be used to assess genetic and environmental sources of variation in a quantitative phenotype. One extension requires data on the spouses and offspring of adult twins, the so-called twin-family method. The twin-family method provides more information on environmental sources of variance and on the contribution of assortative mating to familial resemblance. Another useful strategy is to compare twins discordant for exposure to a factor in the environment. This is known as the co-twin control method. It is a useful design to control for host characteristics like age, sex, and genetic background. Of considerable interest for the study of physiological and metabolic phenotypes is the comparison of MZ twins discordant for a relevant trait. For instance, the design has been used for twins discordant for BMI to study a number of physiological, metabolic, and clinical traits (205, 238–242, 270, 271).
Although such pairs are rare, twins reared apart have also been used to assess the heritability of a trait. This design requires twins to have been separated shortly after birth and reared in different circumstances. Needless to say, these conditions are seldom met today. Few of the “reared apart” observational studies have been performed with traits of relevance to physiology, metabolism, or exercise.
MZ and DZ twin designs have been helpful in the effort to understand whether a trait exhibited a genetic component. However, there are several limitations inherent to the various twin designs. Twins share prenatal as well as postnatal environments to a unique extent, and they may not be representative of the population at large. The heritability coefficient is a ratio of variances and is, therefore, dependent on fluctuations in either the numerator or the denominator. If a given sample of twins is characterized by less heterogeneity than what is commonly observed in the population, the denominator may be artificially diminished, leading to an inflated heritability estimate. It is also plausible that twins, especially MZ pairs, may have a more similar epigenomic signature as a result of the shared intrauterine environmental conditions, resulting in a higher phenotypic resemblance over and above the genetic covariation.
Adoption studies
The study of adopted children and their foster and biological parents is a powerful design to assess genetic heritability as well as cultural transmission. The basic principle is that the resemblance between an adopted child and members of his/her biological family can be attributed largely to the genes they share in common, while the resemblance between an adopted child and his/her adoptive family is due primarily to shared environmental conditions (complete adoption design). If data on the biological parents of an adopted offspring are not available, the study is known as a partial adoption design. In the partial adoption design, the resemblance between foster parents and biological and adopted siblings living in the same family environment is compared. For example, the absence of a significant correlation between adoptive parents and their adopted children combined with a significant correlation between the same parents and their biological children would suggest that the trait is more influenced by genetic factors than by the family environment.
Adoption studies offer an attractive alternative to assess heritability, but they also have limitations. Age at adoption is always a critical issue: adoption should ideally have taken place shortly after birth. An assumption underlying the adoption design is that there should not be any selective placement of adoptees. The latter occurs when adoption agencies match adoptive parents and biological parents on a variety of characteristics (e.g., socioeconomic status, complexion). In addition, it is assumed that adoptive families represent an unbiased sample of the population. These three requirements are seldom met in adoption studies. This design has not been used to any extent for traits of interest to physiology and metabolism.
Family studies
Family studies, including nuclear families (parents and their offspring) and extended pedigrees (grandparents, parents, offspring, cousins, uncles/aunts, etc.), are the most widely used designs to investigate the genetic basis of quantitative phenotypes. One major advantage is that families are typically more representative of the general population than sets of relatives like twins or adoptees. However, it is important to realize that data on nuclear families alone do not allow for the precise quantification of the relative contribution of genetic and shared environmental components of a trait variance. They can be used to assess only overall “familiality”, i.e., the fraction of phenotypic variance attributable to the combined effects of all familial influences. This is often defined as the maximal heritability.
The estimation of heritability from nuclear family data is based on fitting various familial correlation models. In addition to a full model, which includes all available familial correlations, several reduced models are tested. The reduced models test specific null hypotheses by restricting some of the covariances (e.g., no sibling resemblance, no spouse resemblance, no sex differences in parents or offspring). The most parsimonious model (or a combination of models) is selected based on the Akaike’s Information Criterion (4) and the familial correlations (r) from this model are used to estimate the maximal heritability of the trait. A commonly used equation to calculate heritabilities (h2) in nuclear family data is:
In summary, even though we have a number of relevant study designs to undertake the delineation of the genetic and shared environmental components of a trait variance, none of these methods is completely satisfactory. They all require that several key assumptions be made and those are seldom met in practice. Despite their obvious limitations, they remain useful to address the central question: is there a significant component to the variance in a given trait? Moreover, it is always important to remember that these methods are used only for the relative quantification of the variance components from a population perspective. They should never be used to infer about the quantitative importance of the genetic component for a trait in a given individual. Of great importance also is the fact that estimates of heritability can vary among populations depending on genetic and environmental circumstances. Finally, at this time, we cannot define the exact role played by epigenetic signatures in the heritability estimates.
Overview of genetic epidemiology findings for relevant traits
What is the evidence for a genetic contribution to a number of morphological, physiological, and metabolic traits that are of importance to exercise biology? There are published human data for cardiorespiratory fitness and selected cardiovascular and skeletal muscle phenotypes, and they are briefly reviewed here.
Endurance performance phenotypes
Rodent models support the hypothesis that there is a significant genetic component to endurance performance. In one study, 6 untrained rats of each sex from 11 different inbred strains were tested for maximal running capacity on a treadmill (20). It was found that Copenhagen (COP) rats were the lowest performers while the DA rats were the best runners based on duration of the run, distance run, and vertical work performed. There was a 2.5-fold difference between the COP and DA strains. These observations are depicted in Figure 2 for male and female performance scores combined. The heritability of endurance performance was estimated at 50% in these untrained rodents. Subsequently, selective breeding for three successive generations mating lowest performing pairs versus highest performing pairs resulted in divergent lines for endurance performance; in a run test to exhaustion, the high-performance line averaged 659 m of running distance (SD=36 m) and the low-performance line 388 m (SD=28 m) (150). It was estimated that 39% of the variation in running performance between the high and low lines was determined by genetic differences.
Figure 2.
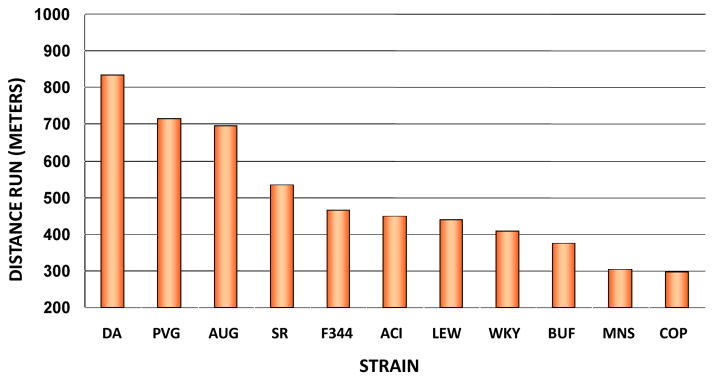
Comparison of distances run by the 11inbred strains of rats.
From Barbato JC et al. “Spectrum of aerobic endurance running performance in eleven inbred strains of rats.” J Appl Physiol, 1998, 85(2): 530–536. By permission of the American Physiological Society.
These results are concordant with those reported in mice by Meek et al. (193) and Kelly et al. (146). Mice bred for high voluntary wheel activity run about 3-fold more revolutions per day compared to unselected control lines. In contrast to the study paradigm of Britton and Koch, in which the selection of rats is based on an imposed endurance run, the mice selection in these studies pioneered by Garland and Pomp is dependent on voluntary wheel running.
Maximal oxygen uptake
The heritability of maximal oxygen uptake (VO2max) has been computed from family and twin studies. Table 2 summarizes intraclass correlations in DZ and MZ twins from several studies. These studies are quite heterogeneous, with differences in test protocol, number of twin pairs, age or sex distributions, and means or variances between twin types. The intraclass correlations for MZ twins ranged from about 0.6 to 0.9, whereas correlations for DZ twins with one exception ranged from 0.3 to 0.5. The largest of the twin studies (316) was derived from a population-based twin panel of conscripts. The data were based on predicted VO2max values, which were subsequently transformed to categorical scores, from low to high maximal aerobic power, but intraclass correlations for the categorical scores were similar to those found in other twin studies (316). Globally, these twin studies have yielded heritability estimates ranging from 25% to 65%, with some outliers.
Table 2.
Intraclass correlations from twin studies of maximal oxygen intake
| Source | N Pairs
|
Cohort | Test | MZ | DZ | |
|---|---|---|---|---|---|---|
| MZ | DZ | |||||
| Klissouras (1971) | 15 | 10 | Males | VO2max/kg | 0.91 | 0.44 |
| Klissouras et al (1973) | 23 | 16 | Males and females | VO2max/kg | 0.95 | 0.36 |
| Bouchard et al (1986a) | 53 | 33 | Males and females | VO2max/kg | 0.71 | 0.51 |
| Fagard et al (1991) | 29 | 19 | Males | VO2max/kg | 0.77 | 0.04 |
| Maes et al (1993) | 41 | 50 | Males and females | VO2max/kg | 0.85 | 0.56 |
| Sundet et al (1994) | 436 | 622 | Males | VO2max/kg PredictedA) |
0.62 | 0.29 |
| Maes et al (1996) | 43 | 61 | 10-year-old boys and girls | VO2maxB) | 0.75 | 0.32 |
Maximal aerobic power was predicted from a nomogram and the predicted VO2max was subsequently transformed to a categorical score from 1 to 9. The intraclass correlations are based upon the categorical scores.
VO2max not adjusted for body mass.
From (43) Bouchard C, et al. Genetic Determinants of Endurance Performance. In: Shephard RJ and Astrand P-O, editors. Endurance in Sport. pgs 223–42.(IOC), 2000.
VO2max in the sedentary subjects is characterized by a significant familial resemblance, as demonstrated by several studies (164, 173, 197). The most comprehensive of these is the HERITAGE Family Study in which two cycle ergometer VO2max tests were performed on separate days in parents and their adult offspring from sedentary families of Caucasian descent (33). An F ratio of 2.72 was found when comparing the between-family variance to the within-family variance for VO2max in the sedentary state adjusted for age, sex, body mass, and body composition (Figure 3). The concept of family lines with low and high VO2max phenotypes in the sedentary state is clearly demonstrated by the data shown in the figure. The intraclass coefficient for the familial resemblance was 0.41 (33). Maximum likelihood estimation of familial correlations (spouse, four parent-offspring, and three sibling correlations) revealed a maximal heritability of 51% for VO2max adjusted for age, sex, body mass, fat-free mass, and fat mass. However, the significant spouse correlation suggested that the genetic heritability was lower and was estimated to be at about 47% (33).
Figure 3.

Family lines with low and high VO2max phenotypes in the sedentary state based on data from the HERITAGE Family Study.
From Bouchard C, Daw EW, Rice T, Perusse L, Gagnon J, Province MA, Leon AS, Rao DC, Skinner JS, Wilmore JH. “Familial resemblance for VO2max in the sedentary state: the HERITAGE family study.” Med Sci Sports Exerc 1998; 30(2), 252–258. Reproduced with permission from Wolters Kluwer Health.
Interestingly, VO2max adjusted for body mass differed markedly among lines selectively bred for high voluntary wheel running and unselected control mice. For instance, after generation 36 of selective breeding, the high-wheel-running mice achieved a VO2max 24% higher than control mice under normoxic conditions (261, 262). Comparable differences were also observed under hypoxic and hyperoxic conditions.
Submaximal exercise capacity
In 1630 subjects from 375 families of the Quebec Family Study (QFS), submaximal exercise capacity was measured on a cycle ergometer as the power output at a heart rate (HR) of 150 beats per minute (bpm) and expressed per kilogram of body weight (PWC150/kg) (37). The same trait was obtained in the Canada Fitness Survey (CFS) in which PWC150/kg was estimated from a progressive step test in more than 15,000 subjects from thousands of households representing the Canadian population. In both studies, it was found that submaximal exercise capacity was characterized by significant familial resemblance (37, 232, 233). However, this familial resemblance was apparent not only among biological relatives, but also among spouses and relatives by adoption, suggesting the contribution of both genetic and common familial environments. The estimates of heritability for submaximal exercise capacity were quite similar in both populations, with values of 22% in QFS (233) and 28% in CFS (232). These observations were concordant with the estimates of familial risk ratios in the CFS sample, in which the ratio for high values (exceeding the 95th percentile of the distribution) of PWC150 reached 1.63 and 1.81 for spouses and first-degree relatives, respectively (140).
Familial aggregation for several indicators of submaximal exercise capacity was also investigated in the HERITAGE Family Study (33, 90, 230). Phenotypes included VO2 at an absolute power output of 50 watts (VO250W), VO2 at relative power outputs equivalent to 60% and 80% of subjects’ VO2max, and also VO2 at the ventilatory threshold (VO2vt). The heritability estimates ranged between 29% and 70% for submaximal aerobic performance and reached 58% for VO2vt.
Cardiac performance phenotypes
The ability to deliver oxygen to the active tissues is thought to be a major determinant of endurance performance. For instance, when comparing 11 inbred strains of rats, the highest performing DA line had also the highest cardiac output (Q) while the COP rats that ran for the shortest distance had the lowest Q per minute. The correlation between average distance run and Q per minute among the 11 strains reached 0.868, corresponding to a common variance of about 75% (20). Even though selection for high or low endurance performance was primarily associated with a greater oxygen uptake and utilization by skeletal muscle in the high-endurance line in the early generations (119), which correlated with skeletal muscle capillarity and enzyme activities at markers of oxidative metabolism (127), the capacity to deliver oxygen to the exercising muscle became progressively more important. Thus, at generation 15, the high-endurance line exhibited a VO2max normalized for body weight 50% higher than the low-performance line (98). This higher VO2max in the high-performer line was accompanied by a 41% higher Q per minute and a 48% higher stroke volume (SV) under normoxic conditions than the low-performing animals. In humans, endurance performance defined as total work output over 90 minutes of exercise correlates only weakly with VO2max (174, 357), suggesting that peripheral adaptations are very important.
Larger SV and Q are commonly associated with larger heart volume and left ventricular (LV) mass. A few studies performed in humans have investigated the question of a genetic component to LV structure adjusted for body mass. In one experiment, 32 MZ and 21 DZ pairs of healthy males were studied for echographic heart dimensions (24). The phenotypic variance was partitioned into genetic, shared, and non-shared environmental components using a defined path analysis model with data adjusted for age and body mass. All heart structures, except LV internal diameter, were significantly influenced by genetic factors, with heritability estimates ranging from 29% to 68%. The strong correlation between body size and heart size suggests that some of the covariation between these two variables could be accounted for by common genetic factors. This issue was addressed in a bivariate genetic analysis of LV mass and body mass using a larger sample of 147 MZ and 107 DZ twin pairs of both sexes (349). The heritability of adjusted LV mass reached 39% in males and 59% in females, figures that are quite concordant with the findings of Bielen and collaborators. Bivariate genetic analyses showed that the correlation between LV mass and body mass was almost entirely of genetic origin, 90% being attributed to common genes (349). These studies suggest that genetic factors are important in determining cardiac dimensions under resting conditions. In a study of 21 MZ and 12 DZ twin pairs, the inheritance of cardiac changes during submaximal supine cycle exercise at a fixed HR of 110 bpm was considered (25). The increases in LV internal diameter and fractional shortening in response to exercise were characterized by significant genetic effects of 24% and 47%, respectively.
In the HERITAGE Family Study, subjects completed two submaximal exercise tests at 50 W and at 60% of the untrained VO2max both prior to and after completing a 20-week endurance training protocol. Steady-state SV and Q were measured twice during each test. Submaximal exercise SV and Q per minute were characterized by a significant familial aggregation in the sedentary state. Maximal heritabilities reached 40% and 42% for SV and Q at 50 W and were 46% for both phenotypes at 60% VO2max (10).
Steady-state HR during submaximal exercise at a workload of 50 W (HR50) also was measured using an electrocardiograph twice before and twice after a 20-week endurance training protocol in HERITAGE. The reproducibility of the HR50 measurements was high, with baseline and post-training coefficient of variation (CV) of 4.6% and 4.6% and intraclass correlation (ICC) coefficients for repeated measures of 0.91 and 0.89, respectively. The average reduction in HR50 was 12 bpm (8.9%), with a standard deviation of 10.1 (p<0.0001). There were marked interindividual differences in the ΔHR50, ranging from a reduction of 44 bpm to an increase of 13 bpm. The strongest predictors of ΔHR50 were baseline HR50 (R2=33%) and familial aggregation (h2=34%) (9). Furthermore, complex segregation analysis supported the hypothesis of a major dominant gene effect on ΔHR50 in the same set of families (8). These observations support the hypothesis that genetic factors are involved in ΔHR50 regulation.
A similar picture emerged for the changes in exercise blood pressure in response to exercise training. Steady-state systolic and diastolic blood pressure (SBP, DBP) during submaximal exercise at a workload of 50 W (SBP50 and DBP50) was measured twice (on different days) before and twice (on different days) after completing 20 weeks of endurance training using an automatic device (Colin STBP-780). Pulse pressure (PP) was calculated as a difference between SBP and DBP (PP50=SBP50–DBP50). The average training-induced reductions in SBP50 and PP50 were 7.0 mm Hg SD=11.4 mm Hg) and 4.5 mm Hg (SD=11.6 mm Hg), respectively. Both ΔSBP50 and ΔPP50 showed large interindividual differences, with the changes ranging from decreases of as much as 40 to 45 mmHg to increases of the order of 10 to 15 mmHg. The strongest predictors of the training responses were baseline phenotype level (R2=30%) and familial aggregation (h2= 22%) (9).
In the aggregate, these studies indicate that there is a significant genetic component to the interindividual differences in cardiac dimensions, resting and exercise SV, and Q per minute in the untrained state. A significant genetic effect is also observed in HR, blood pressure, SV, and Q changes during submaximal exercise intensities in response to exercise training.
Skeletal muscle phenotypes
There is compelling evidence to the effect that there is a significant genetic component to human variation in skeletal muscle strength and endurance [see reviews by (22, 23, 38, 229)]. In the CFS, muscular performance was measured in a sample of 13,804 subjects as follows: muscular endurance was assessed by measuring the maximum number of sit-ups performed in 60 s and the number of push-ups completed without time limit, while muscular strength was assessed by measuring handgrip strength. Perusse and colleagues reported heritability estimates of 37% for sit-ups, 44% for push-ups, and 37% for grip strength (232). In the same population, the familial risk ratios for first-degree relatives of individuals exceeding the 95th percentile of the distribution were 3.98 for muscular endurance and 3.16 for muscular strength, while the corresponding values for spouses were 2.63 and 2.38 (140). The higher risk ratios for first-degree relatives compared to spouses suggest strong contributions of genetic factors. Moreover, 7-year changes in these muscular fitness phenotypes were also investigated using data from the 1981 CFS and a follow-up examination of the same individuals conducted in 1988 (139). It was found that 54% to 63% of the variance in the 7-year changes in muscular strength and endurance could be accounted for by family lines. The heritability levels for the 7-year changes reached 41% for sit-ups, 52% for push-ups, and 32% for grip strength (139).
The familial aggregation of muscular endurance and muscular strength was also investigated in the QFS, with heritability estimates of 21% for muscular endurance and 30% for muscular strength (232, 233). In a sample of 748 young male siblings from 335 Belgian families, the genetic and shared environmental variance accounted for 63% to 87% of the variance in concentric strength measures of knee, trunk, and elbow, while it reached as high as 82% to 96% for isometric strength measures (129). Elbow flexion, hand grip, and knee extension strength tests were performed in a large sample of siblings (154,970 sibling pairs), DZ twins (1,864 pairs), and MZ twins (1,582 pairs), and the study revealed that more than 50% of the variability in strength performance could be accounted for by additive genetic factors (292).
In large samples of adults, skeletal muscle fiber type distribution is a significant determinant of endurance performance. Human variation in the proportion of a given fiber type is strikingly large, even among sedentary individuals, as illustrated in Figure 4. Tissue sampling variation and laboratory error variance are critical issues to consider when quantifying the importance of genetic differences using human muscle biopsy material. For instance, repeated biopsies from the vastus lateralis muscle in sedentary adults indicate that sampling variability and technical error together account for about 15% of the variance in the proportion of type I muscle fibers (293, 295). Differences between brothers or sisters of MZ pairs in the percentage of type I fibers provide critical information on the magnitude of the contribution of nongenetic factors. In one such study, the mean difference in percentage of type I fibers between a member of a MZ pair and his/her co-twin reached 9.5 ± 6.9% in 40 pairs of MZ twins (293). The difference was less than 6% in 16 pairs but ranged from 18% to 23% in 8 other pairs. It is remarkable that about 25% of sedentary adult Caucasians exhibit quite low (35% or less) or quite high (65% or more) proportions of skeletal muscle type I fibers in the vastus lateralis, which remains the most studied skeletal muscle in humans. Genetic variation has undoubtedly something to do with this extensive human heterogeneity, but it is likely not the only cause.
Figure 4.
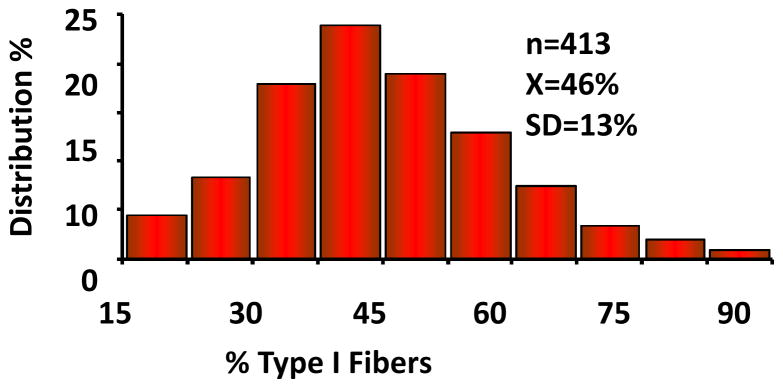
Human variation in vastus lateralis percent type I fibers among sedentary adults.
Adapted from Simoneau JA and Bouchard C, “Human variation in skeletal muscle fiber type proportion and enzyme activities.” 1989, Am J Physiol, 257: E567–572. By permission of the American Physiological Society.
These results combined with those on pairs of DZ twins and regular brothers (36, 295) have led to the conclusion that a genetic component accounts for about 45% of variance in the proportion of type I muscle fibers in humans (293). A summary of genetic, environmental, and methodological sources of variation in the proportion of type I fibers in human skeletal muscle is illustrated in Figure 5. Fiber type distributions were also examined in 78 sedentary subjects from 19 families of the HERITAGE Family Study (265). The results suggested an even weaker genetic component than observed in prior twin-based studies. For instance, no evidence was found for a genetic contribution to the proportion of the various fiber types, although a trend was observed for the proportion of type I fibers. However, significant familial aggregation was found in the same study for the number of capillaries around fiber types I and IIA. To-date, the central question is not satisfactorily answered: what are the factors driving the wide range of fiber type distributions among adults, and what is the contribution of genetic and epigenetic differences?
Figure 5.
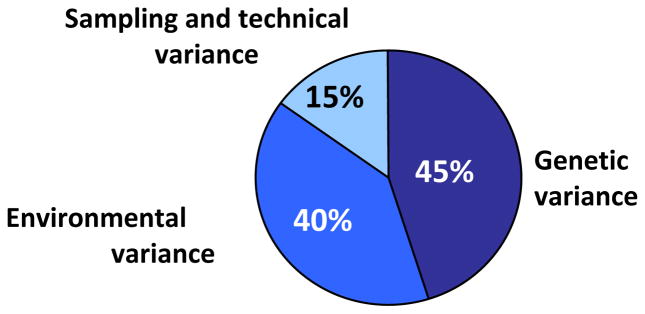
Estimates of sources of causal variation in proportion of type I fibers in human skeletal muscle among sedentary people.
Reproduced, by permission, from J.A. Simoneau and C. Bouchard, 1995, “Genetic determinism of fiber type proportion in human skeletal muscle,” FASEB J, 9(11): 1091–1095.
There are considerable interindividual differences in the enzymatic activity profile as assayed in skeletal muscle homogenates. One can distinguish individuals with high or low activity levels of enzymes associated with the catabolism of different substrates in the skeletal muscle among healthy sedentary or moderately active individuals of both sexes (294). Even though several factors can potentially contribute to these interindividual differences, it is likely that the genotype plays a role in determining gene transcription and mRNA translation influencing the amount of protein for several key skeletal muscle enzymes.
Studies of MZ (n=35) and DZ (n=26) twin pairs of both sexes and pairs of biological brothers (n=32) suggested that there was a significant genetic effect for variation in skeletal muscle enzyme maximal activities (42). There was significant within-pair resemblance in MZ twins for all skeletal muscle enzyme activities (r=0.30 to 0.68), but the correlation patterns for DZ twins and brothers were more supportive of a weaker genetic component. After adjusting for variation in age and sex, genetic factors were responsible for about 25% to 50% of the total phenotypic variation in the activities of the regulatory enzymes of the glycolytic (phosphofructokinase, PFK) and citric acid cycle (oxoglutarate dehydrogenase, OGDH) pathways and in the ratio of glycolytic to oxidative activities (PFK/OGDH ratio) (42). Results from the HERITAGE Family Study based on biopsies of the vastus lateralis muscle as defined above confirmed that there was significant familial aggregation for activities of enzymes of the glycolytic and oxidative pathways (256, 265).
Responsiveness to exercise training
The concept of heterogeneity in the response to standardized exercise programs was first introduced in the early 1980s (30). In a series of carefully controlled and standardized exercise training studies conducted with young and healthy adult volunteers, it was shown that individual differences in training-induced changes in several physical performance and health-related fitness phenotypes were large, with the range between low and high responders reaching several folds (30, 31, 34, 36, 174). This phenomenon was subsequently confirmed in other laboratories.
Later, the most extensive data on human variation in trainability came from the HERITAGE Family Study, in which healthy but sedentary subjects followed a highly standardized, well-controlled, laboratory-based endurance-training program for 20 weeks. The average increase in VO2max was 384 mL of oxygen, with a standard deviation of 202. The training responses varied from no change to increases of more than 1,000 mL of oxygen per minute (32, 40). The distribution of VO2max response adjusted for age, sex, and baseline VO2max is depicted in Figure 6. This high degree of heterogeneity in responsiveness to a fully standardized exercise program in the HERITAGE Family Study was not accounted for by baseline level, age, gender, or ethnic differences. These data underline the notion that the effects of endurance training on cardiovascular and other relevant traits should be evaluated not only in terms of mean changes, but also in terms of response heterogeneity.
Figure 6.

Distribution of training responses in VO2max in individuals of the HERITAGE Family Study.
From Bouchard C and Rankinen T. “Individual differences in response to regular physical activity.” 2001 Med Sci Sports Exerc 33(6 Suppl), S446-S451. Reproduced with permission from Wolters Kluwer Health.
A similar picture emerged for training-induced changes in SV, Q, and skeletal muscle traits. For instance, in the HERITAGE Family Study, at the same absolute power output (50 W), HR and Q decreased significantly (9.5% and 5%, respectively), whereas SV increased by 4% after 20 weeks of endurance training. At 60% VO2max, HR decreased 3.1%, while Q and SV increased 7.3% and 10.8%, respectively (370, 371). There were marked interindividual differences in all these training-induced changes, as revealed by the magnitude of the standard deviations for the training-induced changes and as illustrated in Figure 7.
Figure 7.

The individual changes in heart rate and stroke volume at 50 watts and at 60% of VO2max on cycle ergometer tests before and after 20 weeks of exercise training. These subjects were Blacks and Whites of the HERITAGE Family Study.
From (39) Bouchard C, Rankinen T. Genetic Determinants of Physical Performance. In: RJ Maughan, editor. Olympic Textbook Science in Sport. Wiley-Blackwell, Hoboken, NJ; chapter 12, p 181–201, 2009. Reproduced with permission from Wiley-Blackwell.
A similar pattern of variation in training responses was observed for other phenotypes, including insulin and plasma lipid levels, submaximal exercise HR, and blood pressure (44, 163, 371). For example, SBP and DBP measured during steady-state submaximal (50 W) exercise decreased, on average, by 7 and 3.5 mmHg, respectively, in response to exercise training (371). However, the responses varied from marked decreases (SBP>25 mmHg and DBP>12 mmHg) to no changes or, in some cases, even to slight increases (40, 371). Similar heterogeneity in responsiveness to exercise training has been reported also in other populations (116, 151). Notably, wide variation in skeletal muscle metabolic response (as defined by intramuscular ΔPCr) is observed following supervised exercise training, and such variation occurs in a manner unrelated to the gains in VO2max (357).
Two questions come to mind as a result of the observations such as those depicted in Figures 6 and 7. Are the high and low responses to regular exercise characterized by significant familial aggregation, i.e., are there families with mainly low responders and others in which all family members show significant improvements? Is individual variability a normal biological phenomenon reflecting genetic diversity?
Of relevance to the first question are the early studies that we undertook with MZ twins. The VO2max response to standardized training programs showed six to nine times more variance between genotypes (between pairs of twins) than within genotypes (within pairs of twins) based on the findings of three independent studies (34, 110, 246). Thus, gains in absolute VO2max were much more heterogeneous between pairs of twins than within pairs of twins. The results of one such study are summarized in Figure 8. The MZ twins exercised for 20 weeks using a standardized and demanding endurance training program (34, 246).
Figure 8.

Training changes in VO2max among 10 pairs of MZ twins subjected to a standardized 20-week exercise training program.
Adapted from D. Prud’homme et al, 1984, “Sensitivity of maximal aerobic power to training is genotype dependent,” Medicine and Science in Sports and Exercise, 16: 489–493. Reproduced from Bouchard C, Dionne FT, Simoneau JA, Boulay MR. 1992, “Genetics of aerobic and anaerobic performances” Exercise and Sport Sciences Reviews 20:27–58 by permission from Wolters Kluwer Health.
These observations were corroborated by the results of the HERITAGE Family Study. The increase in VO2max in 481 individuals from 99 two-generation families of Whites showed 2.6 times more variance between families than within families, and the model-fitting analytical procedure yielded a maximal heritability estimate of 47% (32). Thus the extraordinary heterogeneity observed for the gains in VO2max among adults is not random and is characterized by a strong familial aggregation (Figure 9). These observations support the notion that individual variability is a normal biological phenomenon, which may largely reflect genetic diversity (31, 40).
Figure 9.

Familial aggregation of VO2max changes in response to exercise training in the sample of Whites of the HERITAGE Family Study.
From Bouchard C, An P, Rice T, Skinner JS, Wilmore JH, Gagnon J, Perusse L, Leon AS, Rao DC. “Familial aggregation of VO2max response to exercise training: results from the HERITAGE Family Study.” 1999 J Appl Physiol 87: 1003–1008. By permission of the American Physiological Society.
In addition to VO2max, the heritability of training-induced changes in several other phenotypes, such as submaximal aerobic performance, resting and submaximal exercise blood pressure, HR, SV, and Q, as well as skeletal muscle characteristics, have all been investigated in the HERITAGE Family Study. Submaximal exercise SV and Q were characterized by a significant familial aggregation in response to endurance training. The between-family variation in age, sex, body surface area, and baseline phenotype level-adjusted SV and Q training responses at 50 W were 1.5 to 2.2 times greater than the within-family variation. The maximal heritability estimates were 29% and 38% for SV and Q training responses at 50 W and 24% and 30% for the training-induced changes in SV and Q at 60% of VO2max (10).
Two experimental studies of the responses of young adult MZ twins to relevant training programs provide some insights into potential genotypic contributions to the skeletal muscle training response. The studies included male and female MZ twins, and there were no sex differences in training-related gains. The effects of high-intensity, intermittent training are summarized in Table 3. The training program involved 15 weeks of both continuous and interval cycle ergometer work in 12 pairs of MZ twins of both sexes. Program-related changes in fiber type proportions showed no significant within-pair resemblance. However, about 50% to 60% of the response of hexokinase (HK), lactate dehydrogenase (LDH), malate dehydrogenase (MDH), OGDH, and the PFK/OGDH ratio to the intermittent training program was genotype-associated, while about 80% of the creatine kinase (CK) training response appeared to be determined by the genotype (36) as inferred from the within-pair resemblance in response levels.
Table 3.
Effects of training and genotype-training interactions in the response to high-intensity intermittent training for muscle fiber types and enzyme activities
| Enzyme | Before training mean ± SD | After training mean ± SD | Genotype-training interaction F ratio | Intrapair resemblance in response |
|---|---|---|---|---|
| CK | 237.0 ± 48 | 278.0 ± 98 | 9.8** | 0.82 |
| HK | 1.3 ± 0.4 | 1.41 ± 0.36 | 3.8* | 0.59 |
| PFK | 152.0 ± 27 | 155.0 ± 52 | 2.2 | 0.38 |
| LDH | 239.0 ± 122 | 201.0 ± 93 | 4.6** | 0.64 |
| MDH | 220.0 ± 56 | 246.0 ± 44* | 3.0* | 0.50 |
| HADH | 3.7 ± 1.2 | 5.03 ± 1.55** | 1.3 | 0.15 |
| OGDH | 0.7 ± 0.2 | 1.04 ± 0.23** | 3.0* | 0.50 |
| PFK/OGDH ratio | 558.0 ± 173 | 231.0 ± 109 | 4.5** | 0.64 |
All enzymes were expressed in μmol of NADH or NADPH per gram of wet weight per minute.
n=12 pairs of MZ twins. HADH=3-hydroxyacyl CoA dehydrogenase, CK=creatine kinase, HK=hexokinase, LDH=lactate dehydrogenase, MDH=malate dehydrogenase, OGDH=oxoglutarate dehydrogenase, PFK=phosphofructokinase.
p < 0.05
p < 0.01
From Simoneau, J.A. et al. (1986) Inheritance of human skeletal muscle and anaerobic capacity adaptation to high-intensity intermittent training. International Journal of Sports Medicine 7, 167–171. Reproduced with permission from Thieme.
The second study followed six pairs of young adult MZ twins (three male and three female) through 15 weeks of endurance training on a cycle ergometer (110). Genotype-training interactions were evaluated for the proportion of muscle fibers and several enzymes after 7 and 15 weeks of training. There were no significant changes in the proportions of type I and type IIA and IIB fibers. Changes in skeletal muscle enzyme activities during the first half of training were characterized by weak within-pair resemblance. However, changes in the activities of PFK, MDH, 3-hydroxyacyl CoA dehydrogenase (HADH), and OGDH across the whole 15 weeks were characterized by much more significant within-pair resemblance. This suggests that early in the program, adaptation to endurance training may be under less stringent genetic control; however, as training continues and as one gets closer to the maximal trainability zone, the response becomes more genotype dependent. Taken together, these two studies provide strong support for the notion that genetic variation accounts for some of the heterogeneity in skeletal muscle metabolic responses to exercise-training.
Training-induced changes in muscle enzyme activities were also investigated in the HERITAGE Family Study (256, 265). Results confirmed that there was consistent familial resemblance for the training responses in activities of marker enzymes of the glycolytic and oxidative pathways (Table 4). In contrast, no evidence for familial aggregation was found for the changes in capillary density, even though capillarity increased around all fiber types in response to 20 weeks of endurance training. The issue of microvascular adaptation to regular exercise and the role played by genetic and epigenetic factors deserve further investigation.
Table 4.
Familial aggregation of maximal enzyme activities in the vastus lateralis muscle in a subset of families of Caucasian descent of the HERITAGE Family Study*
| Phenotype | Pretraining
|
Training Response
|
||||
|---|---|---|---|---|---|---|
| N | F | p | N | F | p | |
| PCr Metabolism | ||||||
| CK | 78 | 6.25 | <0.0001 | 76 | 3.97 | <0.0001 |
| Glycolysis | ||||||
| PHOS | 78 | 6.85 | <0.0001 | 75 | 2.14 | 0.0169 |
| HK | 78 | 1.69 | 0.069 | 75 | 4.01 | <0.0001 |
| PFK | 78 | 3.83 | <0.0001 | 76 | 1.85 | 0.043 |
| GAPDH | 78 | 5.62 | <0.0001 | 76 | 2.39 | 0.0072 |
| Oxidative metabolism | ||||||
| CPT | 78 | 2.55 | 0.0039 | 75 | 2.47 | 0.0058 |
| HADH | 78 | 3.80 | <0.0001 | 76 | 2.13 | 0.017 |
| CS | 78 | 1.66 | 0.076 | 76 | 2.73 | 0.0023 |
| COX | 78 | 3.03 | 0.0008 | 76 | 2.07 | 0.0213 |
From 19 families encompassing 78 subjects, all Caucasians.
From Rico-Sanz J, Rankinen T, Joanisse DR, Leon AS, Skinner JS, Wilmore JH, Rao DC and Bouchard C. Familial resemblance for muscle phenotypes in the HERITAGE Family Study. Med Sci Sports Exerc 35(8): 1360–1366, 2003, and Corrigendum – Rankinen T, Bouchard C, and Rao DC. Familial Resemblance for Muscle Phenotypes: The HERITAGE Family Study. Med Sci Sports Exerc 37(11): 2017, 2005. Reproduced with permission from Wolters Kluwer Health.
The human heterogeneity described in this section is an example of normal biological diversity. It is observed in all populations that have been studied thus far. This degree of heterogeneity in the ability to adapt to regular exercise is well beyond measurement error and day-to-day fluctuation and is potentially very informative in terms of the adaptive physiological and metabolic mechanisms involved.
Identifying genes, sequence variants, and other genomic markers
The identification of genes and sequence variants influencing human variation in a complex, multifactorial trait relies on several complementary and constantly changing technologies. A thorough review of this field would require a lengthy chapter and is well beyond the scope of this section. Rather, we plan here to provide a succinct overview of the main approaches that can be used to define the genetic anatomy of exercise traits.
Candidate genes
In the search for a relevant gene, scientists often pursue so-called “candidate genes”. A candidate gene is one that has, on theoretical ground or based on some data, a relationship with the physiological and metabolic systems of relevance to the trait of interest. Candidate genes are often defined on the basis of animal models. For instance, the ob mouse, whose genetic deficiency was shown to be in a gene that became known as the leptin gene (382), was at the origin of a large number of studies performed on LEP in human populations. Transgenic (TG), knockdown, and knockout (KO) mice have likewise generated many candidate genes that were subsequently investigated for their potential involvement in human variation for given phenotypes.
The expression level of a gene or noncoding transcript can also serve as a candidate phenotype against which DNA variants can be tested for associations. As a matter of fact, the complete transcriptome, which is, simply put, the full set of RNA transcripts in a given cell or tissue, is used to define new panels of candidate genes for further genomic studies [e.g., (99, 328)]. The approach can be extended to the proteome, i.e., the complete set of proteins and their amounts in a cell or tissue.
Candidate gene studies have been very prominent in the early research phase of exercise genomics and genetics. Many of them were quite simple in design and were launched primarily because whole blood had been stored in freezers. Human study designs are quite straightforward, being typically case-control or cross-sectional cohort studies with unrelated subjects. In the case-control design, testing for a relation between a trait and a gene marker is based on the comparison of allele and genotype frequencies between two informative groups of subjects, one having the phenotype of interest (e.g., elite endurance athletes—the “cases”), the other not having the phenotype of interest (the “controls”). On the other hand, for continuous traits, the association is tested by comparing mean trait values across genotype groups or between carriers and noncarriers of a specific allele, as defined by a single-nucleotide polymorphism (SNP), an insertion (I)/deletion (D) polymorphism, or other types of genomic markers.
Most of the candidate gene studies reported thus far in exercise biology are plagued by their small sample sizes and lack of appropriate statistical power (45, 258). Studies with small sample sizes get lucky occasionally, especially if they include several traits and perform multiple statistical tests for association. Fortunately, their positive findings seldom get replicated, and they are soon forgotten. Another concern involves the inclusion and exclusion criteria for membership in a cohort or case and control groups. Many of the early studies were designed to fail in this regard, for instance by comparing VO2max values among three genotypes at a given locus with subjects who varied in their level of exercise participation.
One potential issue in studies with unrelated subjects that has received a lot of attention is an increased risk of false-positive findings due to population stratification. Population stratification can be defined as the presence of distinct subpopulations within a study cohort. The basic rationale is that if these subpopulations differ from each other in terms of both allele frequencies and trait values, a statistically significant association between a genetic marker and a trait may occur even if such an association does not exist. Stratification is truly an issue when a cohort combines individuals from different ethnic groups, but it is less clear when a sample is from a single ethnic group. A number of statistical procedures have been developed to test for the presence of population stratification in cohort studies.
Family-based association tests avoid the potential bias arising from the presence of population stratification. The transmission of a given allele to children with a specific trait (e.g., high BMI, low muscle mass) more often than would be expected by chance alone suggests that this particular allele is potentially contributing to the trait. Statistical models have been developed to test for the preferential transmission of alleles to informative individuals; these tests are known as transmission disequilibrium tests (TDT) (303). TDT models are not affected by population stratification, as they depend on the randomness of allele transmission within families. The original TDT models were developed to use so-called “trios” (mother, father, and informative offspring). The TDT models were later extended to families with multiple offspring and to quantitative traits (1, 249).
Linkage studies and quantitative trait loci
Genes influencing complex, multifactorial traits are referred to as quantitative trait loci (QTLs). In animal models and in human studies, QTLs are defined as positions on chromosomes and are the products of positional cloning efforts. In rodent models, QTLs are typically identified on the basis of crosses between informative strains, with the goal of discovering a clear co-segregation of the smallest possible chromosome segment with the trait of interest. This approach works best for loci with substantial effect sizes.
In humans, positional association studies between genetic markers and a trait are based on linkage analysis across generations. The statistical linkage test is performed using a regression-based method or variance components modeling. Briefly, in the regression method, the phenotypic resemblance of siblings is modeled as the mean-corrected cross-product of the siblings’ trait values (224). In the variance components linkage method, the trait variance is decomposed into additive effects of a trait locus, a residual familial background, and a residual nonfamilial component (6, 245). The phenotypic covariance of the sibling pairs is modeled as a function of allele sharing or IBD. The linkage testing is performed using the likelihood ratio test contrasting a null hypothesis model of no linkage with an alternative hypothesis model in which the variance due to the trait locus is estimated. Although the approach has had some success with disease traits, the application to complex, multifactorial phenotypes has been more laborious. One of the reasons seems to be that QTLs for such traits have generally small effect sizes, and linkage analysis does not seem to have sufficient sensitivity to detect them. Unfortunately, exercise biology traits fall generally into this category.
A difference between linkage and association studies is that association targets alleles or genotypes at a specific gene or genetic marker, whereas linkage aims to identify a specific general chromosomal region. Thus, linkage analysis is used to identify chromosomal regions that harbor gene(s) affecting quantitative traits (hence QTLs), even if there is no a priori knowledge of the gene(s). Linkage studies require family or pedigree data; the basic observation unit is a pair of relatives (usually siblings), not an individual subject.
The identification of a QTL is always a major undertaking, but it is only a first step in the effort to associate allelic variation with a trait variance. A typical QTL may span several millions of DNA base pairs and may encode a large number of transcripts or genes. Progressing from the QTL to the causal sequence and alleles requires positional cloning. The goal is to reduce the size of the targeted region to the smallest possible stretch of DNA. This is usually done using more dense set of markers and ultimately DNA sequencing in informative subjects. Even if the genomic markers used in fine mapping do not include the specific DNA sequence variant(s) affecting the trait, they can provide useful leads as they may co-segregate with the true variant influencing the trait. This is called allelic association or linkage disequilibrium. Once the results are deemed strong enough, the final step is to sequence the candidate gene and flanking regions for DNA variants. The confirmation of the relevance of detected mutations generally includes replication association studies in samples from the same population and in other populations.
When a solid target has been uncovered and replicated, further validation is necessary using combinations of in vitro functional assays (expression studies in various cell lines) and in vivo in humans, which are commonly complemented by rodent experiments (TG studies). The linkage and positional cloning approach has been used successfully to identify genes causing diseases such as long QT syndrome 1 (364) and autosomal dominant familial polymorphic ventricular tachycardia (158, 317). Both traits are characterized by increased incidence of cardiac events during exercise. The positional cloning efforts of the response to exercise QTLs in the HERITAGE Family Study have yielded a number of strong candidates for the changes in submaximal exercise capacity with regular exercise (CREB1) and in SV and Q (KIF5B) (16, 253).
Genome-wide association studies
Even though genome-wide linkage analyses were productive lines of research as evidenced by a meta-analysis of more than 300 publications pertaining to 11 common chronic diseases (170), technological and analytical advances have made them almost obsolete in the search for genes contributing to complex traits. The introduction of microarray-based, high-throughput SNP-genotyping methods has drastically increased the ability to capture the existing variation in the genome of thousands of individuals at a reasonable cost. There are about 10 million SNPs with a minor allele frequency of 5% or more in the human genome. Subsets of common variants are linked together (i.e., there is no or infrequent recombination among them) and transmitted across generations as a unit or a block. SNPs in a block are correlated, often highly correlated. In the latter case, it becomes possible to tag a set of SNPs by genotyping only the most representative SNP, the so-called tagSNP. From a practical point of view, genotyping 500,000 to 1 million SNPs has been seen as sufficient to capture most of the common SNPs of the human genome. However, important differences have been observed among the major ethnic groups for allele frequencies and linkage disequilibrium patterns.
In brief, the recent ability to assay hundreds of thousands of DNA sequence variants in a single experiment has made genome-wide association studies (GWASs) a reality, and the first study based on this technology was published in 2005 (147).
Of considerable interest to exercise biology scientists was the early series of GWA reports focusing on type 2 diabetes (279, 286, 299, 309, 380). The field has moved ahead at a very rapid pace since 2005. We now have more than 600 published GWASs covering 150 diseases and complex traits. About 800 SNPs have been associated with a trait at the genome-wide significance level (P<5×10⁻⁸) (180). The catalog of these studies and their findings can be accessed at http://www.genome.gov/gwastudies.
After a while, it became evident that panels of SNPs and GWASs were not covering well a major fraction of human genomic polymorphisms, which are commonly referred to as copy number variants or CNVs. The full significance of CNVs for complex traits continues to be a topic of research and debate. There are reasons to believe that CNVs may be important as some of them are transcribed, resulting in multiple copies of given RNA sequences. However, it is early in the scientific exploration of this issue. One major report published in 2010 genotyped 3432 CNVs in 3000 controls and 2000 cases each of eight common diseases (bipolar disorder, breast cancer, coronary heart disease, Crohn’s disease, hypertension, rheumatoid arthritis, type 1 diabetes, and type 2 diabetes). Three CNVs were associated with diseases, but they had been identified before in SNP-based studies. The main conclusion of this study performed by the Wellcome Trust Case Control Consortium was that the common CNVs typed on these patients are unlikely to contribute greatly to the genetic basis of common diseases (66). It is still early in this journey, and a more definitive assessment of the true value of CNV genotyping, especially for physiological and metabolic traits, will have to await the findings of additional research.
Thus, GWASs have become an essential tool in the effort to identify genetic loci and SNPs contributing to human variation in complex biological and behavioral traits. The main challenge arising from GWAS findings is to go beyond a significant SNP to the true causal mutation and the gene or transcript involved. Indeed, few of the significant SNPs uncovered and replicated to date have been resolved at the gene or transcript level. Exercise biologists are just beginning to take advantage of this new technology, but we are likely to see a growing incorporation of GWASs in exercise genomics. However, it should be appreciated that a GWAS remains a major intellectual and financial undertaking.
DNA sequencing
The ultimate goal of genomic and genetic research is to identify specific DNA differences causing diseases, predisposing to diseases, associating with high or low values of a trait, or predicting the ability to adapt to lifestyle or environmental changes. Most of these DNA variants are likely to be single-nucleotide changes, but there will be more complex DNA alterations, as well. Here we briefly review the nature of the DNA changes that we are looking for in the genome, with a comment on future approaches and the technologies that will support them.
DNA sequence differences may vary from a substitution of a single base to a loss or gain of entire chromosomes or large chromosomal regions. Mutations that occur in germ line cells can be transmitted to future generations, whereas somatic cell mutations are restricted to a single individual and the population of cells derived from the mutated cell. Large-scale germ line chromosomal abnormalities are relatively rare, but they usually show a clear phenotype, which is generally pathogenic and often lethal. Large-scale somatic mutations are more common and often occur in tumor cells.
DNA base mutations can be grouped into three types: base substitutions, deletions, and insertions (Figure 10). A base substitution is by definition a change in a single base (i.e., a SNP). Synonymous or silent substitutions are the most frequently observed in coding DNA. They do not change an amino acid in the final gene product. However, they may have functional consequences by changing the splicing pattern of the gene. Non-synonymous substitutions result in an altered codon that specifies either a different amino acid (a missense mutation) or a termination codon (a nonsense mutation). A missense mutation can induce either a conservative or nonconservative amino acid substitution. A conservative substitution does not significantly change the chemical properties of the amino acid encoded by the new codon, whereas the amino acid introduced by a nonconservative substitution has different chemical characteristics. Thus, nonconservative substitutions are more likely to change the properties of the gene product than conservative substitutions. Deletions and insertions refer to the removal or addition, respectively, of one or a few nucleotides from the DNA sequence. These variations are relatively common in noncoding DNA. They are less frequent in exons where they may introduce frameshifts, i.e., alter the normal translational reading frame of the gene and thereby change the final gene product (Figure 10).
Figure 10.

The main classes of small-scale mutations.
Single-base mutations used to be viewed as functionally significant only if they affected the amino acid sequence. However, silent substitutions in exons, as well as mutations in the noncoding sequence, may also have significant effects on gene transcription and on the final gene product. For instance, mutations in the 5′-regulatory region may disrupt transcription factor binding sites, response elements, or enhancer or silencer sequences and thereby affect the rate at which a gene is transcribed. Although the 3′-UTR of a gene is typically thought of as not being as critical for its expression control as the coding and promoter regions, it does contain sequence elements affecting nuclear transport, polyadenylation, subcellular targeting, miRNA targeting, and stability of mRNA (65). However, mutations in the 3′-UTR have been shown to alter binding sites for miRNAs (319). Mutations in these sequences can therefore also influence gene transcription and translation. Both synonymous and non-synonymous substitutions in the coding sequence may alter splicing sites between coding and noncoding regions, as well as splicing enhancers and silencers, with potentially dramatic effects on the mature polypeptide (56).
With the extraordinary progress made in sequencing technologies, it has become feasible to sequence long stretches of DNA in many samples. Although the SNPs selected for a GWAS by providers or customized to meet the specific needs of an investigator can cover a substantial fraction of the genomic variants, they do not capture all of them. There is a trend for investigators to undertake “deep sequencing” of genomic regions of interest as generated by significant associations with SNPs and other lines of evidence. Sequencing allows for the identification of all existing rare and common variants, which can then be further tested in larger samples if warranted. Moreover, we are closer to the day when it will be technically and economically advantageous to simply sequence the whole genome of all participants or patients of a study. Capturing the whole sequence for all individuals of a study, combined with the ability to analyze the enormous amount of information generated, will remove once and for all the uncertainty about the representativeness of the set of markers retained for a given study, as is the case now. There are several companies that have sequencing platforms in development with the goal of being able to perform whole-genome sequencing on large numbers of individuals at reasonable cost, with a high degree of reproducibility and the necessary supportive software (e.g., Illumina, Applied Biosystems, Helicos BioSciences, Pacific Biosciences).
Genetics and exercise level
We begin our reviews of specific traits with a section on physical activity level. It will be followed by sections on cardiorespiratory endurance and muscular strength and the responsiveness to exercise training. Subsequently, we present an integrated discussion of pathways and genes that have the potential to generate new candidates for targeted genetic studies.
Regular physical activity is a central component of current public health recommendations. While psychological, social, and environmental factors contribute significantly to physical activity behavior, it has been recognized that activity behavior has a biological basis and that genetic variation could affect individuals’ propensity to be physically active or sedentary. Studies in nuclear and extended families have provided maximal heritability estimates ranging from 15% to 60% for total physical activity as well as for sedentarism, leisure-time activity, and sports participation (51, 61, 198, 231, 234, 296). Likewise, several twin studies have investigated various domains of physical activity behavior and reported consistently that phenotypic resemblance is significantly higher among MZ than DZ twins [see reference (255) for details]. For example, analysis of pooled data from seven large studies with a total of 37,051 twin pairs (13,676 MZ pairs, 17,340 same-sex DZ pairs, and 6,035 opposite-sex DZ pairs) reported that median heritability estimates across all individual cohorts reached 62% (314).
Data on molecular genetics of physical activity levels in humans are still scarce, although the first GWAS for activity level was recently published. However, animal studies provide several examples of how naturally occurring mutations and artificially induced changes in key genes may affect physical activity patterns. For example, modification of genes encoding key molecules for the dopamine pathway have been shown to affect activity levels; mice lacking the solute carrier family 6 (dopamine transporter), member 3 gene (Slc6a3) exhibit marked hyperactivity (88), whereas dopamine receptor D2 (Drd2) -deficient mice are significantly less active than wild-type animals (145). Along the same lines, disruption of the melanin-concentrating hormone (MCH) pathway leads to hyperactivity. Mice lacking the pro-melanin-concentrating hormone (Pmch) gene or carrying an inactive form of the Pmch gene are lean and hyperactive, although their food intake is normal (152, 288, 383). A similar hyperactivity phenotype is generated if the MCH action is blocked by knocking out the MCH receptor 1 (Mchr1) gene (17, 182, 383).
Lightfoot and colleagues reported on a major effort to define the genetic map of the spontaneous level of activity in mice. Voluntary wheel-running activity was measured at about 9 weeks in 41 inbred strains of mice (165). Thirty-eight strains could be used for haplotype association mapping with more than 8 million SNPs (85). Twelve QTLs were identified—three observed in males and females, five in males only, and four in females only. Three QTLs were identified for daily distance run, which remained significant under most analytical scenarios. Surprisingly, no QTLs for duration of daily activity or for running speed could be identified that were significant in both sexes. Confirming that there is a genetic predisposition in rodents to engage in exercise, Kelly and colleagues identified 32 significant QTLs for daily running traits in mice using a panel of 530 SNPs (146). An example of the potential involvement of a spontaneous gene mutation in physical activity regulation comes from the fruit fly (Drosophila melanogaster). These insects exhibit distinct activity patterns related to food-search behavior; rovers move about twice the distance while feeding, compared to sitters. This activity pattern is genetically determined and is regulated by the foraging dg2 gene (now known as for), which encodes a cGMP-dependent protein kinase (PKG) (221). PKG activity is significantly higher in wild-type rovers than in wild-type and mutant sitters, and activation of the for gene reverts foraging behavior in a sitter to that found in a rover. Furthermore, overexpression of the for gene in sitters changed a sitter’s behavior to that of the rover phenotype (221).
In humans, molecular genetic data on physical activity level come from candidate gene studies and genome-wide screenings. Candidate gene selection for physical activity and sedentarism traits is challenging because of the multifactorial nature of the phenotypes and limited knowledge of the biology of exercise participation. In studies based on a priori hypotheses, candidate gene selection has been motivated by neurotransmitter and energy balance pathways that are potentially involved in activity behavior regulation (DRD2, angiotensin I converting enzyme 1 [ACE], leptin receptor [LEPR], and melanocortin 4 receptor [MC4R]) (45). In the Quebec and HERITAGE Family Studies, a C/T transition in codon 313 of the DRD2 gene was associated with physical activity level; Caucasian women who were homozygous for the T-allele were significantly less active than the other genotypes in both studies (297). In the QFS cohort, Loos and colleagues reported significant associations between a C/T polymorphism located in the 5′-region of the MC4R gene and physical activity phenotypes (172). Homozygotes for the T-allele had significantly lower moderate to strenuous physical activity levels and higher inactivity scores than the other genotypes.
In Pima Indians, a glutamine (Gln) to arginine (Arg) substitution in codon 223 of the LEPR gene was associated with total physical activity level, calculated from the division of 24-hour energy expenditure by sleeping energy expenditure measured in a respiratory chamber. The Arg233Arg homozygotes showed a 5% lower physical activity level than the Gln223Gln homozygotes (308). In a group of never-treated stage I hypertensives (372), the ACE I/D genotype was associated with physical activity status assessed by a questionnaire. The frequency of the D/D genotype was significantly higher in the sedentary group than among physically active subjects. Approximately 76% of the D/D homozygotes were sedentary, whereas the corresponding frequency in the I-allele homozygotes was 48% (372).
Four studies have reported genome-wide linkage scans for physical activity traits. In the QFS, the strongest evidence of linkage was observed on chromosome 2p22-p16 for the physical inactivity phenotype (298). Suggestive linkages were found on 13q22 with total activity and moderate to strenuous activity and on 7p11 with both inactivity and moderate to strenuous activity (298). De Moor and colleagues reported genome-wide linkage scans for participation in competitive sports in 700 female DZ twins (1946 markers) and for exercise participation in Dutch sibling pairs (361 markers). Suggestive QTLs were identified on chromosomes 3q22-q24, 4q31-q34, and 19p13.3 (71, 72). A genome-wide linkage scan with a 10 centiMorgan microsatellite panel in the Viva La Familia Study revealed QTLs on chromosome 18q12.2-q21.1 for sedentary and light activities with logarithm of odds (LOD) scores of 4.07 and 2.79, respectively. Maximum LOD scores of 2.28 and 2.2 for total and moderate activities, respectively, were detected about 20 centiMorgans downstream at 18q21.32, near the MC4R locus (51).
The first GWAS on habitual physical activity level was published in 2009, and the report included results from two cohort studies: 1,644 unrelated individuals from the Netherlands Twin Register and 978 subjects living in Omaha, NE (70). Leisure-time physical activity level was quantified using questionnaires, and MET-hours were calculated based on the type, frequency, and duration of reported activities. Work and commuting-related (e.g., biking to work) activities as well as activities such as gardening were excluded from the MET-hour calculations. Exercisers were defined as subjects who reported at least 4 MET-hours per week, while those with less than 4 weekly MET-hours were classified as non-exercisers. The exerciser/non-exerciser classification was used as the primary phenotype for the GWA analyses. The GWAS SNPs were derived from Perlegen Sciences (Dutch cohort: 435,291 SNPs) and Affymetrix (American cohort: 381,000 SNPs) platforms. In addition, approximately 2.5 million SNPs from the International HapMap Caucasian database were imputed in both cohorts to standardize the SNPs from the two different platforms. The final genotype data set included 1.6 million SNPs. The proportion of genotyped SNPs was 17.5% and 18.9% in the Dutch and American cohorts, respectively (70).
None of the 1.6 million SNPs reached the commonly used threshold of genome-wide significance (p=5×10⁻⁸), although SNPs in three genomic regions showed p-values less than 1×10⁻⁵. The strongest associations were observed on chromosome 10q23.2 at the 3′-phosphoadenosine 5′-phosphosulfate synthase 2 (PAPSS2) gene locus; the odds ratio (OR) for being an exerciser was 1.32 (p=3.81×10⁻⁶) for the common T-allele of SNP rs10887741. PAPSS2 encodes an enzyme that is involved in sulfation of various molecules, including glycosaminoglycans. Mechanisms by which PAPSS2 could affect exercise participation are unknown, but mutations in the PAPSS2 have been reported to cause spondyloepimetaphyseal dysplasia, which is characterized by short stature and short limbs both in humans and in mice (343). The other two SNPs with p<1×10⁻⁵ were rs12612420 (p=7.61×10⁻⁶, OR=1.43), located about 12 kb upstream of the first exon of the DNA polymerase-transactivated protein 6 (DNAPTP6) gene (now known as spermatogenesis associated, serine-rich 2-like [SPATS2L]), and rs8097348 (p=6.68 × 10⁻⁶, OR=1.36), located about 236 kb upstream of chromosome 18 open reading frame 2 (C18orf2). The associations with previously reported physical activity candidate genes and physical activity linkage regions were explored as well. The strongest candidate gene association was detected with SNP rs12405556 (p=9.7 × 10⁻⁴, OR=1.24) at the LEPR locus. However, the pooled p-value reflected mainly the strong association observed in the American cohort (p=9.79 × 10⁻⁵; p=0.226 in the Dutch sample). The strongest association among the previously identified linkage regions was found on chromosome 15q13 with SNP rs8036270 (p=4.61 × 10⁻⁵) in the gamma-aminobutyric acid A receptor, gamma 3 (GABRG3) gene locus.
The major advantage of the GWAS strategy is that it is not restricted by a priori hypotheses, as is the case in candidate gene studies. Moreover, a GWAS covers the entire genome uniformly and in more detail than microsatellite-based linkage scans and thereby has much better sensitivity to detect small to moderate gene effects of relatively common sequence variants than the linkage scans. A critical feature of genetic studies is replication: findings of an individual study should be tested in other large cohorts with a similar phenotype and study design. If the associations are replicated, the case for the contribution of a gene and DNA sequence variant to the trait of interest becomes considerably stronger. Given that several large cohort studies with habitual physical activity questionnaire data have also recently completed GWAS SNP genotyping, we could have interesting new data with replication panels in the next few years.
The studies summarized here indicate that physical activity-related traits are influenced by genetic factors, with maximal heritability estimates ranging from 15% to 60%. The majority of the data available are based on genetic epidemiology studies, but the first molecular genetic studies support the notion that it is possible to detect biologically relevant genetic effects on habitual physical activity at the molecular level. The major limitation at the moment is the paucity of studies addressing the genetics of physical activity behavior in humans. Additional genetic studies on physical activity level would be particularly important for replication of the positive association studies. Currently, most of the findings are based on single reports, although in some cases the associations were found in multiple cohorts [e.g., reference (297)]. Larger studies would also allow us to investigate gene-gene interactions as well as potential pleiotrophic effects on physical activity and health outcomes. A recent study reported that phenotypic association between exercise participation and self-rated health status observed in over 5000 adult twins and their siblings was fully accounted for by additive genetic correlation (73). This observation raises the interesting question of whether activity behavior and health-related phenotypes are affected at least to some extent by some of the same genes. One clear limitation has been the measurement of physical activity level. Random variation in activity level estimates obtained from questionnaires and diaries can be quite high, which seriously limits the statistical power to detect small or moderate genetic associations. However, improvements in objective activity level-recording technologies will alleviate, if not solve, the problem.
The future for the genetic studies of physical activity behavior looks promising. Several stumbling blocks that have slowed progress in the field have been either eliminated or significantly alleviated. Once these improvements can be combined with the most recent advancements in molecular genetic techniques, our understanding of the genetics of physical activity behavior should improve drastically. One untouched area is that of DNA methylation and other epigenetic modifications and how they influence physical activity levels.
Genetics, cardiorespiratory endurance, and muscle strength
As summarized previously, a considerable amount of evidence indicates that cardiorespiratory fitness and muscular strength and power aggregate in families and are heritable traits. This section summarizes the current evidence from animal and human studies related to the molecular genetic architecture of exercise performance phenotypes. First, genome-wide studies in mice, rats, and horses, as well as a single-gene case in dogs, are reviewed. Then, we summarize exercise intolerance conditions caused by single-gene defects and review candidate gene studies in humans. Finally, genome-wide linkage scans for cardiorespiratory fitness and muscle strength phenotypes are reviewed.
Evidence from animal studies
In rats, a genome-wide linkage scan was performed using an intercross of two inbred strains, one with low (COP) and one with high (DA) running capacity. A genome-wide linkage scan found a significant QTL on chromosome 16 at 30 cM with a maximum LOD score of 4.0 (Table 5). In addition, suggestive QTLs were detected on chromosomes 16 (62 cM; LOD=2.9) and 3 (~4 cM; LOD = 2.2) (365). In a follow-up study, chromosomes 16 and 3 of DA rats were introgressed into the genetic background of COP rats. The DA chromosome 16 congenic COP rats had significantly greater aerobic running capacity than the COP rats (366). Using a similar paradigm, Lightfoot and colleagues intercrossed inbred mouse strains displaying high and low maximal exercise endurance capacity (166). A genome-wide linkage scan detected a significant QTL on the X chromosome with a maximum LOD score of 2.26 at 57.9 cM (Table 5). In addition, a suggestive evidence of linkage (LOD=1.19) was found on chromosome 8 at 36.1 cM (166).
Table 5.
Summary of the main findings from murine genome-wide linkage scans for maximal running capacity.
| Chr | Locus | Mb* | LOD | Human |
|---|---|---|---|---|
| Rat: | ||||
| 3 | D3Rat56 | 3.58 | 2.2 | 9q34 |
| 16 | D16Rat17 | 53.48 | 4.0 | 8p22 |
| 16 | D16Rat55 | 76.62 | 2.9 | 8p23 |
| Mouse: | ||||
| 8 | D8MIT359 | 76.55 | 1.19 | 19p13.1 |
| X | DXMIT31 | 160.41 | 2.26 | Xp22.2 |
The last column provides the location of a syntenic region in the human genome
indicates location of the marker showing the maximum evidence of linkage on a physical map in millions of base pairs.
Adapted from (Mouse) Lightfoot JT et al. Quantitative trait loci associated with maximal exercise endurance in mice. J Appl Physiol 103: 105–110, 2007 and (Rat) Ways JA et al. A genome scan for Loci associated with aerobic running capacity in rats. Genomics 80: 13–20, 2002.
Modern thoroughbred horses provide an interesting model for high exercise performance capacity. These horses have been selected for exceptional racing performance during the past 300 to 400 years, and they originate from a small number of founders. It has been estimated that the majority (95%) of the paternal lineage comes from one founder stallion while ten founder mares contribute about 72% of the maternal lineage. The selection process has brought about several physiological characteristics that contribute to the running capacity, including a large lung volume, high hemoglobin concentration, and high Q, as well as large skeletal muscle mass with high mitochondrial density, oxidative enzyme activity, and glycogen storage capacity. The average VO2max in thoroughbreds is over 200 mL of oxygen per kilogram per minute.
Using a panel of 394 equine microsatellite markers in 112 thoroughbreds and 52 non-thoroughbred horses, Gu and coworkers performed a genome-wide scan to identify selected genomic regions in thoroughbreds (104). Evidence of positive genomic selection was screened by testing deviation of observed marker heterozygosities from expected values (assuming neutrality) within the thoroughbred population and by testing allele frequency differences between thoroughbreds and non-thoroughbreds. Statistical significance was reached (p<0.05) in 17 genomic regions, 9 of which were also detected in the intrapopulation loss of heterozygosity tests (Table 6). While this approach can be used to detect positively selected chromosomal regions, it does not have sufficient sensitivity to identify specific genes. However, gene ontology analysis of the nine regions detected by both statistical methods returned 369 genes, allowing for some interesting observations. Biological processes and molecular functions that were found significantly more frequently than expected among these genes included cellular calcium ion homeostasis, sexual reproduction and spermatogenesis, porphyrin biosynthetic process, skeletal development, anatomical structure formation and regulation of osteoblast differentiation, hydrogen peroxide catabolic and metabolic processes, G-protein coupled receptor binding, oxidoreductase activity acting on peroxide as acceptor, and mitochondrial functions (104).
Table 6.
Summary of the chromosomal regions that showed evidence for positive selection in Thoroughbred horses.
| Chre | Map | Region | Inter-population | Intra-population | Human | ||
|---|---|---|---|---|---|---|---|
|
| |||||||
| FST | p-value | Dh/sd | p-value | ||||
| 4 | 38.6 | 34.4 – 40.1 | 0.45 | 0.005 | −6.117 | <0.001 | 7q21.3-q22 |
| 5 | 12.2 | 7.8 – 21.8 | 0.404 | 0.01 | −2.151 | 0.042 | 1q25-q25.3 |
| 11 | 36.8 | 21.9 – 39.7 | 0.392 | 0.013 | −2.916 | 0.002 | 17q21-q23 |
| 17 | 20.7 | 10.2 – 23.8 | 0.38 | 0.018 | −3.602 | 0.007 | 13q13-q14 |
| 25 | 25.7 | 15.7 – 28.1 | 0.352 | 0.02 | −6.775 | <0.001 | 9q32-q34.11 |
| 6 | 16.0 | 14.7 – 17.3 | 0.315 | 0.028 | −2.571 | 0.014 | 2q36 |
| 17 | 41.4 | 23.8 – 59.9 | 0.31 | 0.033 | −2.569 | 0.013 | 13q14-q31 |
| 18 | 31.1 | 23.1 – 31.9 | 0.309 | 0.036 | −2.534 | 0.01 | 2q22.3 |
| 27 | 29.6 | 27.3 – 35.3 | 0.309 | 0.038 | −2.863 | 0.017 | 4q34 & 8p23 |
The last column provides the location of a syntenic region in the human genome.
Adapted from Gu J et al. A genome scan for positive selection in thoroughbred horses. PLoS One 4: e5767, 2009.
While genome-wide studies in animals have not yet yielded any specific genes for exercise performance, the myostatin (MSTN) gene provides an interesting example of a naturally occurring mutation that has relevance for exercise capacity. Myostatin is a member of the transforming growth factor beta superfamily, and it acts as a negative regulator of muscle mass in mammals. Mstn mutations leading to inactive or defective gene product have been shown to double or even triple skeletal muscle mass in mice, cows, and sheep. Functional MSTN mutations are very rare in humans, but one case study described a young boy who was a homozygote for a G/A mutation located five nucleotides downstream of exon 1. The mutation abolishes a normal splice donor site and activates a cryptic splice site further downstream on intron 1, which leads to a severely truncated, inactive myostatin molecule. The boy appeared extraordinarily muscular already at birth, and at the age of 4.5 years, he was described to be both muscular and very strong (285).
A two-base pair deletion in exon 3 of Mstn leading to a premature stop codon at amino acid 313 was reported to cause the “bully” phenotype in the whippet dog breed (201). Homozygotes for the mutation have the characteristic double-muscled “bully” appearance, while heterozygotes have intermediate musculature. Interestingly, while the mutation was only rarely seen in dogs competing in dog shows, there was a significant excess of the mutant allele among the fastest dogs based on their racing grades. Thus, it seems that the muscular appearance due to the Mstn mutation is considered undesirable for breed standards, but it may provide an advantage for racing performance (201).
Exercise intolerance in humans
Although exercise-related traits are mainly polygenic and multifactorial in nature, much can be learned from some monogenic disorders characterized by compromised exercise capacity or exercise intolerance. These disorders affect only a few individuals, but they provide examples of biological defects that have profound consequences on the ability to perform physical activity, usually because of compromised energy metabolism. However, although these genetic defects compromise exercise capacity, there is no evidence that overexpression of the same genes leads to improved physical performance. We believe that important lessons can be learned from a brief review of the genes harboring mutations that result in diminished endurance performance.
The majority of the mutations found in exercise-intolerant patients are located in genes involved in energy production pathways, especially carbohydrate metabolism. A classic example is McArdle disease, a skeletal muscle glycogen phosphorylase deficiency due to mutations in the PYGM gene resulting in impaired glycogenolysis (188). Mutations in PHKA1, a gene encoding a muscle-specific isoform of the Δ subunit of phosphorylase kinase, a regulator of glycogen phosphorylase activity, causes impaired glycogenolysis and exercise intolerance (47, 367). Recently, homozygous stop codon mutations in muscle glycogen synthase 1 gene (GYS1) were reported to result in profound glycogen deficiency in the heart and skeletal muscle and, consequently, cardiomyopathy and exercise intolerance in siblings aged 10 and 11 years of age (153). In addition, mutations in several genes encoding components of the glycolysis pathway, such as muscle phophofructokinase (PFKM) (291, 336, 358), phosphoglycerate kinase 1 (PGK1) (109, 220, 315, 341) and phosphoglycerate mutase 2 (PGAM2) (107, 335, 340), enolase 3 (ENO3) (64), and lactate dehydrogenase A (LDHA) (177, 337), have been reported in patients with exercise intolerance.
Carnitine palmitoyltransferase 2 (CPT2) deficiency is the most common recessively inherited lipid metabolism disorder affecting skeletal muscle and causing exercise intolerance (27). Another lipid metabolism-related gene pertaining to exercise intolerance is that encoding very-long-chain acyl-CoA dehydrogenase (ACADVL) (283). Recently, a 20-year follow-up study of two boys with glycerol kinase (GK) deficiency due to mutations in the GK gene was reported (118). Both subjects showed pronounced exercise intolerance in childhood, but the exercise-related symptoms had disappeared when they were retested at 23 and 31 years of age (118). Other exercise intolerance-associated genes affecting skeletal muscle function or structure include solute carrier family 25 (mitochondrial carrier, adenine nucleotide translocator), member 4 (SLC25A4) (225), lysosomal-associated membrane protein 2 (LAMP2) (207), thymidine kinase 2, mitochondrial (TK2) (363), electron-transferring-flavoprotein dehydrogenase (ETFDH) (91), sarcoglycan, alpha (SGCA) (195) and sarcoglycan, gamma (SGCG) (350).
In addition to the genes encoded by nuclear DNA, mutations in the mitochondrial DNA are frequently found in patients with myopathies and exercise intolerance. The mitochondrial genes associated with exercise intolerance are summarized in Table 7. Mutations in the nuclear polymerase, gamma 2, accessory subunit (POLG2) gene have also been reported in exercise-intolerant patients (171, 361). POLG2 encodes the processivity subunit of the DNA polymerase gamma, which is the only DNA polymerase within mitochondria and is thereby critical for proper amplification of mitochondrial DNA.
Table 7.
Genes encoded by nuclear and mitochondrial DNA in which mutations have been reported in patients with exercise intolerance
| Gene | OMIM # | Location | Reference |
|---|---|---|---|
| Nuclear DNA: | |||
| CPT2 | 255110 | 1p32 | (184, 318, 321, 355, 356) |
| AMPD1 | 102770 | 1p13 | (131, 226) |
| ETFDH | 231675 | 4q32-q35 | (91) |
| SLC25A4 | 103220 | 4q35 | (225) |
| PGAM2 | 261670 | 7p13-p12 | (107, 335, 340) |
| LDHA | 150000 | 11p15.4 | (337) |
| PYGM | 232600 | 11q12-q13.2 | (338) |
| PFKM | 232800 | 12q13.3 | (291, 336, 358) |
| SGCG | 253700 | 13q12 | (350) |
| TK2 | 188250 | 16q22-q23.1 | (363) |
| ENO3 | 131370 | 17pter-p11 | (64) |
| ACADVL | 201475 | 17p13-p11 | (283) |
| SGCA | 600119 | 17q21 | (195) |
| POLG2 | 604983 | 17q23.3 | (171, 361) |
| GYS1 | 138570 | 19q13.3 | (153) |
| GK | 307030 | Xp21.3 | (118) |
| PHKA1 | 311870 | Xq12-q13 | (47) |
| PGK1 | 311800 | Xq13 | (339) |
| LAMP2 | 309060 | Xq24 | (207) |
| Mitochondrial DNA: | |||
| MTTL1 | 590050 | 3230 – 3304 | (53, 128) |
| MTND1 | 51600 | 3307 – 4262 | (206) |
| MTTI | 590045 | 4263 – 4331 | (54) |
| MTTM | 590065 | 4402 – 4469 | (29, 352) |
| MTTY | 590100 | 5826 – 5891 | (248) |
| MTCO1 | 516030 | 5904 – 7445 | (137) |
| MTTS1 | 590080 | 7445 – 7516 | (100, 247) |
| MTTD | 590015 | 7518–7585 | (289) |
| MTCO2 | 516040 | 7586–8269 | (191) |
| MTTK | 590060 | 8295 – 8364 | (202) |
| MTCO3 | 516050 | 9207 – 9990 | (29, 113, 125) |
| MTND4 | 516003 | 10760 – 12137 | (14) |
| MTTL2 | 590055 | 12266 – 12336 | (138, 354) |
| MTTE | 590025 | 14674 – 14742 | (114) |
| MTCYB | 516020 | 14747 – 15887 | (11–13, 26, 48, 141, 159, 179, 284) |
OMIM = Online Mendelian Inheritance in Man (http://www.ncbi.nlm.nih.gov/entrez/query.fcgi?db=OMIM)
Candidate gene studies in humans
Case-control studies in athletes
Comparison of DNA marker allele and genotype frequencies between competitive athletes and nonathlete controls has been a fairly popular study design in the search for genes related to athletic performance. The 2007review of the human gene map for performance and health-related fitness phenotypes (45) listed eight genes with at least one study reporting positive findings in endurance athletes, while five genes were positively associated in studies with sprint and strength athletes. The only gene that was reported by multiple studies was ACE, with 11 reports for endurance and 2 reports for sprint/strength. Ten of the eleven studies reported that the I allele of the ACE I/D polymorphism (associated with lower ACE activity than the D-allele in Caucasians) was more frequent in endurance athletes than in controls, while both sprint athlete studies found the D-allele frequency to be higher in athletes than in controls. Other genes that have been associated with endurance and sprint/strength athlete status include actinin, alpha 3 (ACTN3), adrenergic, alpha-2A-, receptor (ADRA2A), adrenergic, beta-2-, receptor, surface (ADRB2), adenosine monophosphate deaminase 1 (AMPD1), bradykinin receptor B2 (BDKRB2), endothelial PAS domain protein 1 (EPAS1), peroxisome proliferator-activated receptor alpha (PPARA), peroxisome proliferator-activated receptor gamma, coactivator 1 alpha (PPARGC1A), and mitochondrial DNA haplogroups (one positive study for each).
Cross-sectional studies with cardiorespiratory endurance, sprint, and strength phenotypes
Another popular study design that has been used in exercise performance-related genetic studies is cross-sectional association studies using quantitative measures of performance (e.g., VO2max) and DNA sequence variant(s) in candidate genes (e.g., SNPs). In the 2007 update of the human gene map for performance and health-related fitness phenotypes (45), positive associations with endurance-related traits were reported for 22 genes. However, only two genes had more than one study reporting an association with the same sequence variant. Three studies reported associations with adrenergic, beta-1-, receptor (ADRB1) variants and VO2max in cardiac patients (74, 276, 359), while thirteen studies dealt with various endurance-related traits and the ACE I/D polymorphism in healthy subjects and in cardiac patients. Most of the ACE studies reported greater performance trait values in the I/I homozygotes as compared to D/D genotype, although three studies reported exactly the opposite association pattern. Most of the ADRB1 and ACE studies were based on small sample sizes, and the genotype effect sizes were very small with borderline statistical significance.
For sprint- and muscle strength-related phenotypes, the ACTN3 gene has been studied most frequently so far (Table 8). A C/T transition in codon 577 of the ACTN3 gene replaces an Arg residue (R577) with a premature stop codon (X577), resulting in a nonfunctional gene product. The stop codon variant is quite common in humans, with allele frequencies ranging from 10% in African populations to 50% in Caucasians and Asians. Some studies have reported that the frequency of the stop codon allele or homozygosity for the stop codon variant (X577X) are lower in sprint and strength athletes than in nonathletes (79, 81, 227, 274, 277, 376), while others have not found any differences (213, 287, 377). Frequency of the 577X allele in endurance athletes has been reported to be either higher(376), lower (3), or not different (175, 213, 278) than in controls. While results from case-control studies with Caucasian athletes seem to suggest that the ACTN3 R577X genotype is associated with sprint and strength performance, results from studies using quantitative measures of such performance are mainly negative. In a cohort of 507 Greek schoolboys, the X577X homozygotes were significantly slower in a 40 m sprint than the homozogotes for the functional allele. However, the ACTN3 R577X genotype was not associated with sprint time in 439 girls of the same study (200). Studies in young and elderly British men did not find any association between R577X genotype and isometric or isokinetic knee extensor muscle function (189, 190). Likewise, muscle power and fatigue indices derived from a 30 s Wingate test did not differ between the ACTN3 genotypes (215). In 352 adult Caucasian and Asian women, the X577X homozygotes showed lower baseline values but greater increases in dynamic muscle strength after 12 weeks of strength training, while no differences were found in training responses between the genotypes among 247 men (63). However, a strength training study in elderly men and women found exactly the opposite: in women (n=86), the X577X homozygotes showed significantly higher baseline knee extensor concentric peak power than the heterozygotes and R577R homozygotes, whereas the improvements brought about by resistance training tended to be greater in the R577R homozygotes than in the stop codon homozygotes (76). Finally, in one report, young men with the X577X genotype had less type IIx muscle fibers (9% vs. 14%) than the R577R homozygotes (351), but another study in a comparable group of healthy young men and women could not replicate such a difference (215). Thus, data on the associations between the ACTN3 R577X genotype and sprint performance seem to be fairly consistent when comparing sprint/strength athletes with nonathlete controls. However, studies using carefully quantitative measures of muscle strength and sprint performance have been mainly negative, and more studies are needed to clarify whether the ACTN3 locus modifies the effects of resistance training on muscle strength.
Table 8.
Summary of the ACTN3 R577X genotype studies with performance phenotypes
| Study | Group (sample size) | 577X allele frequency | X577X genotype frequency | Main findings |
|---|---|---|---|---|
| Yang et al. 2003 (376) | Sprint (n=73) Endurance (n=40) Controls (n=120) |
0.28 0.46 0.44 |
0.06 0.24 0.18 |
X-allele frequency lower in sprinters vs. controls & endurance |
| Niemi et al. 2005 (213) | Sprint (n=73) Endurance (n=40) Control (n=120) |
0.29 0.30 0.32 |
0.09 0.10 0.09 |
No difference in frequencies between athletes and controls |
| Lucia et al. 2006 (175) | Cyclists (n=50) Runners (n=52) Controls (n=123) |
0.49 0.46 0.45 |
0.26 0.17 0.18 |
No difference in frequencies between athletes and controls |
| Clarkson et al. 2005 (63) | Men (n=182) Women (n=287) |
0.51 0.49 |
0.264 0.268 |
Greater training-induced increase in strength in the X/X vs. R/R homozygotes in women, no difference in men. |
| Delmonico et al. 2007 (76) | Men (n=71) Women (n=86) |
0.401 0.471 |
0.211 0.279 |
In women, greater baseline strength in the X/X vs. R/R, but training-induced increase greater in the R/R vs. X/X. |
| Moran et al. 2006 (200) | Boys (n=507) Girls (n=439) |
0.42 0.41 |
0.183 0.17 |
R allele associated with faster 40 m sprint time in boys but not in girls |
| Roth et al. 2007 (274) | Strength, white (n=52) Control, white (n=668) Strength, black (n=23) Control, black (n=208) |
0.423 0.436 0.283 0.245 |
0.096 0.199 0 0.048 |
Frequency of the X/X genotype lower in athletes vs. controls; no difference in the X allele frequencies. |
| Santiago et al. 2007 (277) | Soccer (n=60) Endurance (n=102) Controls (n=123) |
0.33 0.475 0.447 |
0.15 0.215 0.178 |
X-allele frequency lower in soccer players vs. controls. |
| Papadimitriou et al. 2008 (227) | Power T&F (n=73) Endurance (n=28) Controls (n=181) |
0.342 0.375 0.461 |
0.164 0.25 0.182 |
X-allele frequency lower in power athletes vs. controls; no difference in the X/X genotype frequencies |
| McCauley et al. 2009 (190) | Young men (n=79) | 0.424 | 0.190 | No association with knee extensor muscle strength and contractile properties |
| McCauley et al. 2010 (189) | Elderly men (n=100) | 0.365 | 0.16 | No association with isometric or isokinetic knee extensor muscle function |
| Norman et al. 2009 (215) | Young men and women (n=120) | 0.454* | 0.250* | Muscle power and fatigue index derived from 30-sec Wingate test were not associated with the genotype |
| Saunders et al. 2007 (278) | Fast triathletes (n=152) Mid triathletes (n=152) Slow triathletes (n=153) Controls (n=143) |
0.41 0.42 0.45 0.47 |
0.18 0.19 0.23 0.21 |
No differences in allele and Genotype frequencies between athletes and controls |
| Scott et al. 2010 (287) | Jamaica: -Sprint athletes (n=114) -Controls, Jam (n=311) USA: -Sprint Athletes (n=113) -Controls (n=190) |
0.137 0.136 0.187 0.159 |
0.019 0.026 0.037 0.018 |
No differences in allele and genotype frequencies between athletes and controls |
| Eynon et al. 2009 (81) | Sprinters (n=81) Endurance (n=74) Controls (n=240) |
0.31 0.57 0.49 |
0.14 0.32 0.18 |
Allele and genotype frequencies significantly different in sprinters than in endurance athletes and controls#. |
| Ahmetov et al. 2010 (3) | Endurance (n=456) Controls (n=1211) |
0.332 0.390 |
0.057 0.145 |
Frequency of the X-allele and X/X genotype significantly lower in endurance athletes than in controls. |
| Druzhevskaya et al. 2008 (79) | Power athletes (n=486) Controls (n=1197) |
0.333 0.387 |
0.064 0.142 |
Frequency of the X-allele and X/X genotype significantly lower in power athletes than in controls. |
| Yang et al. 2007 (377) | Ethiopians: - endurance (n=76) - controls (n=198) Kenyans: - endurance (n=284) - controls (n=158) Nigerians: - power (n=62) - controls (n=60) |
0.309 0.342 0.132 0.085 0.064 0.083 |
0.079 0.111 0.011 0.013 0 0 |
No differences in allele and genotype frequencies between athletes and controls |
Subjects were selected from larger cohort to derive approximately equal number of subjects with each genotype. Therefore, 577X allele frequency is greater than in the general population.
Genotype frequencies in controls deviate significantly from Hardy-Weinberg Equilibrium
Genome-wide linkage scans
While the candidate gene approach is quite appealing due to its straightforward nature and ease of execution, it has several limitations. First, selection of candidate genes is usually based on the current understanding of physiology of the trait of interest, which limits the available gene pool. Second, DNA mutations or polymorphisms that induce functional changes in genes encoding key regulators of physiological pathways may also carry undesirable effects, such as compromised survival of the individual. Thus, it is not surprising that traditional candidate gene studies have produced few successful hits. Genome-wide linkage and association studies provide an alternative strategy for gene finding. Both strategies rely on a uniform coverage of the entire genome with DNA sequence variants (usually SNPs and microsatellites) and statistical analyses of linkage or association between the DNA markers and traits of interest. Although these approaches require plenty of resources and they are analytically quite intensive, the advantage is that they are not restricted by a priori hypotheses regarding specific genes or mutations. Genome-wide scans have been used successfully to identify genes for several rare and common diseases and phenotypes, such as transcription factor 7-like 2 (TCF7L2) for type 2 diabetes and fat mass and obesity associated (FTO) for obesity.
GWASs are currently in progress for exercise performance traits, but three studies have reported genome-wide linkage scans for cardiorespiratory fitness and muscle strength phenotypes (41, 68, 69, 266, 326). In the HERITAGE Family Study, over 500 microsatellite markers were used to find genomic regions linked to VO2max and maximal power output (Wmax) in sedentary subjects (41, 266). Suggestive evidence of linkage with VO2max was detected on chromosomes 7q32, 7q36, and 11p15, while QTLs for Wmax were found on chromosomes 10q23, 13q33, and 18q11 (Table 9). Tiainen and colleagues performed a linkage scan for maximal walking speed and knee extensor performance in 94 pairs of elderly female DZ twins (326). The strongest evidence of linkage was detected on chromosome 8q24 for leg extensor power, on 13q14 for walking speed, and on 15q13.3 for isometric knee extensor strength.
Table 9.
Quantitative trait loci identified in multipoint genome-wide linkage scans for cardiorespiratory fitness and muscle strength phenotypes in humans
| Chr | Map | Marker | Trait | LOD | reference |
|---|---|---|---|---|---|
| 1q21.3 | 150.1 | rs13320 | Knee TLE | 2.33 | (69) |
| 2p24.2 | 18.67 | rs1445128 | Knee TF(0.524) | 2.57 | (69) |
| 2p23.3 | 27.06 | rs714513 | Knee TLE | 2.69 | (69) |
| 2q14.4 | 127.46 | rs477449 | Knee SE | 2.25 | (68) |
| 4p14 | 38.51 | rs1039559 | Knee RE | 2.23 | (68) |
| 6p25.2 | 25.97 | rs9328112 | Knee TLE | 2.08 | (69) |
| 7p12.3 | 47.76 | rs921630 | Knee RF | 2.03 | (68) |
| 7q32 | 127.7 | LEPMSAT | VO2max | 1.32 | (266) |
| 7q36 | 150.3 | NOS3 | VO2max | 1.64 | (266) |
| 8q24.1 | 123.81 | D8S514 | Leg extensor power | 2.84 | (326) |
| 9q21.32 | 38.25 | rs7845911 | Knee TLF | 2.00 | (69) |
| 10q23 | 95.96 | D10S677 | Wmax | 1.94 | (266) |
| 10q26.13 | 126.72 | rs4962424 | Knee TLF | 2.52 | (69) |
| 11p15 | 17.38 | SUR | VO2max | 1.94 | (266) |
| 13q14 | 47.79 | D13S153 | Walking speed | 2.41 | (326) |
| 13q33 | 107.89 | D13S796 | Wmax | 1.18 | (266) |
| 14q24.3 | 76.35 | rs760267 | Knee TLF | 4.09 | (69) |
| 15q13.3 | 31.52 | D15S1007 | isometric strength | 2.14 | (326) |
| 15q23 | 69.25 | rs1348318 | Knee SE | 2.91 | (68) |
| 18q11.2 | 18.86 | rs1010800 | Knee TLE | 2.20 | (69) |
| 18q11 | 23.4 | D18S478 | Wmax | 1.35 | (266) |
| 18q23 | 74.40 | rs1866338 | Knee RE | 2.08 | (68) |
In the Leuven Genes for Muscular Strength study, maximum isometric and torque-length knee strength characteristics were measured in 283 male siblings aged 17 to 36 years from 105 families. A genome-wide linkage scan using a panel of 6008 SNPs provided evidence of linkage for 6 different phenotypes on 13 genomic regions (Table 9). The strongest QTL (LOD=4.09) was detected on chromosome 14q24.3 for knee torque-length flexion (TLF). Additional QTLs for knee TLF were found on 9q21.32 and 10q26 (69). Other linkage regions included chromosomes 1q21.3, 2p23.3, 6p25.2, and 18q11.2 for knee torque-length extension, chromosomes 2q14.4 and 15q23 for knee slope extension, chromosomes 4p14 and 18q23 for knee ratio extension, chromosome 2p24.2 for knee torque flexion, and chromosome 7p12.3 for knee ratio flexion (68, 69). No overlapping regions were found in the Finnish and Belgian studies, which is not surprising given the differences in study groups (elderly female DZ twins vs. young male siblings) and DNA marker sets (microsatellites vs. SNPs).
Genetics and the response to exercise training
As reviewed earlier in this chapter, there are considerable individual differences in risk factor responses to regular physical activity, even when all subjects are exposed to the same volume of exercise, adjusted for their own tolerance level. Furthermore, the evidence from the genetic epidemiology studies suggests that there is a genetically determined component affecting exercise training response phenotypes. In fact, familial aggregation has been shown to be the strongest predictor of interindividual variation in training responsiveness in the HERITAGE Family Study. However, since these traits are complex and multifactorial in nature, and considering the fact that the risk factor changes are poorly correlated with one another, the search for genes and mutations responsible for the genetic regulation of the adaptive response patterns must target several families of phenotypes. It is also obvious that the research on the molecular predictors of exercise-related response phenotypes is still in its infancy.
Candidate gene studies
The 2007 update of the human gene map for performance and health-related fitness phenotypes included 214 autosomal and 7 X chromosome gene entries (45). Moreover, there were 18 mitochondrial genes in which sequence variants had been shown to influence relevant fitness and performance phenotypes. These findings were reported in 361 peer-reviewed research articles (Table 10). A total of 49 unique genes from 81 studies have been investigated in relation to exercise training-induced changes in hemodynamic (17 genes, 23 reports), body composition (19 genes, 22 reports), insulin and glucose metabolism (15 genes, 16 reports), and plasma lipid, lipoprotein, and hemostatic (15 genes, 20 reports) phenotypes. In addition, 15 autosomal genes and 1 gene encoded by mitochondrial DNA were reported in at least one study to be associated with physical performance-related phenotypes: 12 genes were associated with endurance phenotypes, whereas 5 genes were associated with speed- and muscle strength-related traits (45).
Table 10.
Number of research articles and genetic loci summarized in the 2007 update of the Human Gene Map for Performance and Health-Related Fitness Phenotypes*
| Phenotypes | # of papers | # of loci |
|---|---|---|
| -Endurance | 72 | 47 |
| -Strength & anaerobic | 40 | 26 |
| -Hemodynamics | 67 | 80 |
| -Body composition | 44 | 39 |
| -Insulin & glucose | 21 | 30 |
| -Lipids, inflammation, hemostatic | 38 | 25 |
| -Chronic diseases | 7 | 7 |
| -Exercise intolerance | 66 | 37 |
| -Physical activity | 9 | 18 |
see reference (45) for details
Adapted from Bray et al. (2009) The human gene map for performance and health-related fitness phenotypes: the 2006–2007 update. Med Sci Sports Exerc. 41, 35–73.
A majority of the genes summarized in the human fitness gene map were based on only one study with positive findings. It is unclear how many negative observations remain unpublished. For example, the genes associated with body composition, plasma lipid, and hemostatic phenotype training responses were all based on a single positive study. Similarly, most of the genes associated with physical performance training responses were reported in only one study, with the ACE and apolipoprotein E (APOE) genes being the only exceptions. However, the reports on the associations between VO2max training response and APOE genotype seem contradictory and therefore difficult to interpret: the E2 and E4 genotypes are associated with the lowest and highest, respectively, training responses in one study (108), while the other study found that carriers of the E2-allele showed significantly greater training-induced improvement than the E3/3 homozygotes (325). On the other hand, with hemodynamic training responses, some candidate gene findings have been replicated in at least two studies. These include angiotensinogen (AGT) and ACE, central components of the renin-angiotensin system. An association between blood pressure training response and the AGT M235T polymorphism has been reported both in the HERITAGE Family Study and the DNASCO study (257, 259). In white HERITAGE males, the AGT M235M homozygotes showed the greatest reduction in submaximal exercise DBP following a 20-week endurance training program (257), whereas in middle-aged Eastern Finnish men, M235M homozygotes had the most favorable changes in resting SBP and DBP during a 6-year exercise intervention trial (259).
Similarly, two studies have reported an association between the ACE I/D polymorphism and exercise training-induced LV growth (Figure 11) (196, 210). Montgomery and coworkers reported in 1997 that 10 weeks of physical training in British Army recruits induced greater increases in LV mass and septal and posterior wall thickness in the ACE D/D homozygotes than in the I-allele carriers (196). A few years later, the same group of investigators confirmed the finding by reporting that the training-induced increase in LV mass in another cohort of Army recruits was 2.7 times greater in the D/D genotype as compared to the I/I homozygotes. It was also reported that the association between the ACE genotype and LV mass training response was not affected by angiotensin II type 1 receptor inhibitor treatment (210).
Figure 11.
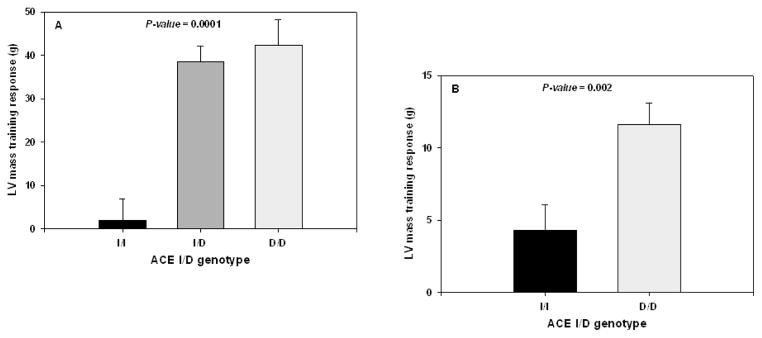
Angiotensin-converting enzyme (ACE) I/D polymorphism is associated with left ventricular mass training response.
Reproduced, with permission, from (254) T. Rankinen and C. Bouchard, 2005, Genes, genetic heterogeneity, and exercise phenotypes, In Molecular and cellular exercise physiology, edited by F.C. Mooren and K. Volker (Champaign, IL: Human Kinetics), 50. Adapted from H.E. Montgomery et al., 1997, “Association of angiotensin-converting enzyme gene I/D polymorphism with change in left ventricular mass in response to physical training.” Circulation 96: 741–747, and S.G. Myerson et al., 2001, “Left ventricular hypertrophy with exercise and ACE gene insertion/deletion polymorphism: A randomized controlled trial with losartan.” Circulation 103: 226–230.
Hypothesis-free gene finding approaches and exercise training phenotypes
One weakness of the candidate gene approach is that the gene selection is limited by our current understanding of the physiology regulating the trait of interest. It is safe to say that such an approach is less than optimal to identify all relevant genes. Genome-wide linkage analysis has been a powerful method to identify genes that cause Mendelian disorders and monogenic diseases. Success with multifactorial and oligo-/polygenic traits has been less spectacular, although the genomic region containing a TCF7L2 gene, a major disposing gene for type 2 diabetes, was originally identified through linkage analysis (80, 101, 260).
The HERITAGE Family Study has used genome-wide linkage analysis to find genes for exercise training response phenotypes. QTLs for training-induced changes in submaximal exercise (50 W) SV (ΔSV50) and HR (ΔHR50) were found on chromosomes 10p11 and 2q33.3-q34, respectively (252, 304). The ΔSV50 QTL on 10p11 was narrowed down to a 7 Mb region using dense microsatellite mapping. Genes within the region were tested for associations by genotyping a dense panel of SNPs within the gene loci. Among the linkage-positive families (family-specific LOD-score>0.025) the strongest associations were found with SNPs in the kinesin family member 5B (KIF5B) gene locus (16). Resequencing of the KIF5B revealed several DNA sequence variants, especially in the putative promoter region. The SNP that showed the strongest association with ΔSV50 was found to modify the KIF5B promoter activity. Furthermore, analogous inhibition and overexpression studies showed that changes in KIF5B expression level alter mitochondrial localization and biogenesis: KIF5B inhibition led to diminished biogenesis and perinuclear accumulation of mitochondria, while overexpression enhanced mitochondrial biogenesis (16). The precise link between an altered mitochondrial phenotype and cardiac SV during submaximal exercise remains to be established.
The QTL for ΔHR50 on chromosome 2q33.3-q34 was localized within a 10 Mb region, and the area was fine-mapped with a dense panel of almost 1500 SNPs (253). The strongest evidence of association was detected with two SNPs located in the 5′-region of the cyclic AMP responsive element binding protein 1 (CREB1) gene (p=1.6 × 10⁻⁵), and the associations remained significant after accounting for multiple testing (Figure 12). The most significant SNP (rs2253206) explained almost 5% of the variance in ΔHR50, and the common allele homozygotes and heterozygotes had about a 57% and 20%, respectively, greater decrease in HR50 than the minor allele homozygotes. Furthermore, the same SNP, which is located about 2.6 kb upstream of the first exon of CREB1, was shown to modify promoter activity in vitro: the A-allele, which was associated with a blunted ΔHR50 response, showed significantly greater promoter activity in a C2C12 cell model than the G-allele. Given the role of CREB1 in cardiac memory formation (273), it serves as an excellent positional and functional candidate gene for ΔHR50.
Figure 12.

Positional cloning of a HR50 training response QTL on chromosome 2q34 in the HERITAGE Family Study.
From Rankinen T, Argyropoulos G, Rice T, Rao DC, Bouchard C. CREB1 is a strong genetic predictor of the variation in exercise heart rate response to regular exercise: The HERITAGE Family Study. Circ Cardiovasc Genet. 3(3):294–9, 2010. Reproduced with permission from Wolters Kluwer Health.
Global gene expression profiling was used in the HERITAGE Family Study to identify genes associated with insulin sensitivity training response (ΔSI) (322). Total RNA was extracted from vastus lateralis muscle biopsies from eight subjects who were ΔSI high responders and from eight age-, sex-, and BMI-matched ΔSI nonresponders. RNA samples were pooled within each responder group, labeled with fluorescent dyes, and hybridized onto in situ-generated microarrays containing 18,861 genes. A total of 47 transcripts were differentially expressed (at least 1.4/0.7-fold difference) at baseline, while another 361 transcripts showed differential expression post-training. Five genes (v-ski sarcoma viral oncogene homolog [SKI], four and a half LIM domains 1 [FHL1], titin [TTN], pyruvate dehydrogenase kinase, isozyme 4 [PDK4], C-terminal binding protein 1 [CTBP1]) that exhibited at least a 50% difference in expression between high responders and nonresponders either at baseline or post-training were selected for validation experiments. Quantitative real-time PCR confirmed the microarray-based expression patterns for four of the five genes: PDK4 expression was 1.8-fold greater in high responders than in nonresponders at baseline, while high responders showed significantly greater FHL1, TTN, and SKI expression levels after the training program (322). Association of the FHL1 gene with exercise training-induced changes in insulin metabolism phenotypes was further investigated by genotyping three SNPs in the FHL1 locus (Xq26) (323). SNP rs9018 was associated with disposition index (p=0.016) and glucose disappearance index (p=0.008) changes in white women, while in the white males, the same SNP showed suggestive association with fasting insulin training response (p=0.04). Another SNP (rs2180062) was associated with fasting insulin (p=0.012), insulin sensitivity (p=0.046), disposition index (p=0.006), and glucose disappearance index (p=0.03) training responses in white males (323).
Recently, Timmons and colleagues used a combination of global skeletal muscle gene expression profiling and DNA sequence variation screening to identify genes associated with VO2max training response status (328). RNA expression profiling of pretraining skeletal muscle samples identified a panel of 29 transcripts that were strongly associated with VO2max training response in two independent exercise trials. Next, haplotype tagging SNPs in the 29 predictor genes were identified and genotyped in the HERITAGE Family Study. A multivariable regression analysis using the predictor gene SNPs and a set of SNPs from positional cloning and candidate gene studies of the HERITAGE Family Study identified a set of 11 SNPs that explained about 22% of the variance in VO2max training response (Table 11). Seven of the SNPs were from the RNA predictor gene set and four were from the HERITAGE QTL projects. Interestingly, when incorporated in the original RNA transcript prediction model, three of the four QTL-derived genes improved the performance of the model (328).
Table 11.
Stepwise Regression model for VO2max training response in the HERITAGE Family Study using candidate gene SNPs derived from global skeletal muscle gene expression profiling (RNA predictor) and exercise training-related QTL studies
| Gene (SNP) | Identification method | RNA level correlation | Chr. | Map | partial r2 | Regression model
|
|
|---|---|---|---|---|---|---|---|
| model r2 | p-value | ||||||
| SVIL (rs6481619) | QTL | YES (+) | 10 | 30,022,960 | 0.0411 | 0.0411 | <.0001 |
| SLC22A3 (rs2457571) | RNA predictor | YES (+) | 6 | 160,754,818 | 0.0307 | 0.0718 | 0.0003 |
| NRP2 (rs3770991) | QTL | YES (+) | 2 | 206,363,984 | 0.0224 | 0.0942 | 0.0017 |
| TTN (rs10497520) | QTL | NO | 2 | 179,353,100 | 0.0204 | 0.1146 | 0.0025 |
| H19 (rs2251375) | RNA predictor | YES (+) | 11 | 1,976,072 | 0.0268 | 0.1414 | 0.0004 |
| ID3 (rs11574) | RNA predictor | YES (+) | 1 | 23,758,085 | 0.02 | 0.1615 | 0.0021 |
| MIPEP (rs7324557) | QTL | YES (−) | 13 | 23,194,862 | 0.0163 | 0.1778 | 0.0051 |
| CPVL (rs4257918) | RNA predictor | YES (+) | 7 | 29,020,374 | 0.0179 | 0.1957 | 0.0031 |
| DEPDC6 (rs7386139) | RNA predictor | YES (+) | 8 | 121,096,600 | 0.0112 | 0.2069 | 0.0185 |
| BTAF1 (rs2792022) | RNA Predictor | YES (+) | 10 | 93,730,409 | 0.0125 | 0.2194 | 0.0122 |
| DIS3L (rs1546570) | RNA Predictor | YES (+) | 15 | 64,382,829 | 0.0095 | 0.2289 | 0.0279 |
Modified from Timmons, et al (2010) Using molecular classification to predict gains in maximal aerobic capacity following endurance exercise training in humans. J Appl Physiol. 108, 1487–1496
Genes, exercise, and skeletal muscle adaptation
Consideration of the genes responsible for the health benefits of exercise, via alterations in skeletal muscle tissue, requires us to define the types of exercise that human muscle reasonably encounters. Broadly speaking, we can consider three distinct scenarios: repetitive muscle contraction that remodels the tissue into what is considered an endurance phenotype; reduced muscle contraction from inactivity, yielding a combined loss of endurance phenotype and muscle cross-sectional area, and finally intense muscle contraction carried out relatively infrequently to stimulate muscle hypertrophy. These scenarios are theoretically at opposite ends of the spectrum, but the molecular adaptations within human skeletal muscle from the achievable extremes of voluntary strength versus endurance exercise most likely overlap. Thus, the underlying molecular signals and regulatory genes are likely to be to some extent common to all modes of voluntary exercise.. On the other hand, the regulatory processes that evolve during a period of inactivity, in human muscle, are only now being explored (28) to the level of detail comparable with exercise interventions. Indications are that the molecular responses within human skeletal muscle, to inactivity and frailty, are not necessarily a simple “opposite” to that found following increased muscle activity (134, 204, 311, 330). A review of pathways and genes participating in skeletal muscle adaptation to any of the three paradigms defined above will be useful in defining new candidate genes for exercise genomic and exercise genetic studies.
Aerobic exercise capacity is one of the most powerful predictors of all-cause mortality (209). There is even evidence that being “unfit” even while being physically active is still associated with a higher mortality risk (208). Thus the endurance capacity of the skeletal muscle and cardiovascular system is extremely important. The idea that skeletal muscle phenotype may impact on metabolic fitness is well established (167), and leanness and insulin sensitivity are correlated with higher oxidative capacity of the skeletal muscle (157). What is unclear is precisely how much of the skeletal muscle phenotype is determined by environmental factors, such as physical activity, and how much is genetically predetermined (as reviewed above). Recent evidence indicates that genetic variation in the insulin receptor substrate 1 gene (IRS1) associates with type II diabetes and insulin resistance (275). While skeletal muscle is the largest insulin target organ in the body, and in healthy subjects the site of most glucose disposal following a meal, it remains to be demonstrated that this increased genetic “risk” is mainly driven via skeletal muscle rather than, for example, hepatic insulin resistance. Furthermore, it must be kept in mind that exercise training impacts not only the skeletal muscle system, but also other organs critical for cardiovascular and metabolic fitness, such as the pancreas (300). Nevertheless, there is a wealth of molecular studies that attempt to link gene activation, endurance exercise muscle phenotype, and metabolic and cardiovascular fitness. The key genes are discussed in detail below.
An additional consideration is the type of endurance training being considered as the stimulus for change. If one considers strength training and endurance training as the extremes, then between these extremes it has been found that higher intensity training can provide more profound molecular changes when compared with lower intensity endurance training, for some (156, 300) but not all (300) cardiovascular and metabolic factors, particularly when the volume of training is also higher (126, 133). Somewhat in contrast to this, a single weekly bout of high-intensity exercise appears to reduce the risk of cardiovascular death, with no additional impact being noted for a higher volume of physical activity (373). This seemingly contradictory conclusion derived from mortality data can be perhaps reconciled by recent developments demonstrating that extremely high-intensity, low-volume sprint interval training can induce the physiological (18, 49, 50, 92, 93) metabolic (18, 49) and molecular (94) responses in skeletal muscle normally attributed to a traditional endurance exercise training program (96, 357). Robust data from randomized controlled trials of exercise “dosage” and clinical outcomes most strongly speak to what is required to reduce risk factors. For example, lifestyle interventions (including physical activity) undoubtedly prevent or delay the development of type 2 diabetes in subjects with impaired glucose tolerance (148, 342). This may be explained by the molecular processes detailed below; nevertheless, risk factor reductions in these key intervention studies have still to be unequivocally translated to reductions in cardiovascular disease events in a randomized controlled trial (95, 344), and this must be kept in mind when considering a link between genes, molecular mechanisms, and disease prevention.
Finally, improvements in muscle aerobic potential and glucose transport capacity with very-high-intensity exercise protocols indicate that a simple relationship between muscle contraction frequency and duration and the subsequent molecular responses does not exist in human skeletal muscle. Rather, some nonlinear integral of time spent and the magnitude of signal molecule change must somehow sense muscle activity and translate this into relatively common molecular responses, such as increased glucose transporter expression, increased mitochondrial capacity, and improved vascular function (49). Thus, commonly used physical activity protocols, such as endurance training and strength training, improve cardiovascular health (281), and both modalities of exercise can induce many overlapping changes in physiology (243). In the end, it may be determined that they activate similar molecular pathways, when studied at the appropriate time point within the muscle, in subjects with the same baseline physiological profile. This later point should be kept in mind when reflecting on the analysis presented in the following two sections and in particular when attempting to conclude which type of exercise therapy is interacting with one’s genetic profile to optimally reduce morbidity and mortality.
In the following sections, we address several key genes that appear to regulate or have been proposed to regulate exercise-induced skeletal muscle adaptation and health benefits. Often there is little data on gene sequence variation and the physiological traits of interest, and thus this section serves to highlight potential candidates for future detailed genomic and genetic studies.
Human muscle endurance adaptation and regulatory genes
Calcium-mediated regulation of calcineurin signaling in skeletal muscle is one of the most promising mechanisms connecting muscle activation and endurance adaptation (58, 60, 219). This reflects earlier concepts connecting chronic nerve stimulation, hence chronic flux in calcium ion channels and remodeling of skeletal muscle fiber type to an oxidative phenotype (237). Intriguingly, it is now understood that calcium-mediated activation of calcineurin phosphatase has plausible links to remodeling of muscle tissue (60), as well as promotion of myocyte hypertrophy (219). Thus our first candidate gene, which not only promotes the expression of the slow isoforms of the myosin heavy chain (60) but also activates the mitochondrial biogenesis pathway via calcium/calmodulin-dependent protein kinase (CaMK) and PPARGC1A in murine skeletal muscle (375), has the potential to integrate both endurance and strength stimuli and thus help explain some of the overlapping benefits of both modes of exercise. Interestingly, there is some evidence that a five-base pair deletion within the calcineurin promoter yields subjects much more sensitive to cardiac hypertrophy stimuli, such as hypertension (320).
One of the skeletal muscle phenotypes of the constitutively active calcineurin murine model is a modest switch of fiber type from fast to slow, a process that can be opposed by the administration of cyclosporin (CsA) (219). This shift in the proteins directly involved in the contractile process is rarely, if ever, encountered in humans (130), while the accompanying metabolic adaptations represent the more common feature of muscle remodeling, that is toward an oxidative, mitochondrial-rich, insulin-sensitive phenotype (97). Calsarcin-2 has been identified as a negative regulator of calcineurin signaling exclusively in fast-twitch skeletal muscle fibers, where loss of calsarcin-2 (encoded by the myozenin 1 [Myoz1] gene) results in a transformation toward slow-twitch oxidative fibers (86). Further experimental support exists for a major role in calcium buffering and muscle phenotype. Overexpression of the calcium buffering protein parvalbumin in slow fibers, e.g., mouse soleus, resulted in a reduction in mitochondrial enzyme expression and a change in contractile property, this time without any major shift in myosin heavy chain expression (59). This later observation suggests that there is a graded response to calcium as a signaling mediator of skeletal muscle remodeling, whereby metabolic and fatigue resistance phenotypes do not require complete switching of the myosin isoforms, an observation consistent with changes observed in humans with endurance training.
Examination of the CaMK families in human skeletal muscle indicates that the CaMKII and CaMK kinase (272) rather than CaMKIV (375) genes may be responsible for sensing the signal to remodel following endurance exercise. CaMKII is rapidly phosphorylated during endurance exercise, as is the downstream target gene, phospholamban (PLN), and activity of this pathway appears to remain activated throughout 90 minutes of endurance exercise in humans. In contrast, expression of CaMKIV could not be detected in human skeletal muscle (272). While the majority of CaMKII appears localized to the soluble cytosolic fraction, there is some evidence that it can regulate gene expression via modulation of serum response factor (SRF) and myocyte enhancer factor 2 (MEF2) (169) and thus plausibly regulate longer term aspects of muscle phenotype. The link between CaMKII and muscle gene expression changes in response to exercise is further supported by the observations of McGee et al. (192) in human skeletal muscle and those of Potthoff et al. (244) in murine models. These studies link epigenetic histone modifications that occur during endurance exercise and CaMKII signaling. Histone acetylation results in an open chromatin confirmation, potentially facilitating gene expression. It has been demonstrated that histone deacetylase activity (HDAC5 in particular) is reduced in human skeletal muscle following exercise, and histone acetylation is markedly increased (192). HDAC5 is exported from the nucleus and tagged for proteosome degradation, such that this Class II HDAC has been suggested as a candidate for facilitating the mass transcriptional response following acute endurance exercise in human muscle (178). CaMKII is a potential regulator of the phosphorylation and hence distribution of HDAC5 within the cell (192), suggesting that the large activation of muscle CaMKII with endurance exercise (272) may impact on global gene expression via this epigenetic mechanism. Whether such mechanisms account for all of the global long-term alterations (329) in the skeletal muscle transcriptome with endurance training remains to be determined. Genetic variance in the HDAC5 gene has been linked to the regulation of bone growth (269), but as of yet, not to muscle function or metabolic health.
Some of the most studied regulators of skeletal muscle phenotype are PPARGC1A (168) and AMP-activated protein kinase (AMPK) (132). Activation of both PPARGC1A and AMPK occurs in response to classic endurance training (216) and ultra-high-intensity sprint cycling (94), both of which stimulate mitochondrial biogenesis and endurance capacity. Furthermore, the activation of PPARGC1A is thought to occur partly via the p38 mitogen-activated protein kinase (MAPK) pathway (5, 94), which is also activated by exercise (369). It was initially demonstrated that overexpression of PPARGC1A could drive the formation of slow-twitch fiber expression in a murine model (168). In combination with PPARGC1A’s role in determining brown adipose tissue oxidative capacity and the now obvious link between brown adipocytes and myocytes (333), PPARGC1A has been extensively studied for its potential to influence insulin action on skeletal muscle and to determine muscle performance (112). For example, when selectively knocked out in the skeletal muscle of a murine model, it resulted in loss of type I slow-twitch fibers, a loss of exercise capacity, and an increased sensitivity to contraction-induced muscle damage (111). The same model also demonstrated impaired glucose regulation despite having normal peripheral insulin sensitivity. Until recently, it was thought that PPARGC1A was specifically downregulated in the skeletal muscle of type 2 diabetic patients (199), and while this may have been due to inactivity (330), it would appear that this observation is not reproducible (89). Furthermore, when PPARGC1A is over-expressed (to supraphysiological levels) in skeletal muscle, mitochondrial density is increased more than twofold, about 10 times that observed with regular endurance training in humans (357), yet the animals were more prone to diet-induced insulin resistance and if anything demonstrated impaired muscle metabolism (62).
So the full repertoire of benefits resulting from the activation of PPARGC1A during endurance exercise in humans remains to be determined. Furthermore, it is still unclear whether PPARGC1A is involved in regulating muscle gene expression responses to endurance exercise in humans, as there is no bioinformatic support for such an association (143, 329) and recent data from a murine model (whole-body KO of Ppargc1a) indicates that the skeletal muscle can respond to endurance training and upregulate components of the mitochondrial proteome (162). The PPARGC1A studies therefore provide an excellent example of genetic redundancy—PPARGC1A is able to regulate oxidative metabolism and function when overexpressed, yet when removed, it can be compensated for by factors yet to be identified. There are several small studies linking genetic variants at the PPARGC1A loci and metabolic disease; however, these associations have not proven to be reproducible across different ethnic groups or in larger GWASs. Additional mitochondrial factors, such as mitochondrial transcription factor A (TFAM), B1 (TFB1M), and B2 (TFB2M), are also regulated in human skeletal muscle by endurance exercise training, with the latter two being induced at the mRNA level following only 10 days of endurance training (217), while TFAM is regulated largely at the protein level with 4 weeks of endurance training, resulting in a significant increase in protein abundance (21, 216). It is unclear whether any of these factors currently limit or determine the magnitude of mitochondrial changes with endurance exercise training. Furthermore, given that mitochondrial oxidative capacity far exceeds skeletal muscle metabolic rates, apart from during the rest to work transition period (331), the impact of alterations in maximal mitochondrial capacity for metabolic health is far from clear at this time.
A similar scenario to PPARGC1A can be painted for AMPK and readers are referred to the detailed analysis by Jensen and colleagues. Briefly, AMPK has been postulated as a key energy sensor during exercise, whereby alterations in [AMP] would activate AMPK, and AMPK would enact downstream transcriptional events that occur following exercise. Intriguingly, during moderate-intensity aerobic muscle contraction, [AMP] is stable, and only during reduced blood flow or high-intensity contraction do AMP levels change measurably (332). It is now recognized that AMPK is also activated by a number of exercise-activated kinases, including CaMKII (132). AMPK may regulate substrate uptake and oxidation during acute muscle contraction. However, when genetically ablated, muscle glucose uptake during exercise appears unaltered (176), suggesting that there are multiple redundant genes responsible for regulating muscle glucose uptake (beyond the mass action of metabolism per se). Neither KO of the α2-AMPK subunit (also known as Prkaa2) or the α1-AMPK subunit (Prkaa1) alters substantially the gene expression response to endurance running in mice (136), and the various KO models have yielded marginal phenotypes inconsistent with the proposed idea that AMPK is a master regulator of skeletal muscle metabolism (115). There is some evidence that genetic variants of AMPK are associated with alterations in systemic lipid metabolism (302). Moreover, variants in the subunit PRKAA2 are associated with a higher risk for developing type 2 diabetes in Japanese subjects (124), but this has not been a universal finding in other ethnic groups. Nevertheless, any potential association may reflect functions of AMPK not only in skeletal muscle, but within other organs as well, especially the liver.
These latter two genes, PPARGC1A and AMPK are classic examples whereby cellular-molecular discoveries led to subsequent descriptive studies in human skeletal muscle accompanied by parallel work using TG mice. A key lesson from the enormous literature on both genes is that it is most likely that any prominent gene involved with human exercise adaptation and the health benefits thereafter are unlikely to be involved in a gene network that does not harbor significant redundancy. Another well-known exercise gene is interleukin 6 (IL6). Research into the regulation and function of IL6 in exercising humans and ultimately in metabolic disease originates largely from a substantial series of human studies and a key hypothesis that IL6 could represent an exercise factor linking physical activity with longer term metabolic fitness (83, 228). Ostrowski and colleagues reported that following 2.5 hours of running, plasma levels of IL6 were elevated 25-fold while markers of muscle began to rise from 30 minutes of exercise onward (223). Subsequently, it was demonstrated that during concentric exercise protocols IL6 mRNA was detectable in the active muscle (135), and there appeared to be a modest production of IL6 across the exercising human limb during concentric knee extensor exercise (307). This data were interpreted as skeletal muscle cells actively producing IL6 in response to parameters altered by muscular exercise, namely alterations in energy metabolism or calcium-mediated changes in cell signaling (83). Three additional studies emphasized the claim that IL6 is produced from skeletal muscle subjected to exercise. There has been a suggestion that IL6 expression in skeletal muscle is regulated or senses muscle glycogen status (83). However, somewhat in contrast to this concept, IL6 protein expression was found to be induced in type II muscle fibers following 120 minutes of cycle ergometry; these fibers were the most rich in glycogen staining (121) and those least recruited during such an exercise protocol. In situ hybridization analysis also indicated that IL6 mRNA was induced most in those muscle fibers that retained the most glycogen staining. In order for IL6 to function in an autocrine (or local paracrine manner), some or all skeletal muscle fibers should express the IL6 receptor (IL6R) protein. In resting skeletal muscle, there is little IL6R protein expression, while mRNA for the gene is claimed to be detectable (142).
It would appear that IL6 is produced within the exercising limb. Recent evidence suggests that its induction may be partly regulated by nitric oxide (306), suggesting that IL6 production is integrated into central regulators of cardiovascular and metabolic function. However, so far the physiological role of IL6 produced from the muscle remains obscure. As noted above, the link to muscle glycogen content appears inconsistent with the idea that it is an energy sensor, while infusion of IL6 to levels noted during exercise do not alter whole-body glucose disposal or liver glucose production (305)—somewhat consistent with the relative lack of IL6R expression in non-exercised muscle (142). In contrast, when subjects are infused with IL6 during 2 hours of low-intensity exercise [when muscle IL6R is still to be induced (142)], IL6 increases both the rate of appearance and disappearance of infused labeled glucose (82). In the same study design, no impact on fatty acid oxidation rates were noted during exercise (122), while IL6 infused at ”exercise levels” during rest stimulated lipolysis and increased the circulating fatty acid concentration (346) and suppressed skeletal muscle protein synthesis (345). Whether these modest metabolic effects are mediated directly by IL6 or via alterations in growth hormone and cortisol (235) is unclear. Chronic overexpression of IL6 in a single murine skeletal muscle model is detrimental to metabolic homeostasis (84). The local autocrine or paracrine role for transient IL6 production in skeletal muscle during exercise remains to be evaluated, as does it role in adaptation to exercise training. Polymorphisms in the IL6 gene appear to interact with age to increase diabetes risk (347) and a genomic variant is associated with higher plasma levels (310), suggesting that IL6’s main physiological role is more linked to its traditional inflammation role. Such genetic associations have, however, not been reproduced in all studies (250).
Vascular endothelial growth factor (VEGF) is an angiogenic growth factor that is also secreted from skeletal muscle tissue and is a critical factor regulating capillary density. Enhanced muscle capillary density with regular exercise may convey some of the enhancements of insulin action on skeletal muscle (75, 301), through increased target organ surface area and improved glucose uptake. Expression of the VEGF gene is increased at the mRNA level 4 hours after a single bout of treadmill running in rats (46) in a manner that may be oxygen dependent. Chronic motor nerve stimulation remodels skeletal muscle to be more oxidative and more vascular. Three days after the initiation of chronic motor nerve stimulation, Annex and colleagues demonstrated that skeletal muscle tissue produced VEGF protein and that greater expression was found in more oxidative muscle tissue (15). Likewise, in human subjects, a single 45-minute bout of aerobic exercise is sufficient to induce VEGF mRNA (106). What drives this acute response in human skeletal muscle is not entirely clear, as neither hypoxia nor restricted blood flow convincingly amplify the impact on exercise on VEGF gene transcription (106, 263). There is the possibility that hypoxia factor-1, which is activated and translocates to the nucleus during muscle contraction, can be responsible for VEGF induction (7). What is clearer is that successful cardiovascular adaptation (328) to endurance exercise in humans is associated with greater increases in the expression of VEGF and of its related receptors (327). However, induction of VEGF mRNA with acute endurance exercise is attenuated following endurance training (264). Recent murine data indicate that muscle-specific reductions in VEGF (by 90%) substantially decrease muscle capillary density, with a compensatory induction of metabolic enzymes, but overall, a phenotype of impaired endurance capacity is found (218), clearly documenting the physiological importance of muscle VEGF expression. Importantly, and consistent with the idea that within the range of voluntary exercise possible in healthy, untrained subjects, acute resistance training also enhances VEGF protein production from the muscle - an observation consistent with the role of resistance exercise in reducing cardiovascular disease risk factors (243). This observation also supports the idea that many of the genes activated by robust endurance training will also be called upon during resistance training in sedentary subjects to improve their cardiovascular and metabolic fitness (281). VEGF and related genes are obvious targets for in-depth exercise genetic studies.
Human muscle hypertrophy and regulatory genes
Regular exercise plays an important role in the maintenance of skeletal muscle tissue mass and quality, and this in turn has implications for muscle as an insulin target organ and a depot for glucose storage. Indeed, strength training appears effective at reversing muscle insulin resistance in type 2 diabetes patients, inducing molecular changes common to those observed with endurance exercise (123). Muscle hypertrophy, like the response of muscle to endurance training, is regulated by a complex series of partially redundant signaling molecules (78) including the mTORC1 complex. Molecular responses to acute resistance exercise appear to originate from cues within the muscle tissue (rather than in response to circulating factors) (368), and at some stage, muscle hypertrophy is limited by the availability of muscle satellite cells (236). Within the preexisting muscle, phosphorylation of the mTORC1 complex yields a signal transduction event resulting in ribosomal protein S6 kinase polypeptide 1 (S6K1) and eukaryotic translation initiation factor 4E (EIF4E) binding protein 1 (EIF4EBP1) phosphorylation, ultimately leading to enhanced protein synthesis through reduced inhibition of EIF4E. Direct inhibition of mTORC1 signaling in humans blocks the mixed-muscle protein synthesis induced by 110 muscle contractions at 70% of 1 repetition maximum (RM) (78). This acute intervention data would imply that genes regulating translation initiation signaling influence progressive skeletal muscle hypertrophy in response to resistance training.
It is critical to consider whether such acute events determine functional hypertrophy induced by chronic exercise training. Variation in hypertropy derived from supervised strength training in humans (19) allowed Mayhew and colleagues (187) to explore the causal relationship between acute mTORC1 signaling and the gains in muscle mass observed after 16 weeks of resistance training. Both protein synthesis and mTORC1-related signaling are elevated for 24 hours after acute resistance exercise, and regulation of S6K1 was found to correlate with increased myofiber size after 16 weeks of training (187) via prolonged autoinhibitory domain silencing. However, protein synthesis measured in response to an acute bout of unaccustomed exercise did not always agree with activation of the proposed causal signaling molecules, and indeed, acute synthesis was not predictive of chronic hypertrophy responses in a subset of subjects (187). Likewise, muscle anabolic responses to alternative stimuli, namely infused insulin and amino acids, does not relate in a linear manner to activation of mTORC1-regulated molecules (102), demonstrating that regulation of protein synthesis (and in this study also protein breakdown) is distributed across further unknown pathways. This is somewhat analogous to the observation that anabolic stimuli and hypertrophy of existing muscle fibers eventually appear limited by the further incorporation of nuclei from satellite cells (236), i.e., factors beyond the preexisting fibers add a new layer of regulation when one point of limitation is exceeded. Interactions between muscle protein metabolism and endurance exercise with cardiovascular conditioning point to numerous potentially relevant genes for exercise genomic and genetic studies. For example, genes from the pathways associated with insulin’s ability to regulate muscle protein synthesis and mTORC1-related signaling appear dependent on an intact vascular response to insulin, and thus a bout of endurance exercise can overcome aged-related insulin resistance defined as impaired protein synthesis (rather than impaired glucose uptake) (87).
Recently we demonstrated that in subjects most able to demonstrate a strong functional hypertrophy response to resistance training, selective modulation of miRNA expression occurs (67). In particular, we noted that in low responders to resistance training, miR-378, miR-29a, and miR-26a were all downregulated, while these were unchanged in high responders. Additional gene ontology analysis and mRNA profiling provided evidence that loss of expression of miR-378, miR-29a, and miR-26a appears to be compensatory. That is, miRNAs are negative regulators of protein expression, and these three miRNAs appear to target muscle growth-related pathways. Induction of marker genes for muscle adaptation was higher in the high responders, indicating that lack of activation of the protein-coding genes was paralleled by an attempt to remove inhibition of translation (67). This first example indicates that exploration of the role of noncoding RNA, in the control of muscle adaptation to resistance exercise, may prove fruitful. This is an area that holds great promise for exercise genetics research.
Traditionally, one thinks about endurance exercise as impairing protein synthesis and opposing muscle hypertrophy, yet clearly, if one adds the dimension of time and factors that respond to the metabolic demands of exercise (such as hormones) into the equation, a different conclusion may be reached. While we have demonstrated an unbiased ability to use functional genomics to identify genes that predict to a large extent cardiorespiratory adaptation from aerobic exercise (328), this remains to be attempted for muscle hypertrophy. The genes identified using such an approach are likely to represent the aspects of both positive and negative regulation of protein synthesis, the anatomical considerations that limit changes in myofibril size in humans, and factors yet to be considered by conventional research strategies. Recent discussions (117) have attempted to address whether there are synergies between the extreme modes of exercise imposed sequentially. Indeed, it would appear that if one imposes strength and endurance training on otherwise fit untrained or recreationally active subjects (120), then there is no obvious negative impact on training adaptation or performance for strength or endurance. The same may not be true for subjects that are highly adapted to the extremes of muscle performance (strength vs. endurance) (117). Yet as we have an incomplete picture of both the gene networks that determine aerobic adaptation and strength adaptation in the normal population, it would be premature (219) to assume that independent genes determine successful muscle adaptation to these different exercise paradigms.
We close this section with a general comment on TG mouse models. The development of the techniques for producing TG or KO mice has had a profound impact on biological research over the past 20 years. Examination of the original work indicates great care was taken to ensure that the expected change in DNA sequence was the only major genomic event (181, 324). There were early indications that epigenetic events such as changes in DNA methylation should be considered as a potential complication (154). Yet there was little evidence that consideration was given to the potential to disrupt transcriptional events related to the targeted gene. More recently, it has emerged that numerous KO models have been generated in a manner that inadvertently manipulates a miRNA, which can compromise the validity of an experiment (222). Thus one has to pause when considering the utility of TG and KO mouse strategies to establish cause-effect relationships in complex in vivo physiology. In addition to the common problem of the lack of evidence that the TG or KO has selectively manipulated a single gene, there is also the issue of strain-dependent effects. Rarely, if ever, do investigators report KO or TG results on a variety of genetic strains despite the fact that it is one of the major reasons why KO or TG phenotypes are often not reproducible across laboratories. Furthermore, rarely do investigators present or carry out an appropriate number of back-crossing experiments to ensure that they have genuine control animals for their physiological experiments. An even more basic argument against the current generalized reliance on TG or KO mice for the study of in vivo physiology is that rarely does a single gene control complex physiological systems. Genes work in complex nonlinear networks with built-in redundancy. The less than perfect reproducibility of TG and KO models across labs or strains is perhaps one of the strongest pieces of evidence for this point.
Functional genomics and integrated approaches
The majority of genes discussed above as examples of molecules involved with exercise adaptation, potentially mediating the health benefits thereafter, have been discovered using incremental research strategies and low-throughput technologies. Interpretation is often limited to associations between molecular change and the physiological intervention applied and relies heavily on preexisting cell and molecular data to ascribe function or infer causality. Systems biology technologies such as transcriptomics, proteomics, and metabolomics are being utilized to deliver a relatively unbiased global profile of how human genes behave under a variety of physiological conditions including exercise training (329). The primary aim of such studies is to yield a fingerprint that captures as much of the variance in gene expression as possible and then to use the data to infer new models of gene regulation. Most robust RNA expression technologies will give the RNA abundance for all of the transcribed genome. Metabolomics, when targeted to a subset of biochemical intermediates, appears to be promising for profiling specific areas of metabolism (290) and a useful phenotyping tool.
This section focuses on the use of global RNA-profiling technologies as tools for the derivation of new candidate genes for exercise genetics. It is important to point out that it is neither useful nor accurate to think of an RNA profile simply as a partially accurate surrogate for protein changes. This is true for at least two reasons: firstly, not all functional RNAs code for proteins (186); secondly, a coordinated list of mRNA abundances can lead to identification of protein binding motifs such that a large data set (‘gene set’) can be used to produce strong informatic and statistical evidence that a transcription event has occurred without encountering the technicalities of determining the protein in question. Furthermore, the function of a collection (network) of genes or molecules can be defined by how it predicts a system property (328), and thus the individual function of the network members (genes) will be largely context dependent. Indeed, rarely do single-gene manipulations ever yield a reproducible phenotype in vivo (52, 62), probably reflecting the intuitive idea that, in isolation, a single gene is typically not fully responsible for a complex in vivo phenotype.
Functional genomics is a broad term. For instance, one can manipulate gene function in a cell system (280) extending up to the use of phenotyping data to stratify gene expression or gene sequence data (327) in order to arrive at cause-effect hypotheses. How will functional genomics be applied to the study of exercise and health or exercise and performance? Recently we generated a genome-wide RNA expression signature from a tissue sample and used the information to predict who would respond to an exercise training program and who would not (328). By generating a mathematically derived composite score using ~30 of 50,000 RNA measurements, we could predict with a relatively high degree of accuracy who would produce the largest improvement in their aerobic capacity, independent of their baseline physiological profiles. In using this approach, it was not necessary to know or speculate on the biochemical and molecular function of these 30 transcripts. Rather, this is an example of using an unbiased functional genomics approach in humans to discover new knowledge and new targets for genetic studies.
In putting forward a general hypothesis of how skeletal muscle adapts to exercise training, it has been postulated several times (161, 282) that acute responses to training accumulate over time to allow the muscle phenotype to drift toward a slower oxidative type (in the case of endurance training). Many single-gene examples have been studied to attempt to support this concept. Critically, a selected group of genes is profiled using real-time qPCR, and thus a global perspective cannot be obtained. In contrast, the first human muscle study to profile the acute response of the transcriptome to acute endurance exercise (178) yielded an analysis indicating that acute molecular responses may largely reflect the acute energy and ionic homeostasis challenges of endurance exercise, rather than a pattern of change that represents an early phenocopy of chronic adaptation (143). That is, the majority of molecular responses do not appear to relate directly to skeletal muscle remodeling observed with long-term endurance training (251, 329). Comparisons have been made using microarray analysis of athletes versus nonathletes (cross-sectional analysis) (374); however, it is unclear whether they are informative of molecular processes responsible for training adaptation or whether they largely reflect genetic, epigenetic, or environmental differences incidental to the influence of training. Certainly the number of regulated genes is much lower in such cross-sectional analyses (312) than that observed when microarrays are used to study subjects before and after training (328, 329). For example, only 21 genes were apparently different between strength-trained and endurance-trained athletes (312), while 6 weeks of endurance training activates between 500 and 800 genes in sedentary subjects (328, 329), making the former estimate seem unreasonable.
Using comparative microarray analysis (329, 333) strategies, it has been possible to provide insight into muscle physiology and pathophysiology. For example, network analysis of the Mahoney et al. (178) acute responses to endurance exercise data set pinpointed a number of genes, such as nuclear factor of kappa light polypeptide gene enhancer in B-cells 1 (NFKB1), pyruvate dehydrogenase kinase, isozyme 4 (PDK4), VEGF, ERK1/2, and PPARGC1A, that appear within a gene network which is largely upregulated 3 hours postexercise (143) and had an ontological profile that represented cell-cycle events. Activation of NFKB with endurance exercise has been considered a paradox, in that continued activation can promote insulin resistance and muscle wasting, the opposite response being expected following endurance exercise (155). Nevertheless, when microarray data obtained from chronically adapted human skeletal muscle (329) was analyzed, we found clear evidence that NFKB1 may be regulating part of the muscle-remodeling process. This was despite little overlap found in either gene ontology groupings or individual genes between acute gene changes and those representative of chronically adapting tissue (143). While it has been noted that the expression of some of the acute exercise genes may well just vary with time and not be genuine exercise-related genes (353), some acute gene expression changes may be linked to chronic adaptation.
If one wishes to identify the likely signaling pathways responsible for regulating the physiological adaptation of skeletal muscle to endurance training, then one must first establish the gene sets that characterize the adapting muscle and then work back to the mediators likely to promote such changes in tissue phenotype. In a meta-analysis of a large-scale endurance training transcriptome (328, 329), integrin signaling, IGF growth factor signaling, and VEGF signaling (including CaMKII) were highlighted as central gene networks that were activated 24 hours after the final training session of a 6-week endurance training program (143). This relatively unbiased global analysis clearly pinpoints a number of candidate genes that were earlier proposed as being important endurance exercise genes, including calcium-related CaMK signaling (58), VEGF (105), and integrin-cytoskeletal signaling (381) using the candidate gene approach. Interestingly, cytoskeletal-related signaling involving integrins and focal adhesion kinase (381) is also thought to regulate insulin action in skeletal muscle. Thus there is reasonable evidence that these genes are conferring some or many of the positive gains in physiological function following endurance training.
A second strategy to better understand the link between molecular events and physiological adaptation directly from in vivo human data is to rely on the fact that, despite undergoing identical training programs, many humans do not improve their physiological capacity, performance, or insulin sensitivity (40, 322, 327, 357). Using a candidate gene approach (327), based on microarray data (329), we were able to demonstrate that VEGF-related gene activation occurred only in those subjects that also demonstrated a physiological improvement in their maximum aerobic capacity. Recently, we made further progress in generating a molecular predictor that forecasts who will be a low or high responder to endurance training (328). This was achieved using a pretraining global profile of more than 20,000 RNA molecules expressed in each subject’s muscle tissue. One group acted as a test group to generate a predictor set, and a second group acted as a blind validation group. This analysis not only yielded a tissue-based predictor, but is offering new opportunities to find underlying genetic variants that contribute to the extent of the training-induced response (214).
Improvements in glucose homeostasis following endurance training demonstrate substantial interindividual variability (44), so much so that some subjects appear to worsen their insulin sensitivity after 20 weeks of endurance cycle training. There is substantial data suggesting that the glucose transporter 4 (GLUT4) is central to regulating skeletal muscles’ ability to respond to insulin and take up glucose from the bloodstream (384). GLUT4 expression is in turn regulated by multiple signaling pathways that promote its expression following muscle contraction (203). It is also known that multiple types of exercise, including strength training, enhance muscle GLUT4 expression (123). Teran-Garcia and colleagues investigated the basis for such variation in a pilot study using microarrays (322). Using triplicates of RNA pooled from eight subjects that demonstrated no improvement in insulin action following 20 weeks of endurance training and comparing the array result with RNA derived from eight subjects that demonstrated a substantial increased in insulin sensitivity (an increase of more than 100%), they were able to pinpoint several genes that may help explain the nonresponder phenomenon. SKI, FHL1 (an integrin signaling molecule), and TTN were examples of genes found to be differentially regulated. Intriguingly, there were a number of genes already more abundant in the high responders (for improvements in insulin action) prior to training, including muscle development genes, and there is accumulating evidence that developmental factors may play a role in diabetes.
Further, recent GWASs have yielded many new type 2 diabetes candidate genes, albeit each with only a small effect on the disease variance. Yet they have provided an integrated interpretation of the highest ranked risk genes for type 2 diabetes, which points toward developmental genes playing a role (334). Thus, by stratifying subjects by their physiological characteristics, the application of systems biology tools, such as microarrays, can be used in a powerful way to inform about human physiology.
Finally, we conclude with a brief comment about the fundamental elements of a unifying hypothesis. When we consider which genes may confer greater or lesser ability to adapt to a physiological challenge such as endurance exercise, it is of great interest to identify the genes that play a central regulatory role. It has been argued that aerobic metabolism has partly shaped our genome and that the emergence of oxygen in the earth’s atmosphere has facilitated the rise in physiological complexity and capacity of living species (149). Koch and Britton have argued that the steep thermodynamic gradient of an oxygen environment was accommodating for the development of multicellular species. Thus it is of interest when examining the network of genes activated by aerobic exercise training to test the association between the genes that characterize adaptation to a higher maximal oxygen flux (consumption) and the DNA elements controlling these genes. In a recent informatics analysis of ~800 genes regulated in human skeletal muscle by aerobic exercise training(328), we were able to demonstrate that many of the overrepresented transcription factor binding sites on these genes are indeed regulated by transcription factors shown to be oxygen regulated in other contexts (144). For example, runt-related transcription factor 1 (RUNX1), paired box 3 (PAX3), and SRY-box 9 (SOX9) are involved with erythropoiesis (379) or sensing of oxygen tension (2) or are responsive to oxidative stress (57), all processes directly involving molecular oxygen. These observations suggest that, in the case of the complex physiological response to endurance exercise in humans, much of the transcriptome response reveals a link between DNA regulatory elements and molecular oxygen.
Promising research strategies and technologies
The pace of exercise genomics research was rather modest over the past few decades. However, there are strong indications that this has begun to change. One can now identify many laboratories that are engaged in exercise genomics. Very importantly, these laboratories collectively cover the whole range of experimental models and technologies. One can therefore expect significant advances in the next decade. We offer here brief comments on what we consider promising research strategies and technologies to ensure that exercise genomics attains prominence as a contributing science to exercise physiology.
Large-scale human studies
Exercise genomics would greatly benefit from the availability of large cohorts of individuals who have been phenotyped for appropriate exercise-related traits. If comprehensive panels of DNA markers were typed on these individuals, it would allow for the exploration of the whole genome, with the goal of identifying significant associations even when the effect sizes are rather small. Pooling the data from several cohorts would allow for even greater statistical power to detect loci with small effect sizes. Establishing such large cohorts in populations of Whites, African Americans, and other ancestries would also be useful for the definition of population heterogeneity. The greatest challenge is to develop such resources for exercise genomic studies of the response to regular exercise, as the compliance with the exercise regimen needs to be of the highest quality for this type of research to be successful.
Genetic and physiological stratification
By now, it is fully recognized that there are large interindividual differences in the ability of humans to physiologically respond to exercise training. Pinpointing the genes that associate with adaptability, using a variety of omics technologies—genomics, transcriptomics, proteomics, and metabolomics—can provide additional support to existing genetic associations and illuminate the fundamental mechanisms driving this heterogeneity. Furthermore, by contrasting the molecular response of various tissues, in high- and low-responder humans (for the physiological trait in question), one can map out even the genes with small effect size that associate with adaptation. This is subtly different from the majority of existing physiological studies, where a molecule is profiled and the average response reported.
Selective breeding for exercise genomics traits
Following in the footsteps of the breeding experiments undertaken by Britton and Koch, more breeding studies should be performed. There are many traits in the sedentary state and in response to an exercise training regimen that would benefit greatly from the information generated by appropriate rodent crosses and deliberate breeding designs, with the goal of selecting for a trait of interest. The information derived from such elaborate experiments would shed light on molecular and physiological mechanisms and eventually inform exercise genomic studies.
Validation of genes and variants
Human exercise genomics can generate new gene targets that are at times difficult to further validate in human studies. This is where the vast experience of exercise physiologists and biochemists who have devoted their career to in vitro studies or animal experimentation would constitute a great asset. Validating a new gene target and defining the contributions of specific alleles generally require in silico studies, cell-based investigations with variable levels of expression of the targeted gene, exercise studies in informative strains of rodents, generation of TG or knockdown mice for relevant exercise experiments, selective breeding for the level of expression of the targeted gene, etc.
Exome sequencing
While affordable whole-genome sequencing is still a few years away, investigators are already taking advantage of the next-generation sequencing technology on a genome-wide scale by targeting coding regions of the genome (exome sequencing). The first step of the exome sequencing is enrichment of the target regions in DNA samples using either an array-based or liquid-phase system. The latest enrichment system captures about 50 Mb of DNA sequence. The enriched DNA samples are then used to prepare libraries for massively parallel DNA sequencing. The advantage of the exome sequencing is that it allows identification of both rare and common sequence variants in the coding regions, thereby increasing the likelihood that the variants are functionally relevant. However, the approach will miss those functional variants that affect regulatory elements and domains outside the coding region. Exome sequencing has been used successfully to identify causal mutations for rare Mendelian diseases [e.g., (212, 267)], as well as genes contributing to adaptation to high altitude (378).
Copy number variation
Most of the GWASs with DNA sequence variants have focused on SNPs. However, it has become clear that we also have to take into account structural variants, such as small insertions and deletions, CNVs, and balanced rearrangements (e.g., inversions and translocations), to fully account for the contribution of DNA sequence variation to the genetic architecture of common complex traits. CNVs encompass deletions, insertions, and duplications that range in size from a few thousand to several millions base pairs. So far, CNVs have been reported to be associated with developmental and neuropsychiatric disorders (183, 194, 360), while their contribution to more common diseases is still unclear (66).
Common and rare variants
A longstanding debate in human genetics has been whether the genetic architecture of common complex traits is attributable to common or rare DNA sequence variants. The common disease–common variant hypothesis states that the disease or trait is affected by several common DNA variants, each having a fairly minor effect on the trait, while the common disease–multiple rare variants hypothesis proposes that a large number of rare, but relatively high-impact, variants are contributing to disease/trait variance. Examples supporting both hypotheses can be found in the literature. However, the fact that common SNPs found to be associated with common diseases in the GWASs do not fully explain the trait heritability has renewed the interest in the rare variant hypothesis. Some studies also suggest that both hypotheses may apply to common diseases and that some of the common SNPs identified by GWASs may actually tag a synthenic effect of multiple rare variants, some of which may be located quite far from the tagSNP (77, 362). These observations provide a completely novel way to reevaluate the existing GWAS data, and it is clear that the next-generation sequencing techniques provide valuable tools to fully explore the rare variant hypothesis in adequate detail. Exercise genomics needs to take advantage of this new capability.
Conclusion
This chapter provides the most comprehensive review of exercise genomics and exercise genetics since the 1997 publication of the volume titled Genetics of Fitness and Physical Performance by C. Bouchard, RM Malina and L. Perusse (38). It complements the 2011 book edited by C, Bouchard and E. Hoffman, titled Genetic and Molecular Aspect of Sports Performance, in the Blackwell-Wiley series published under the aegis of the International Olympic Committee (35). Although the current contribution is comprehensive, it does not attempt to be exhaustive. Rather, the focus is on the areas of research and findings that are of particular interest to the physiologist with an interest in exercise biology. There is strong or highly suggestive evidence, depending on the trait, from genetic epidemiology studies that DNA sequence heterogeneity plays an important role in human variation in exercise behavior, cardiorespiratory fitness in the untrained state, cardiovascular and metabolic adaptation to acute exercise, and responsiveness to regular exercise. Methodological and technological advances of the past two decades have made it possible to undertake the molecular dissection of the genetic component of complex, multifactorial traits, such as those of interest to exercise physiologists, in terms of tissue-specific transcripts expression profile, genes, and allelic variants. This chapter reviews the evidence from animal models and human studies. It integrates data on candidate genes, genome-wide linkage results, GWA findings, expression arrays, and combinations of these approaches.
A common weakness of the early human exercise genomic studies was that they were based on small sample sizes and thus were grossly underpowered. This has been recognized as a major issue to be resolved going forward (258). Likewise, combining transcriptomic and genomic technologies has been shown to be more powerful in some recent studies. In one particular case, it yielded a much more powerful molecular predictor of the ability to increase VO2max than had been available until recently (328).
The proper positioning of physical activity as a behavior and physiological fitness as a state in contemporary public health policies requires that that the role of human individuality be recognized and that the influence of DNA sequence differences be understood. Similarly, future progress regarding the use of exercise in therapeutic medicine will depend to a large extent on our ability to identify the favorable responders for given physiological properties to a given exercise regimen. These critical milestones will be achieved only through more and better exercise genomics and genetics research.
Acknowledgments
C. Bouchard and T. Rankinen are supported by NIH (HL-45670) and by institutional funds from the Pennington Biomedical Research Center. J. Timmons is partially funded by a Welcome Value in People Award and by HEFC. C. Bouchard is partially funded by the John W. Barton Sr. Chair in Genetics and Nutrition.
References
- 1.Abecasis GR, Cardon LR, Cookson WO. A general test of association for quantitative traits in nuclear families. Am J Hum Genet. 2000;66:279–292. doi: 10.1086/302698. [DOI] [PMC free article] [PubMed] [Google Scholar]
- 2.Adesida AB, Grady LM, Khan WS, Millward-Sadler SJ, Salter DM, Hardingham TE. Human meniscus cells express hypoxia inducible factor-1alpha and increased SOX9 in response to low oxygen tension in cell aggregate culture. Arthritis Res Ther. 2007;9:R69. doi: 10.1186/ar2267. [DOI] [PMC free article] [PubMed] [Google Scholar]
- 3.Ahmetov, Druzhevskaya AM, Astratenkova IV, Popov DV, Vinogradova OL, Rogozkin VA. The ACTN3 R577X polymorphism in Russian endurance athletes. Br J Sports Med. 2010;44:649–652. doi: 10.1136/bjsm.2008.051540. [DOI] [PubMed] [Google Scholar]
- 4.Akaike H. A new look at the statistical model identification. IEEE Trans Automat Control. 1974;19:716–723. [Google Scholar]
- 5.Akimoto T, Pohnert SC, Li P, Zhang M, Gumbs C, Rosenberg PB, Williams RS, Yan Z. Exercise stimulates Pgc-1alpha transcription in skeletal muscle through activation of the p38 MAPK pathway. J Biol Chem. 2005;280:19587–19593. doi: 10.1074/jbc.M408862200. [DOI] [PubMed] [Google Scholar]
- 6.Almasy L, Blangero J. Contemporary model-free methods for linkage analysis. Adv Genet. 2008;60:175–193. doi: 10.1016/S0065-2660(07)00408-7. [DOI] [PubMed] [Google Scholar]
- 7.Ameln H, Gustafsson T, Sundberg CJ, Okamoto K, Jansson E, Poellinger L, Makino Y. Physiological activation of hypoxia inducible factor-1 in human skeletal muscle. FASEB J. 2005;19:1009–1011. doi: 10.1096/fj.04-2304fje. [DOI] [PubMed] [Google Scholar]
- 8.An P, Borecki IB, Rankinen T, Perusse L, Leon AS, Skinner JS, Wilmore JH, Bouchard C, Rao DC. Evidence of major genes for exercise heart rate and blood pressure at baseline and in response to 20 weeks of endurance training: the HERITAGE family study. Int J Sports Med. 2003;24:492–498. doi: 10.1055/s-2003-42011. [DOI] [PubMed] [Google Scholar]
- 9.An P, Perusse L, Rankinen T, Borecki IB, Gagnon J, Leon AS, Skinner JS, Wilmore JH, Bouchard C, Rao DC. Familial aggregation of exercise heart rate and blood pressure in response to 20 weeks of endurance training: the HERITAGE family study. Int J Sports Med. 2003;24:57–62. doi: 10.1055/s-2003-37200. [DOI] [PubMed] [Google Scholar]
- 10.An P, Rice T, Gagnon J, Leon AS, Skinner JS, Bouchard C, Rao DC, Wilmore JH. Familial aggregation of stroke volume and cardiac output during submaximal exercise: the HERITAGE Family Study. Int J Sports Med. 2000;21:566–572. doi: 10.1055/s-2000-12983. [DOI] [PubMed] [Google Scholar]
- 11.Andreu AL, Bruno C, Dunne TC, Tanji K, Shanske S, Sue CM, Krishna S, Hadjigeorgiou GM, Shtilbans A, Bonilla E, DiMauro S. A nonsense mutation (G15059A) in the cytochrome b gene in a patient with exercise intolerance and myoglobinuria. Ann Neurol. 1999;45:127–130. doi: 10.1002/1531-8249(199901)45:1<127::aid-art20>3.0.co;2-y. [DOI] [PubMed] [Google Scholar]
- 12.Andreu AL, Bruno C, Shanske S, Shtilbans A, Hirano M, Krishna S, Hayward L, Systrom DS, Brown RH, DiMauro S. Missense mutation in the mtDNA cytochrome b gene in a patient with myopathy. Neurology. 1998;51:1444–1447. doi: 10.1212/wnl.51.5.1444. [DOI] [PubMed] [Google Scholar]
- 13.Andreu AL, Hanna MG, Reichmann H, Bruno C, Penn AS, Tanji K, Pallotti F, Iwata S, Bonilla E, Lach B, Morgan-Hughes J, DiMauro S. Exercise intolerance due to mutations in the cytochrome b gene of mitochondrial DNA. N Engl J Med. 1999;341:1037–1044. doi: 10.1056/NEJM199909303411404. [DOI] [PubMed] [Google Scholar]
- 14.Andreu AL, Tanji K, Bruno C, Hadjigeorgiou GM, Sue CM, Jay C, Ohnishi T, Shanske S, Bonilla E, DiMauro S. Exercise intolerance due to a nonsense mutation in the mtDNA ND4 gene. Ann Neurol. 1999;45:820–823. doi: 10.1002/1531-8249(199906)45:6<820::aid-ana22>3.0.co;2-w. [DOI] [PubMed] [Google Scholar]
- 15.Annex BH, Torgan CE, Lin P, Taylor DA, Thompson MA, Peters KG, Kraus WE. Induction and maintenance of increased VEGF protein by chronic motor nerve stimulation in skeletal muscle. Am J Physiol. 1998;274:H860–H867. doi: 10.1152/ajpheart.1998.274.3.H860. [DOI] [PubMed] [Google Scholar]
- 16.Argyropoulos G, Stutz AM, Ilnytska O, Rice T, Teran-Garcia M, Rao DC, Bouchard C, Rankinen T. KIF5B gene sequence variation and response of cardiac stroke volume to regular exercise. Physiol Genomics. 2009;36:79–88. doi: 10.1152/physiolgenomics.00003.2008. [DOI] [PMC free article] [PubMed] [Google Scholar]
- 17.Astrand A, Bohlooly YM, Larsdotter S, Mahlapuu M, Andersen H, Tornell J, Ohlsson C, Snaith M, Morgan DG. Mice lacking melanin-concentrating hormone receptor 1 demonstrate increased heart rate associated with altered autonomic activity. Am J Physiol Regul Integr Comp Physiol. 2004;287:R749–R758. doi: 10.1152/ajpregu.00134.2004. [DOI] [PubMed] [Google Scholar]
- 18.Babraj JA, Vollaard NB, Keast C, Guppy FM, Cottrell G, Timmons JA. Extremely short duration high intensity interval training substantially improves insulin action in young healthy males. BMC Endocr Disord. 2009;9:3. doi: 10.1186/1472-6823-9-3. [DOI] [PMC free article] [PubMed] [Google Scholar]
- 19.Bamman MM, Petrella JK, Kim JS, Mayhew DL, Cross JM. Cluster analysis tests the importance of myogenic gene expression during myofiber hypertrophy in humans. J Appl Physiol. 2007;102:2232–2239. doi: 10.1152/japplphysiol.00024.2007. [DOI] [PubMed] [Google Scholar]
- 20.Barbato JC, Koch LG, Darvish A, Cicila GT, Metting PJ, Britton SL. Spectrum of aerobic endurance running performance in eleven inbred strains of rats. J Appl Physiol. 1998;85:530–536. doi: 10.1152/jappl.1998.85.2.530. [DOI] [PubMed] [Google Scholar]
- 21.Bengtsson J, Gustafsson T, Widegren U, Jansson E, Sundberg CJ. Mitochondrial transcription factor A and respiratory complex IV increase in response to exercise training in humans. Pflugers Arch. 2001;443:61–66. doi: 10.1007/s004240100628. [DOI] [PubMed] [Google Scholar]
- 22.Beunen G, Thomis M. Gene powered? Where to go from heritability (h2) in muscle strength and power? Exerc Sport Sci Rev. 2004;32:148–154. doi: 10.1097/00003677-200410000-00005. [DOI] [PubMed] [Google Scholar]
- 23.Beunen G, Thomis M. Genetics of strength and power characteristics in children and adolescents. Pediatr Exerc Sci. 2003;15:128–138. [Google Scholar]
- 24.Bielen E, Fagard R, Amery A. The inheritance of left ventricular structure and function assessed by imaging and Doppler echocardiography. Am Heart J. 1991;121:1743–1749. doi: 10.1016/0002-8703(91)90021-9. [DOI] [PubMed] [Google Scholar]
- 25.Bielen EC, Fagard RH, Amery AK. Inheritance of acute cardiac changes during bicycle exercise: an echocardiographic study in twins. Med Sci Sports Exerc. 1991;23:1254–1259. [PubMed] [Google Scholar]
- 26.Blakely EL, Mitchell AL, Fisher N, Meunier B, Nijtmans LG, Schaefer AM, Jackson MJ, Turnbull DM, Taylor RW. A mitochondrial cytochrome b mutation causing severe respiratory chain enzyme deficiency in humans and yeast. FEBS J. 2005;272:3583–3592. doi: 10.1111/j.1742-4658.2005.04779.x. [DOI] [PubMed] [Google Scholar]
- 27.Bonnefont JP, Demaugre F, Prip-Buus C, Saudubray JM, Brivet M, Abadi N, Thuillier L. Carnitine palmitoyltransferase deficiencies. Mol Genet Metab. 1999;68:424–440. doi: 10.1006/mgme.1999.2938. [DOI] [PubMed] [Google Scholar]
- 28.Booth FW, Lees S. Fundamental questions about genes, inactivity, and chronic diseases. Physiol Genomics. 2006;17:146–157. doi: 10.1152/physiolgenomics.00174.2006. [DOI] [PubMed] [Google Scholar]
- 29.Bortot B, Barbi E, Biffi S, Angelini C, Faleschini E, Severini GM, Carrozzi M. Two novel cosegregating mutations in tRNAMet and COX III, in a patient with exercise intolerance and autoimmune polyendocrinopathy. Mitochondrion. 2009;9:123–129. doi: 10.1016/j.mito.2009.01.006. [DOI] [PubMed] [Google Scholar]
- 30.Bouchard C. Human adaptability may have a genetic basis. In: Landry F, editor. Health Risk Estimation, Risk Reduction and Health Promotion: Proceedings of the 18th Annual Meeting of the Society of Prospective Medicine. Ottowa: Canadian Public Health Association; 1983. pp. 463–476. [Google Scholar]
- 31.Bouchard C. Individual differences in the response to regular exercise. Int J Obes Relat Metab Disord. 1995;19 (Suppl 4):S5–S8. [PubMed] [Google Scholar]
- 32.Bouchard C, An P, Rice T, Skinner JS, Wilmore JH, Gagnon J, Perusse L, Leon AS, Rao DC. Familial aggregation of VO(2max) response to exercise training: results from the HERITAGE Family Study. J Appl Physiol. 1999;87:1003–1008. doi: 10.1152/jappl.1999.87.3.1003. [DOI] [PubMed] [Google Scholar]
- 33.Bouchard C, Daw EW, Rice T, Perusse L, Gagnon J, Province MA, Leon AS, Rao DC, Skinner JS, Wilmore JH. Familial resemblance for VO2max in the sedentary state: the HERITAGE family study. Med Sci Sports Exerc. 1998;30:252–258. doi: 10.1097/00005768-199802000-00013. [DOI] [PubMed] [Google Scholar]
- 34.Bouchard C, Dionne FT, Simoneau JA, Boulay MR. Genetics of aerobic and anaerobic performances. Exerc Sport Sci Rev. 1992;20:27–58. [PubMed] [Google Scholar]
- 35.Bouchard C, Hoffman EP, editors. Genetic and Molecular Aspects of Sports Performance. West Sussex, UK: International Olympic Committee/Blackwell Publishing Ltd; 2011. [Google Scholar]
- 36.Bouchard C, Lesage R, Lortie G, Simoneau JA, Hamel P, Boulay MR, Perusse L, Theriault G, Leblanc C. Aerobic performance in brothers, dizygotic and monozygotic twins. Med Sci Sports Exerc. 1986;18:639–646. [PubMed] [Google Scholar]
- 37.Bouchard C, Lortie G, Simoneau JA, Leblanc C, Theriault G, Tremblay A. Submaximal power output in adopted and biological siblings. Ann Hum Biol. 1984;11:303–309. doi: 10.1080/03014468400007201. [DOI] [PubMed] [Google Scholar]
- 38.Bouchard C, Malina RM, Perusse L. Genetics of Fitness and Physical Performance. Champaign, IL: Human Kinetics; 1997. [Google Scholar]
- 39.Bouchard C, Rankinen T. Genetic determinants of physical performance. In: Maughan RJ, editor. Olympic Textbook of Science in Sport. Hoboken, NJ: Wiley-Blackwell; 2009. pp. 181–201. [Google Scholar]
- 40.Bouchard C, Rankinen T. Individual differences in response to regular physical activity. Med Sci Sports Exerc. 2001;33:S446–S451. doi: 10.1097/00005768-200106001-00013. discussion S452–S453. [DOI] [PubMed] [Google Scholar]
- 41.Bouchard C, Rankinen T, Chagnon YC, Rice T, Perusse L, Gagnon J, Borecki I, An P, Leon AS, Skinner JS, Wilmore JH, Province M, Rao DC. Genomic scan for maximal oxygen uptake and its response to training in the HERITAGE Family Study. J Appl Physiol. 2000;88:551–559. doi: 10.1152/jappl.2000.88.2.551. [DOI] [PubMed] [Google Scholar]
- 42.Bouchard C, Simoneau JA, Lortie G, Boulay MR, Marcotte M, Thibault MC. Genetic effects in human skeletal muscle fiber type distribution and enzyme activities. Can J Physiol Pharmacol. 1986;64:1245–1251. doi: 10.1139/y86-210. [DOI] [PubMed] [Google Scholar]
- 43.Bouchard C, Wolfarth B, Rivera MA, Gagnon J, Simoneau JA. Genetic determinants of endurance performance. In: Shephard RJ, Astrand P-O, editors. Endurance in Sport. London, UK: Blackwell Science Ltd; 2000. pp. 223–242. [Google Scholar]
- 44.Boule NG, Weisnagel SJ, Lakka TA, Tremblay A, Bergman RN, Rankinen T, Leon AS, Skinner JS, Wilmore JH, Rao DC, Bouchard C. Effects of exercise training on glucose homeostasis: the HERITAGE Family Study. Diabetes Care. 2005;28:108–114. doi: 10.2337/diacare.28.1.108. [DOI] [PubMed] [Google Scholar]
- 45.Bray MS, Hagberg JM, Perusse L, Rankinen T, Roth SM, Wolfarth B, Bouchard C. The human gene map for performance and health-related fitness phenotypes: the 2006–2007 update. Med Sci Sports Exerc. 2009;41:35–73. doi: 10.1249/mss.0b013e3181844179. [DOI] [PubMed] [Google Scholar]
- 46.Breen EC, Johnson EC, Wagner H, Tseng HM, Sung LA, Wagner PD. Angiogenic growth factor mRNA responses in muscle to a single bout of exercise. J Appl Physiol. 1996;81:355–361. doi: 10.1152/jappl.1996.81.1.355. [DOI] [PubMed] [Google Scholar]
- 47.Bruno C, Manfredi G, Andreu AL, Shanske S, Krishna S, Ilse WK, DiMauro S. A splice junction mutation in the alpha(M) gene of phosphorylase kinase in a patient with myopathy. Biochem Biophys Res Commun. 1998;249:648–651. doi: 10.1006/bbrc.1998.9211. [DOI] [PubMed] [Google Scholar]
- 48.Bruno C, Santorelli FM, Assereto S, Tonoli E, Tessa A, Traverso M, Scapolan S, Bado M, Tedeschi S, Minetti C. Progressive exercise intolerance associated with a new muscle-restricted nonsense mutation (G142X) in the mitochondrial cytochrome b gene. Muscle Nerve. 2003;28:508–511. doi: 10.1002/mus.10429. [DOI] [PubMed] [Google Scholar]
- 49.Burgomaster KA, Howarth KR, Phillips SM, Rakobowchuk M, Macdonald MJ, McGee SL, Gibala MJ. Similar metabolic adaptations during exercise after low volume sprint interval and traditional endurance training in humans. J Physiol. 2008;586:151–160. doi: 10.1113/jphysiol.2007.142109. [DOI] [PMC free article] [PubMed] [Google Scholar]
- 50.Burgomaster KA, Hughes SC, Heigenhauser GJ, Bradwell SN, Gibala MJ. Six sessions of sprint interval training increases muscle oxidative potential and cycle endurance capacity in humans. J Appl Physiol. 2005;98:1985–1990. doi: 10.1152/japplphysiol.01095.2004. [DOI] [PubMed] [Google Scholar]
- 51.Cai G, Cole SA, Butte N, Bacino C, Diego V, Tan K, Goring HH, O’Rahilly S, Farooqi IS, Comuzzie AG. A quantitative trait locus on chromosome 18q for physical activity and dietary intake in Hispanic children. Obesity. 2006;14:1596–1604. doi: 10.1038/oby.2006.184. [DOI] [PubMed] [Google Scholar]
- 52.Calvo JA, Daniels TG, Wang X, Paul A, Lin J, Spiegelman BM, Stevenson SC, Rangwala SM. Muscle-specific expression of PPARgamma coactivator-1alpha improves exercise performance and increases peak oxygen uptake. J Appl Physiol. 2008;104:1304–1312. doi: 10.1152/japplphysiol.01231.2007. [DOI] [PubMed] [Google Scholar]
- 53.Campos Y, Bautista J, Gutierrez-Rivas E, Chinchon D, Cabello A, Segura D, Arenas J. Clinical heterogeneity in two pedigrees with the 3243 bp tRNA(Leu(UUR)) mutation of mitochondrial DNA. Acta Neurol Scand. 1995;91:62–65. doi: 10.1111/j.1600-0404.1995.tb05845.x. [DOI] [PubMed] [Google Scholar]
- 54.Campos Y, Garcia A, Lopez A, Jimenez S, Rubio JC, Del Hoyo P, Bustos F, Martin MA, Cabello A, Ricoy JR, Arenas J. Cosegregation of the mitochondrial DNA A1555G and G4309A mutations results in deafness and mitochondrial myopathy. Muscle Nerve. 2002;25:185–188. doi: 10.1002/mus.10012. [DOI] [PubMed] [Google Scholar]
- 55.Cardon LR, Fulker DW, Joreskog KG. A LISREL 8 model with constrained parameters for twin and adoptive families. Behav Genet. 1991;21:327–350. doi: 10.1007/BF01065971. [DOI] [PubMed] [Google Scholar]
- 56.Cartegni L, Chew SL, Krainer AR. Listening to silence and understanding nonsense: exonic mutations that affect splicing. Nat Rev Genet. 2002;3:285–298. doi: 10.1038/nrg775. [DOI] [PubMed] [Google Scholar]
- 57.Chang TI, Horal M, Jain SK, Wang F, Patel R, Loeken MR. Oxidant regulation of gene expression and neural tube development: Insights gained from diabetic pregnancy on molecular causes of neural tube defects. Diabetologia. 2003;46:538–545. doi: 10.1007/s00125-003-1063-2. [DOI] [PubMed] [Google Scholar]
- 58.Chin ER. Role of Ca2+/calmodulin-dependent kinases in skeletal muscle plasticity. J Appl Physiol. 2005;99:414–423. doi: 10.1152/japplphysiol.00015.2005. [DOI] [PubMed] [Google Scholar]
- 59.Chin ER, Grange RW, Viau F, Simard AR, Humphries C, Shelton J, Bassel-Duby R, Williams RS, Michel RN. Alterations in slow-twitch muscle phenotype in transgenic mice overexpressing the Ca2+ buffering protein parvalbumin. J Physiol. 2003;547:649–663. doi: 10.1113/jphysiol.2002.024760. [DOI] [PMC free article] [PubMed] [Google Scholar]
- 60.Chin ER, Olson EN, Richardson JA, Yang Q, Humphries C, Shelton JM, Wu H, Zhu W, Bassel-Duby R, Williams RS. A calcineurin-dependent transcriptional pathway controls skeletal muscle fiber type. Genes Dev. 1998;12:2499–2509. doi: 10.1101/gad.12.16.2499. [DOI] [PMC free article] [PubMed] [Google Scholar]
- 61.Choh AC, Demerath EW, Lee M, Williams KD, Towne B, Siervogel RM, Cole SA, Czerwinski SA. Genetic analysis of self-reported physical activity and adiposity: the Southwest Ohio Family Study. Public Health Nutr. 2009;12:1052–1060. doi: 10.1017/S1368980008003583. [DOI] [PMC free article] [PubMed] [Google Scholar]
- 62.Choi CS, Befroy DE, Codella R, Kim S, Reznick RM, Hwang YJ, Liu ZX, Lee HY, Distefano A, Samuel VT, Zhang D, Cline GW, Handschin C, Lin J, Petersen KF, Spiegelman BM, Shulman GI. Paradoxical effects of increased expression of PGC-1alpha on muscle mitochondrial function and insulin-stimulated muscle glucose metabolism. Proc Natl Acad Sci U S A. 2008;105:19926–19931. doi: 10.1073/pnas.0810339105. [DOI] [PMC free article] [PubMed] [Google Scholar]
- 63.Clarkson PM, Devaney JM, Gordish-Dressman H, Thompson PD, Hubal MJ, Urso M, Price TB, Angelopoulos TJ, Gordon PM, Moyna NM, Pescatello LS, Visich PS, Zoeller RF, Seip RL, Hoffman EP. ACTN3 genotype is associated with increases in muscle strength in response to resistance training in women. J Appl Physiol. 2005;99:154–163. doi: 10.1152/japplphysiol.01139.2004. [DOI] [PubMed] [Google Scholar]
- 64.Comi GP, Fortunato F, Lucchiari S, Bordoni A, Prelle A, Jann S, Keller A, Ciscato P, Galbiati S, Chiveri L, Torrente Y, Scarlato G, Bresolin N. Beta-enolase deficiency, a new metabolic myopathy of distal glycolysis. Ann Neurol. 2001;50:202–207. doi: 10.1002/ana.1095. [DOI] [PubMed] [Google Scholar]
- 65.Conne B, Stutz A, Vassalli JD. The 3′ untranslated region of messenger RNA: A molecular ‘hotspot’ for pathology? Nat Med. 2000;6:637–641. doi: 10.1038/76211. [DOI] [PubMed] [Google Scholar]
- 66.Craddock N, Hurles ME, Cardin N, Pearson RD, Plagnol V, Robson S, Vukcevic D, Barnes C, Conrad DF, Giannoulatou E, Holmes C, Marchini JL, Stirrups K, Tobin MD, Wain LV, Yau C, Aerts J, Ahmad T, Andrews TD, Arbury H, Attwood A, Auton A, Ball SG, Balmforth AJ, Barrett JC, Barroso I, Barton A, Bennett AJ, Bhaskar S, Blaszczyk K, Bowes J, Brand OJ, Braund PS, Bredin F, Breen G, Brown MJ, Bruce IN, Bull J, Burren OS, Burton J, Byrnes J, Caesar S, Clee CM, Coffey AJ, Connell JM, Cooper JD, Dominiczak AF, Downes K, Drummond HE, Dudakia D, Dunham A, Ebbs B, Eccles D, Edkins S, Edwards C, Elliot A, Emery P, Evans DM, Evans G, Eyre S, Farmer A, Ferrier IN, Feuk L, Fitzgerald T, Flynn E, Forbes A, Forty L, Franklyn JA, Freathy RM, Gibbs P, Gilbert P, Gokumen O, Gordon-Smith K, Gray E, Green E, Groves CJ, Grozeva D, Gwilliam R, Hall A, Hammond N, Hardy M, Harrison P, Hassanali N, Hebaishi H, Hines S, Hinks A, Hitman GA, Hocking L, Howard E, Howard P, Howson JM, Hughes D, Hunt S, Isaacs JD, Jain M, Jewell DP, Johnson T, Jolley JD, Jones IR, Jones LA, Kirov G, Langford CF, Lango-Allen H, Lathrop GM, Lee J, Lee KL, Lees C, Lewis K, Lindgren CM, Maisuria-Armer M, Maller J, Mansfield J, Martin P, Massey DC, McArdle WL, McGuffin P, McLay KE, Mentzer A, Mimmack ML, Morgan AE, Morris AP, Mowat C, Myers S, Newman W, Nimmo ER, O’Donovan MC, Onipinla A, Onyiah I, Ovington NR, Owen MJ, Palin K, Parnell K, Pernet D, Perry JR, Phillips A, Pinto D, Prescott NJ, Prokopenko I, Quail MA, Rafelt S, Rayner NW, Redon R, Reid DM, Renwick, Ring SM, Robertson N, Russell E, St Clair D, Sambrook JG, Sanderson JD, Schuilenburg H, Scott CE, Scott R, Seal S, Shaw-Hawkins S, Shields BM, Simmonds MJ, Smyth DJ, Somaskantharajah E, Spanova K, Steer S, Stephens J, Stevens HE, Stone MA, Su Z, Symmons DP, Thompson JR, Thomson W, Travers ME, Turnbull C, Valsesia A, Walker M, Walker NM, Wallace C, Warren-Perry M, Watkins NA, Webster J, Weedon MN, Wilson AG, Woodburn M, Wordsworth BP, Young AH, Zeggini E, Carter NP, Frayling TM, Lee C, McVean G, Munroe PB, Palotie A, Sawcer SJ, Scherer SW, Strachan DP, Tyler-Smith C, Brown MA, Burton PR, Caulfield MJ, Compston A, Farrall M, Gough SC, Hall AS, Hattersley AT, Hill AV, Mathew CG, Pembrey M, Satsangi J, Stratton MR, Worthington J, Deloukas P, Duncanson A, Kwiatkowski DP, McCarthy MI, Ouwehand W, Parkes M, Rahman N, Todd JA, Samani NJ, Donnelly P. Genome-wide association study of CNVs in 16,000 cases of eight common diseases and 3,000 shared controls. Nature. 2010;464:713–720. doi: 10.1038/nature08979. [DOI] [PMC free article] [PubMed] [Google Scholar]
- 67.Davidsen PK, Gallagher IJ, Hartman JW, Tarnopolsky MA, Dela F, Helge JW, Timmons JA, Phillips SM. High responders to resistance exercise training demonstrate differential regulation of skeletal muscle microRNA expression. J Appl Physiol. 2010 doi: 10.1152/japplphysiol.00901.2010. Under revision. [DOI] [PubMed] [Google Scholar]
- 68.De Mars G, Windelinckx A, Huygens W, Peeters MW, Beunen GP, Aerssens J, Vlietinck R, Thomis MA. Genome-wide linkage scan for contraction velocity characteristics of knee musculature in the Leuven Genes for Muscular Strength Study. Physiol Genomics. 2008;35:36–44. doi: 10.1152/physiolgenomics.90252.2008. [DOI] [PMC free article] [PubMed] [Google Scholar]
- 69.De Mars G, Windelinckx A, Huygens W, Peeters MW, Beunen GP, Aerssens J, Vlietinck R, Thomis MA. Genome-wide linkage scan for maximum and length-dependent knee muscle strength in young men: significant evidence for linkage at chromosome 14q24.3. J Med Genet. 2008;45:275–283. doi: 10.1136/jmg.2007.055277. [DOI] [PMC free article] [PubMed] [Google Scholar]
- 70.De Moor MH, Liu YJ, Boomsma DI, Li J, Hamilton JJ, Hottenga JJ, Levy S, Liu XG, Pei YF, Posthuma D, Recker RR, Sullivan PF, Wang L, Willemsen G, Yan H, De Geus EJC, Deng HW. Genome-wide association study of exercise behavior in Dutch and American adults. Med Sci Sports Exerc. 2009;41:1887–1895. doi: 10.1249/MSS.0b013e3181a2f646. [DOI] [PMC free article] [PubMed] [Google Scholar]
- 71.De Moor MH, Posthuma D, Hottenga JJ, Willemsen G, Boomsma DI, De Geus EJ. Genome-wide linkage scan for exercise participation in Dutch sibling pairs. Eur J Hum Genet. 2007;15:1252–1259. doi: 10.1038/sj.ejhg.5201907. [DOI] [PubMed] [Google Scholar]
- 72.De Moor MH, Spector TD, Cherkas LF, Falchi M, Hottenga JJ, Boomsma DI, De Geus EJ. Genome-wide linkage scan for athlete status in 700 British female DZ twin pairs. Twin Res Hum Genet. 2007;10:812–820. doi: 10.1375/twin.10.6.812. [DOI] [PubMed] [Google Scholar]
- 73.De Moor MH, Stubbe JH, Boomsma DI, De Geus EJ. Exercise participation and self-rated health: do common genes explain the association? Eur J Epidemiol. 2007;22:27–32. doi: 10.1007/s10654-006-9088-8. [DOI] [PubMed] [Google Scholar]
- 74.Defoor J, Martens K, Zielinska D, Matthijs G, Van Nerum H, Schepers D, Fagard R, Vanhees L. The CAREGENE study: polymorphisms of the beta1-adrenoceptor gene and aerobic power in coronary artery disease. Eur Heart J. 2006;27:808–816. doi: 10.1093/eurheartj/ehi737. [DOI] [PubMed] [Google Scholar]
- 75.Dela F, Larsen JJ, Mikines KJ, Galbo H. Normal effect of insulin to stimulate leg blood flow in NIDDM. Diabetes. 1995;44:221–226. doi: 10.2337/diab.44.2.221. [DOI] [PubMed] [Google Scholar]
- 76.Delmonico MJ, Kostek MC, Doldo NA, Hand BD, Walsh S, Conway JM, Carignan CR, Roth SM, Hurley BF. Alpha-actinin-3 (ACTN3) R577X polymorphism influences knee extensor peak power response to strength training in older men and women. J Gerontol A Biol Sci Med Sci. 2007;62:206–212. doi: 10.1093/gerona/62.2.206. [DOI] [PubMed] [Google Scholar]
- 77.Dickson SP, Wang K, Krantz I, Hakonarson H, Goldstein DB. Rare variants create synthetic genome-wide associations. PLoS Biol. 2010;8:e1000294. doi: 10.1371/journal.pbio.1000294. [DOI] [PMC free article] [PubMed] [Google Scholar]
- 78.Drummond MJ, Fry CS, Glynn EL, Dreyer HC, Dhanani S, Timmerman KL, Volpi E, Rasmussen BB. Rapamycin administration in humans blocks the contraction-induced increase in skeletal muscle protein synthesis. J Physiol. 2009;587:1535–1546. doi: 10.1113/jphysiol.2008.163816. [DOI] [PMC free article] [PubMed] [Google Scholar]
- 79.Druzhevskaya AM, Ahmetov, Astratenkova IV, Rogozkin VA. Association of the ACTN3 R577X polymorphism with power athlete status in Russians. Eur J Appl Physiol. 2008;103:631–634. doi: 10.1007/s00421-008-0763-1. [DOI] [PubMed] [Google Scholar]
- 80.Duggirala R, Blangero J, Almasy L, Dyer TD, Williams KL, Leach RJ, O’Connell P, Stern MP. Linkage of type 2 diabetes mellitus and of age at onset to a genetic location on chromosome 10q in Mexican Americans. Am J Hum Genet. 1999;64:1127–1140. doi: 10.1086/302316. [DOI] [PMC free article] [PubMed] [Google Scholar]
- 81.Eynon N, Duarte JA, Oliveira J, Sagiv M, Yamin C, Meckel Y, Sagiv M, Goldhammer E. ACTN3 R577X polymorphism and Israeli top-level athletes. Int J Sports Med. 2009;30:695–698. doi: 10.1055/s-0029-1220731. [DOI] [PubMed] [Google Scholar]
- 82.Febbraio MA, Hiscock N, Sacchetti M, Fischer CP, Pedersen BK. Interleukin-6 is a novel factor mediating glucose homeostasis during skeletal muscle contraction. Diabetes. 2004;53:1643–1648. doi: 10.2337/diabetes.53.7.1643. [DOI] [PubMed] [Google Scholar]
- 83.Febbraio MA, Pedersen BK. Contraction-induced myokine production and release: is skeletal muscle an endocrine organ? Exerc Sport Sci Rev. 2005;33:114–119. doi: 10.1097/00003677-200507000-00003. [DOI] [PubMed] [Google Scholar]
- 84.Franckhauser S, Elias I, Rotter Sopasakis V, Ferre T, Nagaev I, Andersson CX, Agudo J, Ruberte J, Bosch F, Smith U. Overexpression of Il6 leads to hyperinsulinaemia, liver inflammation and reduced body weight in mice. Diabetologia. 2008;51:1306–1316. doi: 10.1007/s00125-008-0998-8. [DOI] [PubMed] [Google Scholar]
- 85.Frazer KA, Eskin E, Kang HM, Bogue MA, Hinds DA, Beilharz EJ, Gupta RV, Montgomery J, Morenzoni MM, Nilsen GB, Pethiyagoda CL, Stuve LL, Johnson FM, Daly MJ, Wade CM, Cox DR. A sequence-based variation map of 8.27 million SNPs in inbred mouse strains. Nature. 2007;448:1050–1053. doi: 10.1038/nature06067. [DOI] [PubMed] [Google Scholar]
- 86.Frey N, Frank D, Lippl S, Kuhn C, Kogler H, Barrientos T, Rohr C, Will R, Muller OJ, Weiler H, Bassel-Duby R, Katus HA, Olson EN. Calsarcin-2 deficiency increases exercise capacity in mice through calcineurin/NFAT activation. J Clin Invest. 2008;118:3598–3608. doi: 10.1172/JCI36277. [DOI] [PMC free article] [PubMed] [Google Scholar]
- 87.Fujita S, Rasmussen BB, Cadenas JG, Drummond MJ, Glynn EL, Sattler FR, Volpi E. Aerobic exercise overcomes the age-related insulin resistance of muscle protein metabolism by improving endothelial function and Akt/mammalian target of rapamycin signaling. Diabetes. 2007;56:1615–1622. doi: 10.2337/db06-1566. [DOI] [PMC free article] [PubMed] [Google Scholar]
- 88.Gainetdinov RR, Wetsel WC, Jones SR, Levin ED, Jaber M, Caron MG. Role of serotonin in the paradoxical calming effect of psychostimulants on hyperactivity. Science. 1999;283:397–401. doi: 10.1126/science.283.5400.397. [DOI] [PubMed] [Google Scholar]
- 89.Gallagher IJ, Scheele C, Keller P, Nielsen AR, Remenyi J, Fischer CP, Roder K, Babraj J, Wahlestedt C, Hutvagner G, Pedersen BK, Timmons JA. Integration of microRNA changes in vivo identifies novel molecular features of muscle insulin resistance in type 2 diabetes. Genome Med. 2010;2:9. doi: 10.1186/gm130. [DOI] [PMC free article] [PubMed] [Google Scholar]
- 90.Gaskill SE, Rice T, Bouchard C, Gagnon J, Rao DC, Skinner JS, Wilmore JH, Leon AS. Familial resemblance in ventilatory threshold: the HERITAGE Family Study. Med Sci Sports Exerc. 2001;33:1832–1840. doi: 10.1097/00005768-200111000-00006. [DOI] [PubMed] [Google Scholar]
- 91.Gempel K, Topaloglu H, Talim B, Schneiderat P, Schoser BG, Hans VH, Palmafy B, Kale G, Tokatli A, Quinzii C, Hirano M, Naini A, DiMauro S, Prokisch H, Lochmuller H, Horvath R. The myopathic form of coenzyme Q10 deficiency is caused by mutations in the electron-transferring-flavoprotein dehydrogenase (ETFDH) gene. Brain. 2007;130:2037–2044. doi: 10.1093/brain/awm054. [DOI] [PMC free article] [PubMed] [Google Scholar]
- 92.Gibala MJ, Little JP, van Essen M, Wilkin GP, Burgomaster KA, Safdar A, Raha S, Tarnopolsky MA. Short-term sprint interval versus traditional endurance training: similar initial adaptations in human skeletal muscle and exercise performance. J Physiol. 2006;575:901–911. doi: 10.1113/jphysiol.2006.112094. [DOI] [PMC free article] [PubMed] [Google Scholar]
- 93.Gibala MJ, McGee SL. Metabolic adaptations to short-term high-intensity interval training: a little pain for a lot of gain? Exerc Sport Sci Rev. 2008;36:58–63. doi: 10.1097/JES.0b013e318168ec1f. [DOI] [PubMed] [Google Scholar]
- 94.Gibala MJ, McGee SL, Garnham AP, Howlett KF, Snow RJ, Hargreaves M. Brief intense interval exercise activates AMPK and p38 MAPK signaling and increases the expression of PGC-1alpha in human skeletal muscle. J Appl Physiol. 2009;106:929–934. doi: 10.1152/japplphysiol.90880.2008. [DOI] [PubMed] [Google Scholar]
- 95.Goldberg RB, Temprosa M, Haffner S, Orchard TJ, Ratner RE, Fowler SE, Mather K, Marcovina S, Saudek C, Matulik MJ, Price D. Effect of progression from impaired glucose tolerance to diabetes on cardiovascular risk factors and its amelioration by lifestyle and metformin intervention: the Diabetes Prevention Program randomized trial by the Diabetes Prevention Program Research Group. Diabetes Care. 2009;32:726–732. doi: 10.2337/dc08-0494. [DOI] [PMC free article] [PubMed] [Google Scholar]
- 96.Gollnick PD, Armstrong RB, Saltin B, Saubert CWt, Sembrowich WL, Shepherd RE. Effect of training on enzyme activity and fiber composition of human skeletal muscle. J Appl Physiol. 1973;34:107–111. doi: 10.1152/jappl.1973.34.1.107. [DOI] [PubMed] [Google Scholar]
- 97.Gollnick PD, Saltin B. Significance of skeletal muscle oxidative enzyme enhancement with endurance training. Clin Physiol. 1982;2:1–12. doi: 10.1111/j.1475-097x.1982.tb00001.x. [DOI] [PubMed] [Google Scholar]
- 98.Gonzalez NC, Kirkton SD, Howlett RA, Britton SL, Koch LG, Wagner HE, Wagner PD. Continued divergence in VO2max of rats artificially selected for running endurance is mediated by greater convective blood O2 delivery. J Appl Physiol. 2006;101:1288–1296. doi: 10.1152/japplphysiol.01527.2005. [DOI] [PubMed] [Google Scholar]
- 99.Goring HH, Curran JE, Johnson MP, Dyer TD, Charlesworth J, Cole SA, Jowett JB, Abraham LJ, Rainwater DL, Comuzzie AG, Mahaney MC, Almasy L, MacCluer JW, Kissebah AH, Collier GR, Moses EK, Blangero J. Discovery of expression QTLs using large-scale transcriptional profiling in human lymphocytes. Nat Genet. 2007;39:1208–1216. doi: 10.1038/ng2119. [DOI] [PubMed] [Google Scholar]
- 100.Grafakou O, Hol FA, Otfried Schwab K, Siers MH, ter Laak H, Trijbels F, Ensenauer R, Boelen C, Smeitink J. Exercise intolerance, muscle pain and lactic acidaemia associated with a 7497G>A mutation in the tRNASer(UCN) gene. J Inherit Metab Dis. 2003;26:593–600. doi: 10.1023/a:1025960300710. [DOI] [PubMed] [Google Scholar]
- 101.Grant SF, Thorleifsson G, Reynisdottir I, Benediktsson R, Manolescu A, Sainz J, Helgason A, Stefansson H, Emilsson V, Helgadottir A, Styrkarsdottir U, Magnusson KP, Walters GB, Palsdottir E, Jonsdottir T, Gudmundsdottir T, Gylfason A, Saemundsdottir J, Wilensky RL, Reilly MP, Rader DJ, Bagger Y, Christiansen C, Gudnason V, Sigurdsson G, Thorsteinsdottir U, Gulcher JR, Kong A, Stefansson K. Variant of transcription factor 7-like 2 (TCF7L2) gene confers risk of type 2 diabetes. Nat Genet. 2006;38:320–323. doi: 10.1038/ng1732. [DOI] [PubMed] [Google Scholar]
- 102.Greenhaff PL, Karagounis LG, Peirce N, Simpson EJ, Hazell M, Layfield R, Wackerhage H, Smith K, Atherton P, Selby A, Rennie MJ. Disassociation between the effects of amino acids and insulin on signaling, ubiquitin ligases, and protein turnover in human muscle. Am J Physiol Endocrinol Metab. 2008;295:E595–E604. doi: 10.1152/ajpendo.90411.2008. [DOI] [PMC free article] [PubMed] [Google Scholar]
- 103.Gu C, Rao DC. A linkage strategy for detection of human quantitative-trait loci. I. Generalized relative risk ratios and power of sib pairs with extreme trait values. Am J Hum Genet. 1997;61:200–210. doi: 10.1086/513908. [DOI] [PMC free article] [PubMed] [Google Scholar]
- 104.Gu J, Orr N, Park SD, Katz LM, Sulimova G, MacHugh DE, Hill EW. A genome scan for positive selection in thoroughbred horses. PLoS ONE. 2009;4:e5767. doi: 10.1371/journal.pone.0005767. [DOI] [PMC free article] [PubMed] [Google Scholar]
- 105.Gustafsson T, Kraus WE. Exercise-induced angiogenesis-related growth and transcription factors in skeletal muscle, and their modification in muscle pathology. Front Biosci. 2001;6:D75–D89. doi: 10.2741/gustafss. [DOI] [PubMed] [Google Scholar]
- 106.Gustafsson T, Puntschart A, Kaijser L, Jansson E, Sundberg CJ. Exercise-induced expression of angiogenesis-related transcription and growth factors in human skeletal muscle. Am J Physiol. 1999;276:H679–H685. doi: 10.1152/ajpheart.1999.276.2.H679. [DOI] [PubMed] [Google Scholar]
- 107.Hadjigeorgiou GM, Kawashima N, Bruno C, Andreu AL, Sue CM, Rigden DJ, Kawashima A, Shanske S, DiMauro S. Manifesting heterozygotes in a Japanese family with a novel mutation in the muscle-specific phosphoglycerate mutase (PGAM-M) gene. Neuromuscul Disord. 1999;9:399–402. doi: 10.1016/s0960-8966(99)00039-5. [DOI] [PubMed] [Google Scholar]
- 108.Hagberg JM, Ferrell RE, Katzel LI, Dengel DR, Sorkin JD, Goldberg AP. Apolipoprotein E genotype and exercise training-induced increases in plasma high-density lipoprotein (HDL)- and HDL2-cholesterol levels in overweight men. Metabolism. 1999;48:943–945. doi: 10.1016/s0026-0495(99)90185-3. [DOI] [PubMed] [Google Scholar]
- 109.Hamano T, Mutoh T, Sugie H, Koga H, Kuriyama M. Phosphoglycerate kinase deficiency: an adult myopathic form with a novel mutation. Neurology. 2000;54:1188–1190. doi: 10.1212/wnl.54.5.1188. [DOI] [PubMed] [Google Scholar]
- 110.Hamel P, Simoneau JA, Lortie G, Boulay MR, Bouchard C. Heredity and muscle adaptation to endurance training. Med Sci Sports Exerc. 1986;18:690–696. [PubMed] [Google Scholar]
- 111.Handschin C, Chin S, Li P, Liu F, Maratos-Flier E, Lebrasseur NK, Yan Z, Spiegelman BM. Skeletal muscle fiber-type switching, exercise intolerance, and myopathy in PGC-1alpha muscle-specific knock-out animals. J Biol Chem. 2007;282:30014–30021. doi: 10.1074/jbc.M704817200. [DOI] [PubMed] [Google Scholar]
- 112.Handschin C, Spiegelman BM. The role of exercise and PGC1alpha in inflammation and chronic disease. Nature. 2008;454:463–469. doi: 10.1038/nature07206. [DOI] [PMC free article] [PubMed] [Google Scholar]
- 113.Hanna MG, Nelson IP, Rahman S, Lane RJ, Land J, Heales S, Cooper MJ, Schapira AH, Morgan-Hughes JA, Wood NW. Cytochrome c oxidase deficiency associated with the first stop-codon point mutation in human mtDNA. Am J Hum Genet. 1998;63:29–36. doi: 10.1086/301910. [DOI] [PMC free article] [PubMed] [Google Scholar]
- 114.Hao H, Bonilla E, Manfredi G, DiMauro S, Moraes CT. Segregation patterns of a novel mutation in the mitochondrial tRNA glutamic acid gene associated with myopathy and diabetes mellitus. Am J Hum Genet. 1995;56:1017–1025. [PMC free article] [PubMed] [Google Scholar]
- 115.Hardie DG. AMPK: a key regulator of energy balance in the single cell and the whole organism. Int J Obes (Lond) 2008;32 (Suppl 4):S7–12. doi: 10.1038/ijo.2008.116. [DOI] [PubMed] [Google Scholar]
- 116.Hautala AJ, Makikallio TH, Kiviniemi A, Laukkanen RT, Nissila S, Huikuri HV, Tulppo MP. Cardiovascular autonomic function correlates with the response to aerobic training in healthy sedentary subjects. Am J Physiol Heart Circ Physiol. 2003;285:H1747–1752. doi: 10.1152/ajpheart.00202.2003. [DOI] [PubMed] [Google Scholar]
- 117.Hawley JA. Molecular responses to strength and endurance training: are they incompatible? Appl Physiol Nutr Metab. 2009;34:355–361. doi: 10.1139/H09-023. [DOI] [PubMed] [Google Scholar]
- 118.Hellerud C, Wramner N, Erikson A, Johansson A, Samuelson G, Lindstedt S. Glycerol kinase deficiency: follow-up during 20 years, genetics, biochemistry and prognosis. Acta Paediatr. 2004;93:911–921. [PubMed] [Google Scholar]
- 119.Henderson KK, Wagner H, Favret F, Britton SL, Koch LG, Wagner PD, Gonzalez NC. Determinants of maximal O(2) uptake in rats selectively bred for endurance running capacity. J Appl Physiol. 2002;93:1265–1274. doi: 10.1152/japplphysiol.00809.2001. [DOI] [PubMed] [Google Scholar]
- 120.Hickson RC, Dvorak BA, Gorostiaga EM, Kurowski TT, Foster C. Potential for strength and endurance training to amplify endurance performance. J Appl Physiol. 1988;65:2285–2290. doi: 10.1152/jappl.1988.65.5.2285. [DOI] [PubMed] [Google Scholar]
- 121.Hiscock N, Chan MH, Bisucci T, Darby IA, Febbraio MA. Skeletal myocytes are a source of interleukin-6 mRNA expression and protein release during contraction: evidence of fiber type specificity. FASEB J. 2004;18:992–994. doi: 10.1096/fj.03-1259fje. [DOI] [PubMed] [Google Scholar]
- 122.Hiscock N, Fischer CP, Sacchetti M, van Hall G, Febbraio MA, Pedersen BK. Recombinant human interleukin-6 infusion during low-intensity exercise does not enhance whole body lipolysis or fat oxidation in humans. Am J Physiol Endocrinol Metab. 2005;289:E2–7. doi: 10.1152/ajpendo.00274.2004. [DOI] [PubMed] [Google Scholar]
- 123.Holten MK, Zacho M, Gaster M, Juel C, Wojtaszewski JF, Dela F. Strength training increases insulin-mediated glucose uptake, GLUT4 content, and insulin signaling in skeletal muscle in patients with type 2 diabetes. Diabetes. 2004;53:294–305. doi: 10.2337/diabetes.53.2.294. [DOI] [PubMed] [Google Scholar]
- 124.Horikoshi M, Hara K, Ohashi J, Miyake K, Tokunaga K, Ito C, Kasuga M, Nagai R, Kadowaki T. A polymorphism in the AMPKalpha2 subunit gene is associated with insulin resistance and type 2 diabetes in the Japanese population. Diabetes. 2006;55:919–923. doi: 10.2337/diabetes.55.04.06.db05-0727. [DOI] [PubMed] [Google Scholar]
- 125.Horvath R, Schoser BG, Muller-Hocker J, Volpel M, Jaksch M, Lochmuller H. Mutations in mtDNA-encoded cytochrome c oxidase subunit genes causing isolated myopathy or severe encephalomyopathy. Neuromuscul Disord. 2005;15:851–857. doi: 10.1016/j.nmd.2005.09.005. [DOI] [PubMed] [Google Scholar]
- 126.Houmard JA, Tanner CJ, Slentz CA, Duscha BD, McCartney JS, Kraus WE. Effect of the volume and intensity of exercise training on insulin sensitivity. J Appl Physiol. 2004;96:101–106. doi: 10.1152/japplphysiol.00707.2003. [DOI] [PubMed] [Google Scholar]
- 127.Howlett RA, Gonzalez NC, Wagner HE, Fu Z, Britton SL, Koch LG, Wagner PD. Selected contribution: skeletal muscle capillarity and enzyme activity in rats selectively bred for running endurance. J Appl Physiol. 2003;94:1682–1688. doi: 10.1152/japplphysiol.00556.2002. [DOI] [PubMed] [Google Scholar]
- 128.Hutchison WM, Thyagarajan D, Poulton J, Marchington DR, Kirby DM, Manji SS, Dahl HH. Clinical and molecular features of encephalomyopathy due to the A3302G mutation in the mitochondrial tRNA(Leu(UUR)) gene. Arch Neurol. 2005;62:1920–1923. doi: 10.1001/archneur.62.12.1920. [DOI] [PubMed] [Google Scholar]
- 129.Huygens W, Thomis MA, Peeters MW, Vlietinck RF, Beunen GP. Determinants and upper-limit heritabilities of skeletal muscle mass and strength. Can J Appl Physiol. 2004;29:186–200. doi: 10.1139/h04-014. [DOI] [PubMed] [Google Scholar]
- 130.Ingalls CP. Nature vs. nurture: can exercise really alter fiber type composition in human skeletal muscle? J Appl Physiol. 2004;97:1591–1592. doi: 10.1152/classicessays.00010.2004. [DOI] [PubMed] [Google Scholar]
- 131.Isackson PJ, Bujnicki H, Harding CO, Vladutiu GD. Myoadenylate deaminase deficiency caused by alternative splicing due to a novel intronic mutation in the AMPD1 gene. Mol Genet Metab. 2005;86:250–256. doi: 10.1016/j.ymgme.2005.06.002. [DOI] [PubMed] [Google Scholar]
- 132.Jensen TE, Wojtaszewski JF, Richter EA. AMP-activated protein kinase in contraction regulation of skeletal muscle metabolism: necessary and/or sufficient? Acta Physiol (Oxf) 2009;196:155–174. doi: 10.1111/j.1748-1716.2009.01979.x. [DOI] [PubMed] [Google Scholar]
- 133.Johnson JL, Slentz CA, Houmard JA, Samsa GP, Duscha BD, Aiken LB, McCartney JS, Tanner CJ, Kraus WE. Exercise training amount and intensity effects on metabolic syndrome (from Studies of a Targeted Risk Reduction Intervention through Defined Exercise) Am J Cardiol. 2007;100:1759–1766. doi: 10.1016/j.amjcard.2007.07.027. [DOI] [PMC free article] [PubMed] [Google Scholar]
- 134.Jones SW, Hill RJ, Krasney PA, O’Conner B, Peirce N, Greenhaff PL. Disuse atrophy and exercise rehabilitation in humans profoundly affects the expression of genes associated with the regulation of skeletal muscle mass. FASEB J. 2004;18:1025–1027. doi: 10.1096/fj.03-1228fje. [DOI] [PubMed] [Google Scholar]
- 135.Jonsdottir IH, Schjerling P, Ostrowski K, Asp S, Richter EA, Pedersen BK. Muscle contractions induce interleukin-6 mRNA production in rat skeletal muscles. J Physiol. 2000;528(Pt 1):157–163. doi: 10.1111/j.1469-7793.2000.00157.x. [DOI] [PMC free article] [PubMed] [Google Scholar]
- 136.Jorgensen SB, Wojtaszewski JF, Viollet B, Andreelli F, Birk JB, Hellsten Y, Schjerling P, Vaulont S, Neufer PD, Richter EA, Pilegaard H. Effects of alpha-AMPK knockout on exercise-induced gene activation in mouse skeletal muscle. FASEB J. 2005;19:1146–1148. doi: 10.1096/fj.04-3144fje. [DOI] [PubMed] [Google Scholar]
- 137.Karadimas CL, Greenstein P, Sue CM, Joseph JT, Tanji K, Haller RG, Taivassalo T, Davidson MM, Shanske S, Bonilla E, DiMauro S. Recurrent myoglobinuria due to a nonsense mutation in the COX I gene of mitochondrial DNA. Neurology. 2000;55:644–649. doi: 10.1212/wnl.55.5.644. [DOI] [PubMed] [Google Scholar]
- 138.Karadimas CL, Salviati L, Sacconi S, Chronopoulou P, Shanske S, Bonilla E, De Vivo DC, DiMauro S. Mitochondrial myopathy and ophthalmoplegia in a sporadic patient with the G12315A mutation in mitochondrial DNA. Neuromuscul Disord. 2002;12:865–868. doi: 10.1016/s0960-8966(02)00072-x. [DOI] [PubMed] [Google Scholar]
- 139.Katzmarzyk PT, Gledhill N, Perusse L, Bouchard C. Familial aggregation of 7-year changes in musculoskeletal fitness. J Gerontol A Biol Sci Med Sci. 2001;56:B497–502. doi: 10.1093/gerona/56.12.b497. [DOI] [PubMed] [Google Scholar]
- 140.Katzmarzyk PT, Perusse L, Rao DC, Bouchard C. Familial risk ratios for high and low physical fitness levels in the Canadian population. Med Sci Sports Exerc. 2000;32:614–619. doi: 10.1097/00005768-200003000-00010. [DOI] [PubMed] [Google Scholar]
- 141.Keightley JA, Anitori R, Burton MD, Quan F, Buist NR, Kennaway NG. Mitochondrial encephalomyopathy and complex III deficiency associated with a stop-codon mutation in the cytochrome b gene. Am J Hum Genet. 2000;67:1400–1410. doi: 10.1086/316900. [DOI] [PMC free article] [PubMed] [Google Scholar]
- 142.Keller P, Penkowa M, Keller C, Steensberg A, Fischer CP, Giralt M, Hidalgo J, Pedersen BK. Interleukin-6 receptor expression in contracting human skeletal muscle: regulating role of IL- 6. FASEB J. 2005;19:1181–1183. doi: 10.1096/fj.04-3278fje. [DOI] [PubMed] [Google Scholar]
- 143.Keller P, Vollaard N, Babraj J, Ball D, Sewell DA, Timmons JA. Using systems biology to define the essential biological networks responsible for adaptation to endurance exercise training. Biochem Soc Trans. 2007;35:1306–1309. doi: 10.1042/BST0351306. [DOI] [PubMed] [Google Scholar]
- 144.Keller P, Vollaard NB, Gustafsson T, Gallagher IJ, Sundberg CJ, Rankinen T, Britton SL, Bouchard C, Koch LG, Timmons JA. A transcriptional map of the impact of endurance exercise training on skeletal muscle phenotype. J Appl Physiol. 2010 doi: 10.1152/japplphysiol.00634.2010. [DOI] [PMC free article] [PubMed] [Google Scholar]
- 145.Kelly MA, Rubinstein M, Phillips TJ, Lessov CN, Burkhart-Kasch S, Zhang G, Bunzow JR, Fang Y, Gerhardt GA, Grandy DK, Low MJ. Locomotor activity in D2 dopamine receptor-deficient mice is determined by gene dosage, genetic background, and developmental adaptations. J Neurosci. 1998;18:3470–3479. doi: 10.1523/JNEUROSCI.18-09-03470.1998. [DOI] [PMC free article] [PubMed] [Google Scholar]
- 146.Kelly SA, Nehrenberg DL, Peirce JL, Hua K, Steffy BM, Wiltshire T, Pardo-Manuel de Villena F, Garland T, Jr, Pomp D. Genetic architecture of voluntary exercise in an advanced intercross line of mice. Physiol Genomics. 2010;42:190–200. doi: 10.1152/physiolgenomics.00028.2010. [DOI] [PMC free article] [PubMed] [Google Scholar]
- 147.Klein RJ, Zeiss C, Chew EY, Tsai JY, Sackler RS, Haynes C, Henning AK, SanGiovanni JP, Mane SM, Mayne ST, Bracken MB, Ferris FL, Ott J, Barnstable C, Hoh J. Complement factor H polymorphism in age-related macular degeneration. Science. 2005;308:385–389. doi: 10.1126/science.1109557. [DOI] [PMC free article] [PubMed] [Google Scholar]
- 148.Knowler WC, Barrett-Connor E, Fowler SE, Hamman RF, Lachin JM, Walker EA, Nathan DM. Reduction in the incidence of type 2 diabetes with lifestyle intervention or metformin. N Engl J Med. 2002;346:393–403. doi: 10.1056/NEJMoa012512. [DOI] [PMC free article] [PubMed] [Google Scholar]
- 149.Koch LG, Britton SL. Aerobic metabolism underlies complexity and capacity. J Physiol. 2008;586:83–95. doi: 10.1113/jphysiol.2007.144709. [DOI] [PMC free article] [PubMed] [Google Scholar]
- 150.Koch LG, Meredith TA, Fraker TD, Metting PJ, Britton SL. Heritability of treadmill running endurance in rats. Am J Physiol. 1998;275:R1455–1460. doi: 10.1152/ajpregu.1998.275.5.R1455. [DOI] [PubMed] [Google Scholar]
- 151.Kohrt WM, Malley MT, Coggan AR, Spina RJ, Ogawa T, Ehsani AA, Bourey RE, Martin WH, 3rd, Holloszy JO. Effects of gender, age, and fitness level on response of VO2max to training in 60–71 yr olds. J Appl Physiol. 1991;71:2004–2011. doi: 10.1152/jappl.1991.71.5.2004. [DOI] [PubMed] [Google Scholar]
- 152.Kokkotou E, Jeon JY, Wang X, Marino FE, Carlson M, Trombly DJ, Maratos-Flier E. Mice with MCH ablation resist diet-induced obesity through strain-specific mechanisms. Am J Physiol Regul Integr Comp Physiol. 2005;289:R117–124. doi: 10.1152/ajpregu.00861.2004. [DOI] [PubMed] [Google Scholar]
- 153.Kollberg G, Tulinius M, Gilljam T, Ostman-Smith I, Forsander G, Jotorp P, Oldfors A, Holme E. Cardiomyopathy and exercise intolerance in muscle glycogen storage disease 0. N Engl J Med. 2007;357:1507–1514. doi: 10.1056/NEJMoa066691. [DOI] [PubMed] [Google Scholar]
- 154.Koller BH, Hagemann LJ, Doetschman T, Hagaman JR, Huang S, Williams PJ, First NL, Maeda N, Smithies O. Germ-line transmission of a planned alteration made in a hypoxanthine phosphoribosyltransferase gene by homologous recombination in embryonic stem cells. Proc Natl Acad Sci U S A. 1989;86:8927–8931. doi: 10.1073/pnas.86.22.8927. [DOI] [PMC free article] [PubMed] [Google Scholar]
- 155.Kramer HF, Goodyear LJ. Exercise, MAPK, and NF-kappaB signaling in skeletal muscle. J Appl Physiol. 2007;103:388–395. doi: 10.1152/japplphysiol.00085.2007. [DOI] [PubMed] [Google Scholar]
- 156.Kraus WE, Houmard JA, Duscha BD, Knetzger KJ, Wharton MB, McCartney JS, Bales CW, Henes S, Samsa GP, Otvos JD, Kulkarni KR, Slentz CA. Effects of the amount and intensity of exercise on plasma lipoproteins. N Engl J Med. 2002;347:1483–1492. doi: 10.1056/NEJMoa020194. [DOI] [PubMed] [Google Scholar]
- 157.Kriketos AD, Pan DA, Lillioja S, Cooney GJ, Baur LA, Milner MR, Sutton JR, Jenkins AB, Bogardus C, Storlien LH. Interrelationships between muscle morphology, insulin action, and adiposity. Am J Physiol. 1996;270:R1332–1339. doi: 10.1152/ajpregu.1996.270.6.R1332. [DOI] [PubMed] [Google Scholar]
- 158.Laitinen PJ, Brown KM, Piippo K, Swan H, Devaney JM, Brahmbhatt B, Donarum EA, Marino M, Tiso N, Viitasalo M, Toivonen L, Stephan DA, Kontula K. Mutations of the cardiac ryanodine receptor (RyR2) gene in familial polymorphic ventricular tachycardia. Circulation. 2001;103:485–490. doi: 10.1161/01.cir.103.4.485. [DOI] [PubMed] [Google Scholar]
- 159.Lamantea E, Carrara F, Mariotti C, Morandi L, Tiranti V, Zeviani M. A novel nonsense mutation (Q352X) in the mitochondrial cytochrome b gene associated with a combined deficiency of complexes I and III. Neuromuscul Disord. 2002;12:49–52. doi: 10.1016/s0960-8966(01)00244-9. [DOI] [PubMed] [Google Scholar]
- 160.Lander ES, Linton LM, Birren B, Nusbaum C, Zody MC, Baldwin J, Devon K, Dewar K, Doyle M, FitzHugh W, Funke R, Gage D, Harris K, Heaford A, Howland J, Kann L, Lehoczky J, LeVine R, McEwan P, McKernan K, Meldrim J, Mesirov JP, Miranda C, Morris W, Naylor J, Raymond C, Rosetti M, Santos R, Sheridan A, Sougnez C, Stange-Thomann N, Stojanovic N, Subramanian A, Wyman D, Rogers J, Sulston J, Ainscough R, Beck S, Bentley D, Burton J, Clee C, Carter N, Coulson A, Deadman R, Deloukas P, Dunham A, Dunham I, Durbin R, French L, Grafham D, Gregory S, Hubbard T, Humphray S, Hunt A, Jones M, Lloyd C, McMurray A, Matthews L, Mercer S, Milne S, Mullikin JC, Mungall A, Plumb R, Ross M, Shownkeen R, Sims S, Waterston RH, Wilson RK, Hillier LW, McPherson JD, Marra MA, Mardis ER, Fulton LA, Chinwalla AT, Pepin KH, Gish WR, Chissoe SL, Wendl MC, Delehaunty KD, Miner TL, Delehaunty A, Kramer JB, Cook LL, Fulton RS, Johnson DL, Minx PJ, Clifton SW, Hawkins T, Branscomb E, Predki P, Richardson P, Wenning S, Slezak T, Doggett N, Cheng JF, Olsen A, Lucas S, Elkin C, Uberbacher E, Frazier M, Gibbs RA, Muzny DM, Scherer SE, Bouck JB, Sodergren EJ, Worley KC, Rives CM, Gorrell JH, Metzker ML, Naylor SL, Kucherlapati RS, Nelson DL, Weinstock GM, Sakaki Y, Fujiyama A, Hattori M, Yada T, Toyoda A, Itoh T, Kawagoe C, Watanabe H, Totoki Y, Taylor T, Weissenbach J, Heilig R, Saurin W, Artiguenave F, Brottier P, Bruls T, Pelletier E, Robert C, Wincker P, Smith DR, Doucette-Stamm L, Rubenfield M, Weinstock K, Lee HM, Dubois J, Rosenthal A, Platzer M, Nyakatura G, Taudien S, Rump A, Yang H, Yu J, Wang J, Huang G, Gu J, Hood L, Rowen L, Madan A, Qin S, Davis RW, Federspiel NA, Abola AP, Proctor MJ, Myers RM, Schmutz J, Dickson M, Grimwood J, Cox DR, Olson MV, Kaul R, Shimizu N, Kawasaki K, Minoshima S, Evans GA, Athanasiou M, Schultz R, Roe BA, Chen F, Pan H, Ramser J, Lehrach H, Reinhardt R, McCombie WR, de la Bastide M, Dedhia N, Blocker H, Hornischer K, Nordsiek G, Agarwala R, Aravind L, Bailey JA, Bateman A, Batzoglou S, Birney E, Bork P, Brown DG, Burge CB, Cerutti L, Chen HC, Church D, Clamp M, Copley RR, Doerks T, Eddy SR, Eichler EE, Furey TS, Galagan J, Gilbert JG, Harmon C, Hayashizaki Y, Haussler D, Hermjakob H, Hokamp K, Jang W, Johnson LS, Jones TA, Kasif S, Kaspryzk A, Kennedy S, Kent WJ, Kitts P, Koonin EV, Korf I, Kulp D, Lancet D, Lowe TM, McLysaght A, Mikkelsen T, Moran JV, Mulder N, Pollara VJ, Ponting CP, Schuler G, Schultz J, Slater G, Smit AF, Stupka E, Szustakowski J, Thierry-Mieg D, Thierry-Mieg J, Wagner L, Wallis J, Wheeler R, Williams A, Wolf YI, Wolfe KH, Yang SP, Yeh RF, Collins F, Guyer MS, Peterson J, Felsenfeld A, Wetterstrand KA, Patrinos A, Morgan MJ, de Jong P, Catanese JJ, Osoegawa K, Shizuya H, Choi S, Chen YJ. Initial sequencing and analysis of the human genome. Nature. 2001;409:860–921. doi: 10.1038/35057062. [DOI] [PubMed] [Google Scholar]
- 161.Leick L, Plomgaard P, Gronlokke L, Al-Abaiji F, Wojtaszewski JF, Pilegaard H. Endurance exercise induces mRNA expression of oxidative enzymes in human skeletal muscle late in recovery. Scand J Med Sci Sports. 2010;20:593–599. doi: 10.1111/j.1600-0838.2009.00988.x. [DOI] [PubMed] [Google Scholar]
- 162.Leick L, Wojtaszewski JF, Johansen ST, Kiilerich K, Comes G, Hellsten Y, Hidalgo J, Pilegaard H. PGC-1alpha is not mandatory for exercise- and training-induced adaptive gene responses in mouse skeletal muscle. Am J Physiol Endocrinol Metab. 2008;294:E463–474. doi: 10.1152/ajpendo.00666.2007. [DOI] [PubMed] [Google Scholar]
- 163.Leon AS, Rice T, Mandel S, Despres JP, Bergeron J, Gagnon J, Rao DC, Skinner JS, Wilmore JH, Bouchard C. Blood lipid response to 20 weeks of supervised exercise in a large biracial population: the HERITAGE Family Study. Metabolism. 2000;49:513–520. doi: 10.1016/s0026-0495(00)80018-9. [DOI] [PubMed] [Google Scholar]
- 164.Lesage R, Simoneau JA, Jobin J, Leblanc J, Bouchard C. Familial resemblance in maximal heart rate, blood lactate and aerobic power. Hum Hered. 1985;35:182–189. doi: 10.1159/000153540. [DOI] [PubMed] [Google Scholar]
- 165.Lightfoot JT, Leamy L, Pomp D, Turner MJ, Fodor AA, Knab A, Bowen RS, Ferguson D, Moore-Harrison T, Hamilton A. Strain screen and haplotype association mapping of wheel running in inbred mouse strains. J Appl Physiol. 2010;109:623–634. doi: 10.1152/japplphysiol.00525.2010. [DOI] [PMC free article] [PubMed] [Google Scholar]
- 166.Lightfoot JT, Turner MJ, Knab AK, Jedlicka AE, Oshimura T, Marzec J, Gladwell W, Leamy LJ, Kleeberger SR. Quantitative trait loci associated with maximal exercise endurance in mice. J Appl Physiol. 2007;103:105–110. doi: 10.1152/japplphysiol.01328.2006. [DOI] [PubMed] [Google Scholar]
- 167.Lillioja S, Young AA, Culter CL, Ivy JL, Abbott WG, Zawadzki JK, Yki-Jarvinen H, Christin L, Secomb TW, Bogardus C. Skeletal muscle capillary density and fiber type are possible determinants of in vivo insulin resistance in man. J Clin Invest. 1987;80:415–424. doi: 10.1172/JCI113088. [DOI] [PMC free article] [PubMed] [Google Scholar]
- 168.Lin J, Wu H, Tarr PT, Zhang CY, Wu Z, Boss O, Michael LF, Puigserver P, Isotani E, Olson EN, Lowell BB, Bassel-Duby R, Spiegelman BM. Transcriptional co-activator PGC-1 alpha drives the formation of slow-twitch muscle fibres. Nature. 2002;418:797–801. doi: 10.1038/nature00904. [DOI] [PubMed] [Google Scholar]
- 169.Liu Y, Randall WR, Schneider MF. Activity-dependent and -independent nuclear fluxes of HDAC4 mediated by different kinases in adult skeletal muscle. J Cell Biol. 2005;168:887–897. doi: 10.1083/jcb.200408128. [DOI] [PMC free article] [PubMed] [Google Scholar]
- 170.Lohmueller KE, Pearce CL, Pike M, Lander ES, Hirschhorn JN. Meta-analysis of genetic association studies supports a contribution of common variants to susceptibility to common disease. Nat Genet. 2003;33:177–182. doi: 10.1038/ng1071. [DOI] [PubMed] [Google Scholar]
- 171.Longley MJ, Clark S, Yu Wai Man C, Hudson G, Durham SE, Taylor RW, Nightingale S, Turnbull DM, Copeland WC, Chinnery PF. Mutant POLG2 disrupts DNA polymerase gamma subunits and causes progressive external ophthalmoplegia. Am J Hum Genet. 2006;78:1026–1034. doi: 10.1086/504303. [DOI] [PMC free article] [PubMed] [Google Scholar]
- 172.Loos RJ, Rankinen T, Tremblay A, Perusse L, Chagnon Y, Bouchard C. Melanocortin-4 receptor gene and physical activity in the Quebec Family Study. Int J Obes (Lond) 2005;29:420–428. doi: 10.1038/sj.ijo.0802869. [DOI] [PubMed] [Google Scholar]
- 173.Lortie G, Bouchard C, Leblanc C, Tremblay A, Simoneau JA, Theriault G, Savoie JP. Familial similarity in aerobic power. Hum Biol. 1982;54:801–812. [PubMed] [Google Scholar]
- 174.Lortie G, Simoneau JA, Hamel P, Boulay MR, Landry F, Bouchard C. Responses of maximal aerobic power and capacity to aerobic training. Int J Sports Med. 1984;5:232–236. doi: 10.1055/s-2008-1025911. [DOI] [PubMed] [Google Scholar]
- 175.Lucia A, Gomez-Gallego F, Santiago C, Bandres F, Earnest C, Rabadan M, Alonso JM, Hoyos J, Cordova A, Villa G, Foster C. ACTN3 genotype in professional endurance cyclists. Int J Sports Med. 2006;27:880–884. doi: 10.1055/s-2006-923862. [DOI] [PubMed] [Google Scholar]
- 176.Maarbjerg SJ, Jorgensen SB, Rose AJ, Jeppesen J, Jensen TE, Treebak JT, Birk JB, Schjerling P, Wojtaszewski JF, Richter EA. Genetic impairment of {alpha}2-AMPK signaling does not reduce muscle glucose uptake during treadmill exercise in mice. Am J Physiol Endocrinol Metab. 2009 doi: 10.1152/ajpendo.90653.2008. [DOI] [PubMed] [Google Scholar]
- 177.Maekawa M, Sudo K, Kanno T, Li SS. Molecular characterization of genetic mutation in human lactate dehydrogenase-A (M) deficiency. Biochem Biophys Res Commun. 1990;168:677–682. doi: 10.1016/0006-291x(90)92374-9. [DOI] [PubMed] [Google Scholar]
- 178.Mahoney DJ, Parise G, Melov S, Safdar A, Tarnopolsky MA. Analysis of global mRNA expression in human skeletal muscle during recovery from endurance exercise. FASEB J. 2005;19:1498–1500. doi: 10.1096/fj.04-3149fje. [DOI] [PubMed] [Google Scholar]
- 179.Mancuso M, Filosto M, Stevens JC, Patterson M, Shanske S, Krishna S, DiMauro S. Mitochondrial myopathy and complex III deficiency in a patient with a new stop-codon mutation (G339X) in the cytochrome b gene. J Neurol Sci. 2003;209:61–63. doi: 10.1016/s0022-510x(02)00462-8. [DOI] [PubMed] [Google Scholar]
- 180.Manolio TA. Genomewide association studies and assessment of the risk of disease. N Engl J Med. 2010;363:166–176. doi: 10.1056/NEJMra0905980. [DOI] [PubMed] [Google Scholar]
- 181.Mansour SL, Thomas KR, Capecchi MR. Disruption of the proto-oncogene int-2 in mouse embryo-derived stem cells: a general strategy for targeting mutations to non-selectable genes. Nature. 1988;336:348–352. doi: 10.1038/336348a0. [DOI] [PubMed] [Google Scholar]
- 182.Marsh DJ, Weingarth DT, Novi DE, Chen HY, Trumbauer ME, Chen AS, Guan XM, Jiang MM, Feng Y, Camacho RE, Shen Z, Frazier EG, Yu H, Metzger JM, Kuca SJ, Shearman LP, Gopal-Truter S, MacNeil DJ, Strack AM, MacIntyre DE, Van der Ploeg LH, Qian S. Melanin-concentrating hormone 1 receptor-deficient mice are lean, hyperactive, and hyperphagic and have altered metabolism. Proc Natl Acad Sci U S A. 2002;99:3240–3245. doi: 10.1073/pnas.052706899. [DOI] [PMC free article] [PubMed] [Google Scholar]
- 183.Marshall CR, Noor A, Vincent JB, Lionel AC, Feuk L, Skaug J, Shago M, Moessner R, Pinto D, Ren Y, Thiruvahindrapduram B, Fiebig A, Schreiber S, Friedman J, Ketelaars CE, Vos YJ, Ficicioglu C, Kirkpatrick S, Nicolson R, Sloman L, Summers A, Gibbons CA, Teebi A, Chitayat D, Weksberg R, Thompson A, Vardy C, Crosbie V, Luscombe S, Baatjes R, Zwaigenbaum L, Roberts W, Fernandez B, Szatmari P, Scherer SW. Structural variation of chromosomes in autism spectrum disorder. Am J Hum Genet. 2008;82:477–488. doi: 10.1016/j.ajhg.2007.12.009. [DOI] [PMC free article] [PubMed] [Google Scholar]
- 184.Martin MA, Rubio JC, del Hoyo P, Garcia A, Bustos F, Campos Y, Cabello A, Culebras JM, Arenas J. Identification of novel mutations in Spanish patients with muscle carnitine palmitoyltransferase II deficiency. Hum Mutat. 2000;15:579–580. doi: 10.1002/1098-1004(200006)15:6<579::AID-HUMU14>3.0.CO;2-H. [DOI] [PubMed] [Google Scholar]
- 185.Mattick JS. The genetic signatures of noncoding RNAs. PLoS Genet. 2009;5:e1000459. doi: 10.1371/journal.pgen.1000459. [DOI] [PMC free article] [PubMed] [Google Scholar]
- 186.Mattick JS, Makunin IV. Non-coding RNA. Hum Mol Genet. 2006;15(Spec No 1):R17–29. doi: 10.1093/hmg/ddl046. [DOI] [PubMed] [Google Scholar]
- 187.Mayhew DL, Kim JS, Cross JM, Ferrando AA, Bamman MM. Translational signaling responses preceding resistance training-mediated myofiber hypertrophy in young and old humans. J Appl Physiol. 2009;107:1655–1662. doi: 10.1152/japplphysiol.91234.2008. [DOI] [PMC free article] [PubMed] [Google Scholar]
- 188.McArdle B. Myopathy due to a defect in muscle glycogen breakdown. Clin Sci. 1951;10:13–33. [PubMed] [Google Scholar]
- 189.McCauley T, Mastana SS, Folland JP. ACE I/D and ACTN3 R/X polymorphisms and muscle function and muscularity of older Caucasian men. Eur J Appl Physiol. 2010;109:269–277. doi: 10.1007/s00421-009-1340-y. [DOI] [PubMed] [Google Scholar]
- 190.McCauley T, Mastana SS, Hossack J, Macdonald M, Folland JP. Human angiotensin-converting enzyme I/D and alpha-actinin 3 R577X genotypes and muscle functional and contractile properties. Exp Physiol. 2009;94:81–89. doi: 10.1113/expphysiol.2008.043075. [DOI] [PubMed] [Google Scholar]
- 191.McFarland R, Taylor RW, Chinnery PF, Howell N, Turnbull DM. A novel sporadic mutation in cytochrome c oxidase subunit II as a cause of rhabdomyolysis. Neuromuscul Disord. 2004;14:162–166. doi: 10.1016/j.nmd.2003.10.011. [DOI] [PubMed] [Google Scholar]
- 192.McGee SL, Fairlie E, Garnham AP, Hargreaves M. Exercise-induced histone modifications in human skeletal muscle. J Physiol. 2009;587:5951–5958. doi: 10.1113/jphysiol.2009.181065. [DOI] [PMC free article] [PubMed] [Google Scholar]
- 193.Meek TH, Lonquich BP, Hannon RM, Garland T., Jr Endurance capacity of mice selectively bred for high voluntary wheel running. J Exp Biol. 2009;212:2908–2917. doi: 10.1242/jeb.028886. [DOI] [PubMed] [Google Scholar]
- 194.Mefford HC, Sharp AJ, Baker C, Itsara A, Jiang Z, Buysse K, Huang S, Maloney VK, Crolla JA, Baralle D, Collins A, Mercer C, Norga K, de Ravel T, Devriendt K, Bongers EM, de Leeuw N, Reardon W, Gimelli S, Bena F, Hennekam RC, Male A, Gaunt L, Clayton-Smith J, Simonic I, Park SM, Mehta SG, Nik-Zainal S, Woods CG, Firth HV, Parkin G, Fichera M, Reitano S, Lo Giudice M, Li KE, Casuga I, Broomer A, Conrad B, Schwerzmann M, Raber L, Gallati S, Striano P, Coppola A, Tolmie JL, Tobias ES, Lilley C, Armengol L, Spysschaert Y, Verloo P, De Coene A, Goossens L, Mortier G, Speleman F, van Binsbergen E, Nelen MR, Hochstenbach R, Poot M, Gallagher L, Gill M, McClellan J, King MC, Regan R, Skinner C, Stevenson RE, Antonarakis SE, Chen C, Estivill X, Menten B, Gimelli G, Gribble S, Schwartz S, Sutcliffe JS, Walsh T, Knight SJ, Sebat J, Romano C, Schwartz CE, Veltman JA, de Vries BB, Vermeesch JR, Barber JC, Willatt L, Tassabehji M, Eichler EE. Recurrent rearrangements of chromosome 1q21.1 and variable pediatric phenotypes. N Engl J Med. 2008;359:1685–1699. doi: 10.1056/NEJMoa0805384. [DOI] [PMC free article] [PubMed] [Google Scholar]
- 195.Mongini T, Doriguzzi C, Bosone I, Chiado-Piat L, Hoffman EP, Palmucci L. Alpha-sarcoglycan deficiency featuring exercise intolerance and myoglobinuria. Neuropediatrics. 2002;33:109–111. doi: 10.1055/s-2002-32374. [DOI] [PubMed] [Google Scholar]
- 196.Montgomery HE, Clarkson P, Dollery CM, Prasad K, Losi MA, Hemingway H, Statters D, Jubb M, Girvain M, Varnava A, World M, Deanfield J, Talmud P, McEwan JR, McKenna WJ, Humphries S. Association of angiotensin-converting enzyme gene I/D polymorphism with change in left ventricular mass in response to physical training. Circulation. 1997;96:741–747. doi: 10.1161/01.cir.96.3.741. [DOI] [PubMed] [Google Scholar]
- 197.Montoye HJ, Gayle R. Familial relationships in maximal oxygen uptake. Hum Biol. 1978;50:241–249. [PubMed] [Google Scholar]
- 198.Moore LL, Lombardi DA, White MJ, Campbell JL, Oliveria SA, Ellison RC. Influence of parents’ physical activity levels on activity levels of young children. J Pediatr. 1991;118:215–219. doi: 10.1016/s0022-3476(05)80485-8. [DOI] [PubMed] [Google Scholar]
- 199.Mootha VK, Lindgren CM, Eriksson KF, Subramanian A, Sihag S, Lehar J, Puigserver P, Carlsson E, Ridderstrale M, Laurila E, Houstis N, Daly MJ, Patterson N, Mesirov JP, Golub TR, Tamayo P, Spiegelman B, Lander ES, Hirschhorn JN, Altshuler D, Groop LC. PGC-1alpha-responsive genes involved in oxidative phosphorylation are coordinately downregulated in human diabetes. Nat Genet. 2003;34:267–273. doi: 10.1038/ng1180. [DOI] [PubMed] [Google Scholar]
- 200.Moran CN, Yang N, Bailey ME, Tsiokanos A, Jamurtas A, MacArthur DG, North K, Pitsiladis YP, Wilson RH. Association analysis of the ACTN3 R577X polymorphism and complex quantitative body composition and performance phenotypes in adolescent Greeks. Eur J Hum Genet. 2007;15:88–93. doi: 10.1038/sj.ejhg.5201724. [DOI] [PubMed] [Google Scholar]
- 201.Mosher DS, Quignon P, Bustamante CD, Sutter NB, Mellersh CS, Parker HG, Ostrander EA. A mutation in the myostatin gene increases muscle mass and enhances racing performance in heterozygote dogs. PLoS Genet. 2007;3:e79. doi: 10.1371/journal.pgen.0030079. [DOI] [PMC free article] [PubMed] [Google Scholar]
- 202.Munoz-Malaga A, Bautista J, Salazar JA, Aguilera I, Garcia R, Chinchon I, Segura MD, Campos Y, Arenas J. Lipomatosis, proximal myopathy, and the mitochondrial 8344 mutation. A lipid storage myopathy? Muscle Nerve. 2000;23:538–542. doi: 10.1002/(sici)1097-4598(200004)23:4<538::aid-mus12>3.0.co;2-t. [DOI] [PubMed] [Google Scholar]
- 203.Murgia M, Jensen TE, Cusinato M, Garcia M, Richter EA, Schiaffino S. Multiple signalling pathways redundantly control glucose transporter GLUT4 gene transcription in skeletal muscle. J Physiol. 2009;587:4319–4327. doi: 10.1113/jphysiol.2009.174888. [DOI] [PMC free article] [PubMed] [Google Scholar]
- 204.Murton AJ, Greenhaff PL. Physiological control of muscle mass in humans during resistance exercise, disuse and rehabilitation. Curr Opin Clin Nutr Metab Care. doi: 10.1097/MCO.0b013e3283374d19. [DOI] [PubMed] [Google Scholar]
- 205.Mustelin L, Pietilainen KH, Rissanen A, Sovijarvi AR, Piirila P, Naukkarinen J, Peltonen L, Kaprio J, Yki-Jarvinen H. Acquired obesity and poor physical fitness impair expression of genes of mitochondrial oxidative phosphorylation in monozygotic twins discordant for obesity. Am J Physiol Endocrinol Metab. 2008;295:E148–154. doi: 10.1152/ajpendo.00580.2007. [DOI] [PMC free article] [PubMed] [Google Scholar]
- 206.Musumeci O, Andreu AL, Shanske S, Bresolin N, Comi GP, Rothstein R, Schon EA, DiMauro S. Intragenic inversion of mtDNA: A new type of pathogenic mutation in a patient with mitochondrial myopathy. Am J Hum Genet. 2000;66:1900–1904. doi: 10.1086/302927. [DOI] [PMC free article] [PubMed] [Google Scholar]
- 207.Musumeci O, Rodolico C, Nishino I, Di Guardo G, Migliorato A, Aguennouz M, Mazzeo A, Messina C, Vita G, Toscano A. Asymptomatic hyperCKemia in a case of Danon disease due to a missense mutation in Lamp-2 gene. Neuromuscul Disord. 2005;15:409–411. doi: 10.1016/j.nmd.2005.02.008. [DOI] [PubMed] [Google Scholar]
- 208.Myers J, Kaykha A, George S, Abella J, Zaheer N, Lear S, Yamazaki T, Froelicher V. Fitness versus physical activity patterns in predicting mortality in men. Am J Med. 2004;117:912–918. doi: 10.1016/j.amjmed.2004.06.047. [DOI] [PubMed] [Google Scholar]
- 209.Myers J, Prakash M, Froelicher V, Do D, Partington S, Atwood JE. Exercise capacity and mortality among men referred for exercise testing. N Engl J Med. 2002;346:793–801. doi: 10.1056/NEJMoa011858. [DOI] [PubMed] [Google Scholar]
- 210.Myerson SG, Montgomery HE, Whittingham M, Jubb M, World MJ, Humphries SE, Pennell DJ. Left ventricular hypertrophy with exercise and ACE gene insertion/deletion polymorphism: A randomized controlled trial with losartan. Circulation. 2001;103:226–230. doi: 10.1161/01.cir.103.2.226. [DOI] [PubMed] [Google Scholar]
- 211.Neale MC, Boker SM, Xie G, Maes HH. Mx: Statistical Modeling. Richmond, VA: Virginia Commonwealth University Department of Psychiatry; 2002. [Google Scholar]
- 212.Ng SB, Buckingham KJ, Lee C, Bigham AW, Tabor HK, Dent KM, Huff CD, Shannon PT, Jabs EW, Nickerson DA, Shendure J, Bamshad MJ. Exome sequencing identifies the cause of a mendelian disorder. Nat Genet. 2010;42:30–35. doi: 10.1038/ng.499. [DOI] [PMC free article] [PubMed] [Google Scholar]
- 213.Niemi AK, Majamaa K. Mitochondrial DNA and ACTN3 genotypes in Finnish elite endurance and sprint athletes. Eur J Hum Genet. 2005;13:965–969. doi: 10.1038/sj.ejhg.5201438. [DOI] [PubMed] [Google Scholar]
- 214.Noble D. Modeling the heart--from genes to cells to the whole organ. Science. 2002;295:1678–1682. doi: 10.1126/science.1069881. [DOI] [PubMed] [Google Scholar]
- 215.Norman B, Esbjornsson M, Rundqvist H, Osterlund T, von Walden F, Tesch PA. Strength, power, fiber types, and mRNA expression in trained men and women with different ACTN3 R577X genotypes. J Appl Physiol. 2009;106:959–965. doi: 10.1152/japplphysiol.91435.2008. [DOI] [PubMed] [Google Scholar]
- 216.Norrbom J, Sundberg CJ, Ameln H, Kraus WE, Jansson E, Gustafsson T. PGC-1alpha mRNA expression is influenced by metabolic perturbation in exercising human skeletal muscle. J Appl Physiol. 2004;96:189–194. doi: 10.1152/japplphysiol.00765.2003. [DOI] [PubMed] [Google Scholar]
- 217.Norrbom J, Wallman SE, Gustafsson T, Rundqvist H, Jansson E, Sundberg CJ. Training response of mitochondrial transcription factors in human skeletal muscle. Acta Physiol (Oxf) 198:71–79. doi: 10.1111/j.1748-1716.2009.02030.x. [DOI] [PubMed] [Google Scholar]
- 218.Olfert IM, Howlett RA, Tang K, Dalton ND, Gu Y, Peterson KL, Wagner PD, Breen EC. Muscle-specific VEGF deficiency greatly reduces exercise endurance in mice. J Physiol. 2009;587:1755–1767. doi: 10.1113/jphysiol.2008.164384. [DOI] [PMC free article] [PubMed] [Google Scholar]
- 219.Olson EN, Williams RS. Calcineurin signaling and muscle remodeling. Cell. 2000;101:689–692. doi: 10.1016/s0092-8674(00)80880-6. [DOI] [PubMed] [Google Scholar]
- 220.Ookawara T, Dave V, Willems P, Martin JJ, de Barsy T, Matthys E, Yoshida A. Retarded and aberrant splicings caused by single exon mutation in a phosphoglycerate kinase variant. Arch Biochem Biophys. 1996;327:35–40. doi: 10.1006/abbi.1996.0089. [DOI] [PubMed] [Google Scholar]
- 221.Osborne KA, Robichon A, Burgess E, Butland S, Shaw RA, Coulthard A, Pereira HS, Greenspan RJ, Sokolowski MB. Natural behavior polymorphism due to a cGMP-dependent protein kinase of Drosophila. Science. 1997;277:834–836. doi: 10.1126/science.277.5327.834. [DOI] [PubMed] [Google Scholar]
- 222.Osokine I, Hsu R, Loeb GB, McManus MT. Unintentional miRNA ablation is a risk factor in gene knockout studies: a short report. PLoS Genet. 2008;4:e34. doi: 10.1371/journal.pgen.0040034. [DOI] [PMC free article] [PubMed] [Google Scholar]
- 223.Ostrowski K, Hermann C, Bangash A, Schjerling P, Nielsen JN, Pedersen BK. A trauma-like elevation of plasma cytokines in humans in response to treadmill running. J Physiol. 1998;513 (Pt 3):889–894. doi: 10.1111/j.1469-7793.1998.889ba.x. [DOI] [PMC free article] [PubMed] [Google Scholar]
- 224.Palmer LJ, Jacobs KB, Elston RC. Haseman and Elston revisited: the effects of ascertainment and residual familial correlations on power to detect linkage. Genet Epidemiol. 2000;19:456–460. doi: 10.1002/1098-2272(200012)19:4<456::AID-GEPI15>3.0.CO;2-N. [DOI] [PubMed] [Google Scholar]
- 225.Palmieri L, Alberio S, Pisano I, Lodi T, Meznaric-Petrusa M, Zidar J, Santoro A, Scarcia P, Fontanesi F, Lamantea E, Ferrero I, Zeviani M. Complete loss-of-function of the heart/muscle-specific adenine nucleotide translocator is associated with mitochondrial myopathy and cardiomyopathy. Hum Mol Genet. 2005;14:3079–3088. doi: 10.1093/hmg/ddi341. [DOI] [PubMed] [Google Scholar]
- 226.Pantoja-Martinez J, Navarro Fernandez-Balbuena C, Gormaz-Moreno M, Quintans-Castro B, Esparza-Sanchez MA, Bonet-Arzo J. Myoadenylate deaminase deficiency in a child with myalgias induced by physical exercise. Rev Neurol. 2004;39:431–434. [PubMed] [Google Scholar]
- 227.Papadimitriou ID, Papadopoulos C, Kouvatsi A, Triantaphyllidis C. The ACTN3 gene in elite Greek track and field athletes. Int J Sports Med. 2008;29:352–355. doi: 10.1055/s-2007-965339. [DOI] [PubMed] [Google Scholar]
- 228.Pedersen BK, Steensberg A, Fischer C, Keller C, Keller P, Plomgaard P, Wolsk-Petersen E, Febbraio M. The metabolic role of IL-6 produced during exercise: is IL-6 an exercise factor? Proc Nutr Soc. 2004;63:263–267. doi: 10.1079/PNS2004338. [DOI] [PubMed] [Google Scholar]
- 229.Peeters MW, Thomis MA, Beunen GP, Malina RM. Genetics and sports: An overview of the pre-molecular biology era. Med Sport Sci. 2009;54:28–42. doi: 10.1159/000235695. [DOI] [PubMed] [Google Scholar]
- 230.Perusse L, Gagnon J, Province MA, Rao DC, Wilmore JH, Leon AS, Bouchard C, Skinner JS. Familial aggregation of submaximal aerobic performance in the HERITAGE Family study. Med Sci Sports Exerc. 2001;33:597–604. doi: 10.1097/00005768-200104000-00014. [DOI] [PubMed] [Google Scholar]
- 231.Perusse L, Leblanc C, Bouchard C. Familial resemblance in lifestyle components: results from the Canada Fitness Survey. Can J Public Health. 1988;79:201–205. [PubMed] [Google Scholar]
- 232.Perusse L, Leblanc C, Bouchard C. Inter-generation transmission of physical fitness in the Canadian population. Can J Sport Sci. 1988;13:8–14. [PubMed] [Google Scholar]
- 233.Perusse L, Lortie G, Leblanc C, Tremblay A, Theriault G, Bouchard C. Genetic and environmental sources of variation in physical fitness. Ann Hum Biol. 1987;14:425–434. doi: 10.1080/03014468700009241. [DOI] [PubMed] [Google Scholar]
- 234.Perusse L, Tremblay A, Leblanc C, Bouchard C. Genetic and environmental influences on level of habitual physical activity and exercise participation. Am J Epidemiol. 1989;129:1012–1022. doi: 10.1093/oxfordjournals.aje.a115205. [DOI] [PubMed] [Google Scholar]
- 235.Petersen EW, Carey AL, Sacchetti M, Steinberg GR, Macaulay SL, Febbraio MA, Pedersen BK. Acute IL-6 treatment increases fatty acid turnover in elderly humans in vivo and in tissue culture in vitro. Am J Physiol Endocrinol Metab. 2005;288:E155–162. doi: 10.1152/ajpendo.00257.2004. [DOI] [PubMed] [Google Scholar]
- 236.Petrella JK, Kim JS, Mayhew DL, Cross JM, Bamman MM. Potent myofiber hypertrophy during resistance training in humans is associated with satellite cell-mediated myonuclear addition: a cluster analysis. J Appl Physiol. 2008;104:1736–1742. doi: 10.1152/japplphysiol.01215.2007. [DOI] [PubMed] [Google Scholar]
- 237.Pette D, Vrbova G. Adaptation of mammalian skeletal muscle fibers to chronic electrical stimulation. Rev Physiol Biochem Pharmacol. 1992;120:115–202. doi: 10.1007/BFb0036123. [DOI] [PubMed] [Google Scholar]
- 238.Pietilainen KH, Bergholm R, Rissanen A, Kaprio J, Hakkinen AM, Sattar N, Yki-Jarvinen H. Effects of acquired obesity on endothelial function in monozygotic twins. Obesity (Silver Spring) 2006;14:826–837. doi: 10.1038/oby.2006.96. [DOI] [PubMed] [Google Scholar]
- 239.Pietilainen KH, Kannisto K, Korsheninnikova E, Rissanen A, Kaprio J, Ehrenborg E, Hamsten A, Yki-Jarvinen H. Acquired obesity increases CD68 and tumor necrosis factor-alpha and decreases adiponectin gene expression in adipose tissue: a study in monozygotic twins. J Clin Endocrinol Metab. 2006;91:2776–2781. doi: 10.1210/jc.2005-2848. [DOI] [PubMed] [Google Scholar]
- 240.Pietilainen KH, Naukkarinen J, Rissanen A, Saharinen J, Ellonen P, Keranen H, Suomalainen A, Gotz A, Suortti T, Yki-Jarvinen H, Oresic M, Kaprio J, Peltonen L. Global transcript profiles of fat in monozygotic twins discordant for BMI: Pathways behind acquired obesity. PLoS Medicine. 2008;5:472–483. doi: 10.1371/journal.pmed.0050051. [DOI] [PMC free article] [PubMed] [Google Scholar]
- 241.Pietilainen KH, Rissanen A, Kaprio J, Makimattila S, Hakkinen AM, Westerbacka J, Sutinen J, Vehkavaara S, Yki-Jarvinen H. Acquired obesity is associated with increased liver fat, intra-abdominal fat, and insulin resistance in young adult monozygotic twins. Am J Physiol Endocrinol Metab. 2005;288:E768–E774. doi: 10.1152/ajpendo.00381.2004. [DOI] [PubMed] [Google Scholar]
- 242.Pietilainen KH, Sysi-Aho M, Rissanen A, Seppanen-Laakso T, Yki-Jarvinen H, Kaprio J, Oresic M. Acquired obesity is associated with changes in the serum lipidomic profile independent of genetic effects - a monozygotic twin study. PLoS ONE. 2007;2 doi: 10.1371/journal.pone.0000218. [DOI] [PMC free article] [PubMed] [Google Scholar]
- 243.Pollock ML, Franklin BA, Balady GJ, Chaitman BL, Fleg JL, Fletcher B, Limacher M, Pina IL, Stein RA, Williams M, Bazzarre T. AHA Science Advisory. Resistance exercise in individuals with and without cardiovascular disease: benefits, rationale, safety, and prescription: An advisory from the Committee on Exercise, Rehabilitation, and Prevention, Council on Clinical Cardiology, American Heart Association; Position paper endorsed by the American College of Sports Medicine. Circulation. 2000;101:828–833. doi: 10.1161/01.cir.101.7.828. [DOI] [PubMed] [Google Scholar]
- 244.Potthoff MJ, Wu H, Arnold MA, Shelton JM, Backs J, McAnally J, Richardson JA, Bassel-Duby R, Olson EN. Histone deacetylase degradation and MEF2 activation promote the formation of slow-twitch myofibers. J Clin Invest. 2007;117:2459–2467. doi: 10.1172/JCI31960. [DOI] [PMC free article] [PubMed] [Google Scholar]
- 245.Province MA, Rice TK, Borecki IB, Gu C, Kraja A, Rao DC. Multivariate and multilocus variance components method, based on structural relationships to assess quantitative trait linkage via SEGPATH. Genet Epidemiol. 2003;24:128–138. doi: 10.1002/gepi.10208. [DOI] [PubMed] [Google Scholar]
- 246.Prud’homme D, Bouchard C, Leblanc C, Landry F, Fontaine E. Sensitivity of maximal aerobic power to training is genotype-dependent. Med Sci Sports Exerc. 1984;16:489–493. doi: 10.1249/00005768-198410000-00012. [DOI] [PubMed] [Google Scholar]
- 247.Pulkes T, Liolitsa D, Eunson LH, Rose M, Nelson IP, Rahman S, Poulton J, Marchington DR, Landon DN, Debono AG, Morgan-Hughes JA, Hanna MG. New phenotypic diversity associated with the mitochondrial tRNA(SerUCN) gene mutation. Neuromuscul Disord. 2005;15:364–371. doi: 10.1016/j.nmd.2005.01.006. [DOI] [PubMed] [Google Scholar]
- 248.Pulkes T, Siddiqui A, Morgan-Hughes JA, Hanna MG. A novel mutation in the mitochondrial tRNA(TYr) gene associated with exercise intolerance. Neurology. 2000;55:1210–1212. doi: 10.1212/wnl.55.8.1210. [DOI] [PubMed] [Google Scholar]
- 249.Purcell S, Neale B, Todd-Brown K, Thomas L, Ferreira MA, Bender D, Maller J, Sklar P, de Bakker PI, Daly MJ, Sham PC. PLINK: a tool set for whole-genome association and population-based linkage analyses. Am J Hum Genet. 2007;81:559–575. doi: 10.1086/519795. [DOI] [PMC free article] [PubMed] [Google Scholar]
- 250.Qi L, van Dam RM, Meigs JB, Manson JE, Hunter D, Hu FB. Genetic variation in IL6 gene and type 2 diabetes: tagging-SNP haplotype analysis in large-scale case-control study and meta-analysis. Hum Mol Genet. 2006;15:1914–1920. doi: 10.1093/hmg/ddl113. [DOI] [PubMed] [Google Scholar]
- 251.Radom-Aizik S, Hayek S, Shahar I, Rechavi G, Kaminski N, Ben-Dov I. Effects of aerobic training on gene expression in skeletal muscle of elderly men. Med Sci Sports Exerc. 2005;37:1680–1696. doi: 10.1249/01.mss.0000181838.96815.4d. [DOI] [PubMed] [Google Scholar]
- 252.Rankinen T, An P, Perusse L, Rice T, Chagnon YC, Gagnon J, Leon AS, Skinner JS, Wilmore JH, Rao DC, Bouchard C. Genome-wide linkage scan for exercise stroke volume and cardiac output in the HERITAGE Family Study. Physiol Genomics. 2002;10:57–62. doi: 10.1152/physiolgenomics.00043.2002. [DOI] [PubMed] [Google Scholar]
- 253.Rankinen T, Argyropoulos G, Rice T, Rao DC, Bouchard C. CREB1 is a strong genetic predictor of the variation in exercise heart rate response to regular exercise: the HERITAGE Family Study. Circ Cardiovasc Genet. 2010;3:294–299. doi: 10.1161/CIRCGENETICS.109.925644. [DOI] [PMC free article] [PubMed] [Google Scholar]
- 254.Rankinen T, Bouchard C. Genes, Genetic Heterogeneity, and Exercise Phenotypes. In: Mooren FC, Volker K, editors. Molecular and Cellular Exercise Physiology. Champaign, IL: Human Kinetics; 2005. pp. 39–54. [Google Scholar]
- 255.Rankinen T, Bouchard C. Genetics of physical activity. In: Clement K, Sorensen TIA, editors. Obesity. Genomics and Postgenomics. New York, NY: Informa Healthcare USA, Inc; 2008. pp. 277–286. [Google Scholar]
- 256.Rankinen T, Bouchard C, Rao DC. Familial resemblance for muscle phenotypes: The HERITAGE family study. Med Sci Sports Exer. 2005;37:2017–2017. doi: 10.1249/01.MSS.0000079031.22755.63. [DOI] [PubMed] [Google Scholar]
- 257.Rankinen T, Gagnon J, Perusse L, Chagnon Y, Rice T, Leon A, Skinner J, Wilmore J, Rao D, Bouchard C. AGT M235T and ACE ID polymorphisms and exercise blood pressure in the HERITAGE Family Study. Am J Physiol Heart Circ Physiol. 2000;279:H368–374. doi: 10.1152/ajpheart.2000.279.1.H368. [DOI] [PubMed] [Google Scholar]
- 258.Rankinen T, Roth SM, Bray MS, Loos R, Perusse L, Wolfarth B, Hagberg JM, Bouchard C. Advances in exercise, fitness, and performance genomics. Med Sci Sports Exerc. 2010;42:835–846. doi: 10.1249/MSS.0b013e3181d86cec. [DOI] [PubMed] [Google Scholar]
- 259.Rauramaa R, Kuhanen R, Lakka TA, Vaisanen SB, Halonen P, Alen M, Rankinen T, Bouchard C. Physical exercise and blood pressure with reference to the angiotensinogen M235T polymorphism. Physiol Genomics. 2002;10:71–77. doi: 10.1152/physiolgenomics.00050.2002. [DOI] [PubMed] [Google Scholar]
- 260.Reynisdottir I, Thorleifsson G, Benediktsson R, Sigurdsson G, Emilsson V, Einarsdottir AS, Hjorleifsdottir EE, Orlygsdottir GT, Bjornsdottir GT, Saemundsdottir J, Halldorsson S, Hrafnkelsdottir S, Sigurjonsdottir SB, Steinsdottir S, Martin M, Kochan JP, Rhees BK, Grant SF, Frigge ML, Kong A, Gudnason V, Stefansson K, Gulcher JR. Localization of a susceptibility gene for type 2 diabetes to chromosome 5q34-q35.2. Am J Hum Genet. 2003;73:323–335. doi: 10.1086/377139. [DOI] [PMC free article] [PubMed] [Google Scholar]
- 261.Rezende EL, Garland T, Jr, Chappell MA, Malisch JL, Gomes FR. Maximum aerobic performance in lines of Mus selected for high wheel-running activity: effects of selection, oxygen availability and the mini-muscle phenotype. J Exp Biol. 2006;209:115–127. doi: 10.1242/jeb.01883. [DOI] [PubMed] [Google Scholar]
- 262.Rezende EL, Gomes FR, Malisch JL, Chappell MA, Garland T., Jr Maximal oxygen consumption in relation to subordinate traits in lines of house mice selectively bred for high voluntary wheel running. J Appl Physiol. 2006;101:477–485. doi: 10.1152/japplphysiol.00042.2006. [DOI] [PubMed] [Google Scholar]
- 263.Richardson RS, Wagner H, Mudaliar SR, Henry R, Noyszewski EA, Wagner PD. Human VEGF gene expression in skeletal muscle: effect of acute normoxic and hypoxic exercise. Am J Physiol. 1999;277:H2247–2252. doi: 10.1152/ajpheart.1999.277.6.H2247. [DOI] [PubMed] [Google Scholar]
- 264.Richardson RS, Wagner H, Mudaliar SR, Saucedo E, Henry R, Wagner PD. Exercise adaptation attenuates VEGF gene expression in human skeletal muscle. Am J Physiol Heart Circ Physiol. 2000;279:H772–778. doi: 10.1152/ajpheart.2000.279.2.H772. [DOI] [PubMed] [Google Scholar]
- 265.Rico-Sanz J, Rankinen T, Joanisse DR, Leon AS, Skinner JS, Wilmore JH, Rao DC, Bouchard C. Familial resemblance for muscle phenotypes in the HERITAGE Family Study. Med Sci Sports Exerc. 2003;35:1360–1366. doi: 10.1249/01.MSS.0000079031.22755.63. [DOI] [PubMed] [Google Scholar]
- 266.Rico-Sanz J, Rankinen T, Rice T, Leon AS, Skinner JS, Wilmore JH, Rao DC, Bouchard C. Quantitative trait loci for maximal exercise capacity phenotypes and their responses to training in the HERITAGE Family Study. Physiol Genomics. 2004;16:256–260. doi: 10.1152/physiolgenomics.00035.2003. [DOI] [PubMed] [Google Scholar]
- 267.Rios J, Stein E, Shendure J, Hobbs HH, Cohen JC. Identification by whole-genome resequencing of gene defect responsible for severe hypercholesterolemia. Hum Mol Genet. 2010 doi: 10.1093/hmg/ddq352. [DOI] [PMC free article] [PubMed] [Google Scholar]
- 268.Risch N. Linkage strategies for genetically complex traits. I. Multilocus models. Am J Hum Genet. 1990;46:222–228. [PMC free article] [PubMed] [Google Scholar]
- 269.Rivadeneira F, Styrkarsdottir U, Estrada K, Halldorsson BV, Hsu YH, Richards JB, Zillikens MC, Kavvoura FK, Amin N, Aulchenko YS, Cupples LA, Deloukas P, Demissie S, Grundberg E, Hofman A, Kong A, Karasik D, van Meurs JB, Oostra B, Pastinen T, Pols HA, Sigurdsson G, Soranzo N, Thorleifsson G, Thorsteinsdottir U, Williams FM, Wilson SG, Zhou Y, Ralston SH, van Duijn CM, Spector T, Kiel DP, Stefansson K, Ioannidis JP, Uitterlinden AG. Twenty bone-mineral-density loci identified by large-scale meta-analysis of genome-wide association studies. Nat Genet. 2009;41:1199–1206. doi: 10.1038/ng.446. [DOI] [PMC free article] [PubMed] [Google Scholar]
- 270.Ronnemaa T, Koskenvuo M, Marniemi J, Koivunen T, Sajantila A, Rissanen A, Kaitsaari M, Bouchard C, Kaprio J. Glucose metabolism in identical twins discordant for obesity. The critical role of visceral fat. J Clin Endocrinol Metab. 1997;82:383–387. doi: 10.1210/jcem.82.2.3763. [DOI] [PubMed] [Google Scholar]
- 271.Ronnemaa T, Marniemi J, Savolainen MJ, Kesaniemi YA, Ehnholm C, Bouchard C, Koskenvuo M. Serum lipids, lipoproteins, and lipid metabolizing enzymes in identical twins discordant for obesity. J Clin Endocrinol Metab. 1998;83:2792–2799. doi: 10.1210/jcem.83.8.4998. [DOI] [PubMed] [Google Scholar]
- 272.Rose AJ, Kiens B, Richter EA. Ca2+-calmodulin-dependent protein kinase expression and signalling in skeletal muscle during exercise. J Physiol. 2006;574:889–903. doi: 10.1113/jphysiol.2006.111757. [DOI] [PMC free article] [PubMed] [Google Scholar]
- 273.Rosen MR, Cohen IS. Cardiac memory … new insights into molecular mechanisms. J Physiol. 2006;570:209–218. doi: 10.1113/jphysiol.2005.097873. [DOI] [PMC free article] [PubMed] [Google Scholar]
- 274.Roth SM, Walsh S, Liu D, Metter EJ, Ferrucci L, Hurley BF. The ACTN3 R577X nonsense allele is under-represented in elite-level strength athletes. Eur J Hum Genet. 2008;16:391–394. doi: 10.1038/sj.ejhg.5201964. [DOI] [PMC free article] [PubMed] [Google Scholar]
- 275.Rung J, Cauchi S, Albrechtsen A, Shen L, Rocheleau G, Cavalcanti-Proenca C, Bacot F, Balkau B, Belisle A, Borch-Johnsen K, Charpentier G, Dina C, Durand E, Elliott P, Hadjadj S, Jarvelin MR, Laitinen J, Lauritzen T, Marre M, Mazur A, Meyre D, Montpetit A, Pisinger C, Posner B, Poulsen P, Pouta A, Prentki M, Ribel-Madsen R, Ruokonen A, Sandbaek A, Serre D, Tichet J, Vaxillaire M, Wojtaszewski JF, Vaag A, Hansen T, Polychronakos C, Pedersen O, Froguel P, Sladek R. Genetic variant near IRS1 is associated with type 2 diabetes, insulin resistance and hyperinsulinemia. Nat Genet. 2009;41:1110–1115. doi: 10.1038/ng.443. [DOI] [PubMed] [Google Scholar]
- 276.Sandilands AJ, Parameshwar J, Large S, Brown MJ, O’Shaughnessy KM. Confirmation of a role for the 389R>G beta-1 adrenoceptor polymorphism on exercise capacity in heart failure. Heart. 2005;91:1613–1614. doi: 10.1136/hrt.2004.047282. [DOI] [PMC free article] [PubMed] [Google Scholar]
- 277.Santiago C, Gonzalez-Freire M, Serratosa L, Morate FJ, Meyer T, Gomez-Gallego F, Lucia A. ACTN3 genotype in professional soccer players. Br J Sports Med. 2007 doi: 10.1136/bjsm.2007.039172. [DOI] [PubMed] [Google Scholar]
- 278.Saunders CJ, September AV, Xenophontos SL, Cariolou MA, Anastassiades LC, Noakes TD, Collins M. No association of the ACTN3 gene R577X polymorphism with endurance performance in Ironman Triathlons. Ann Hum Genet. 2007;71:777–781. doi: 10.1111/j.1469-1809.2006.00385.x. [DOI] [PubMed] [Google Scholar]
- 279.Saxena R, Voight BF, Lyssenko V, Burtt NP, de Bakker PI, Chen H, Roix JJ, Kathiresan S, Hirschhorn JN, Daly MJ, Hughes TE, Groop L, Altshuler D, Almgren P, Florez JC, Meyer J, Ardlie K, Bengtsson Bostrom K, Isomaa B, Lettre G, Lindblad U, Lyon HN, Melander O, Newton-Cheh C, Nilsson P, Orho-Melander M, Rastam L, Speliotes EK, Taskinen MR, Tuomi T, Guiducci C, Berglund A, Carlson J, Gianniny L, Hackett R, Hall L, Holmkvist J, Laurila E, Sjogren M, Sterner M, Surti A, Svensson M, Tewhey R, Blumenstiel B, Parkin M, Defelice M, Barry R, Brodeur W, Camarata J, Chia N, Fava M, Gibbons J, Handsaker B, Healy C, Nguyen K, Gates C, Sougnez C, Gage D, Nizzari M, Gabriel SB, Chirn GW, Ma Q, Parikh H, Richardson D, Ricke D, Purcell S. Genome-wide association analysis identifies loci for type 2 diabetes and triglyceride levels. Science. 2007;316:1331–1336. doi: 10.1126/science.1142358. [DOI] [PubMed] [Google Scholar]
- 280.Scheele C, Larsson O, Timmons JA. Using functional genomics to study PINK1 and metabolic physiology. Methods Enzymol. 2009;457:211–229. doi: 10.1016/S0076-6879(09)05012-5. [DOI] [PubMed] [Google Scholar]
- 281.Schjerve IE, Tyldum GA, Tjonna AE, Stolen T, Loennechen JP, Hansen HE, Haram PM, Heinrich G, Bye A, Najjar SM, Smith GL, Slordahl SA, Kemi OJ, Wisloff U. Both aerobic endurance and strength training programmes improve cardiovascular health in obese adults. Clin Sci (Lond) 2008;115:283–293. doi: 10.1042/CS20070332. [DOI] [PubMed] [Google Scholar]
- 282.Schmutz S, Dapp C, Wittwer M, Vogt M, Hoppeler H, Fluck M. Endurance training modulates the muscular transcriptome response to acute exercise. Pflugers Arch. 2006;451:678–687. doi: 10.1007/s00424-005-1497-0. [DOI] [PubMed] [Google Scholar]
- 283.Scholte HR, Van Coster RN, de Jonge PC, Poorthuis BJ, Jeneson JA, Andresen BS, Gregersen N, de Klerk JB, Busch HF. Myopathy in very-long-chain acyl-CoA dehydrogenase deficiency: clinical and biochemical differences with the fatal cardiac phenotype. Neuromuscul Disord. 1999;9:313–319. doi: 10.1016/s0960-8966(99)00032-2. [DOI] [PubMed] [Google Scholar]
- 284.Schuelke M, Krude H, Finckh B, Mayatepek E, Janssen A, Schmelz M, Trefz F, Trijbels F, Smeitink J. Septo-optic dysplasia associated with a new mitochondrial cytochrome b mutation. Ann Neurol. 2002;51:388–392. doi: 10.1002/ana.10151. [DOI] [PubMed] [Google Scholar]
- 285.Schuelke M, Wagner KR, Stolz LE, Hubner C, Riebel T, Komen W, Braun T, Tobin JF, Lee SJ. Myostatin mutation associated with gross muscle hypertrophy in a child. N Engl J Med. 2004;350:2682–2688. doi: 10.1056/NEJMoa040933. [DOI] [PubMed] [Google Scholar]
- 286.Scott LJ, Mohlke KL, Bonnycastle LL, Willer CJ, Li Y, Duren WL, Erdos MR, Stringham HM, Chines PS, Jackson AU, Prokunina-Olsson L, Ding CJ, Swift AJ, Narisu N, Hu T, Pruim R, Xiao R, Li XY, Conneely KN, Riebow NL, Sprau AG, Tong M, White PP, Hetrick KN, Barnhart MW, Bark CW, Goldstein JL, Watkins L, Xiang F, Saramies J, Buchanan TA, Watanabe RM, Valle TT, Kinnunen L, Abecasis GR, Pugh EW, Doheny KF, Bergman RN, Tuomilehto J, Collins FS, Boehnke M. A genome-wide association study of type 2 diabetes in Finns detects multiple susceptibility variants. Science. 2007;316:1341–1345. doi: 10.1126/science.1142382. [DOI] [PMC free article] [PubMed] [Google Scholar]
- 287.Scott RA, Irving R, Irwin L, Morrison E, Charlton V, Austin K, Tladi D, Deason M, Headley SA, Kolkhorst FW, Yang N, North K, Pitsiladis YP. ACTN3 and ACE genotypes in elite Jamaican and US sprinters. Med Sci Sports Exerc. 2010;42:107–112. doi: 10.1249/MSS.0b013e3181ae2bc0. [DOI] [PubMed] [Google Scholar]
- 288.Segal-Lieberman G, Bradley RL, Kokkotou E, Carlson M, Trombly DJ, Wang X, Bates S, Myers MG, Jr, Flier JS, Maratos-Flier E. Melanin-concentrating hormone is a critical mediator of the leptin-deficient phenotype. Proc Natl Acad Sci U S A. 2003;100:10085–10090. doi: 10.1073/pnas.1633636100. [DOI] [PMC free article] [PubMed] [Google Scholar]
- 289.Seneca S, Goemans N, Van Coster R, Givron P, Reybrouck T, Sciot R, Meulemans A, Smet J, Van Hove JL. A mitochondrial tRNA aspartate mutation causing isolated mitochondrial myopathy. Am J Med Genet A. 2005;137:170–175. doi: 10.1002/ajmg.a.30854. [DOI] [PubMed] [Google Scholar]
- 290.Shaham O, Wei R, Wang TJ, Ricciardi C, Lewis GD, Vasan RS, Carr SA, Thadhani R, Gerszten RE, Mootha VK. Metabolic profiling of the human response to a glucose challenge reveals distinct axes of insulin sensitivity. Mol Syst Biol. 2008;4:214. doi: 10.1038/msb.2008.50. [DOI] [PMC free article] [PubMed] [Google Scholar]
- 291.Sherman JB, Raben N, Nicastri C, Argov Z, Nakajima H, Adams EM, Eng CM, Cowan TM, Plotz PH. Common mutations in the phosphofructokinase-M gene in Ashkenazi Jewish patients with glycogenesis VII--and their population frequency. Am J Hum Genet. 1994;55:305–313. [PMC free article] [PubMed] [Google Scholar]
- 292.Silventoinen K, Magnusson PK, Tynelius P, Kaprio J, Rasmussen F. Heritability of body size and muscle strength in young adulthood: a study of one million Swedish men. Genet Epidemiol. 2008;32:341–349. doi: 10.1002/gepi.20308. [DOI] [PubMed] [Google Scholar]
- 293.Simoneau JA, Bouchard C. Genetic determinism of fiber type proportion in human skeletal muscle. FASEB J. 1995;9:1091–1095. doi: 10.1096/fasebj.9.11.7649409. [DOI] [PubMed] [Google Scholar]
- 294.Simoneau JA, Bouchard C. Human variation in skeletal muscle fiber-type proportion and enzyme activities. Am J Physiol. 1989;257:E567–572. doi: 10.1152/ajpendo.1989.257.4.E567. [DOI] [PubMed] [Google Scholar]
- 295.Simoneau JA, Lortie G, Boulay MR, Thibault MC, Bouchard C. Repeatability of fibre type and enzyme activity measurements in human skeletal muscle. Clin Physiol. 1986;6:347–356. doi: 10.1111/j.1475-097x.1986.tb00240.x. [DOI] [PubMed] [Google Scholar]
- 296.Simonen RL, Perusse L, Rankinen T, Rice T, Rao DC, Bouchard C. Familial aggregation of physical activity levels in the Quebec family study. Med Sci Sports Exer. 2002;34:1137–1142. doi: 10.1097/00005768-200207000-00014. [DOI] [PubMed] [Google Scholar]
- 297.Simonen RL, Rankinen T, Perusse L, Leon AS, Skinner JS, Wilmore JH, Rao DC, Bouchard C. A dopamine D2 receptor gene polymorphism and physical activity in two family studies. Physiol Behav. 2003;78:751–757. doi: 10.1016/s0031-9384(03)00084-2. [DOI] [PubMed] [Google Scholar]
- 298.Simonen RL, Rankinen T, Perusse L, Rice T, Rao DC, Chagnon Y, Bouchard C. Genome-wide linkage scan for physical activity levels in the Quebec Family study. Med Sci Sports Exerc. 2003;35:1355–1359. doi: 10.1249/01.MSS.0000078937.22939.7E. [DOI] [PubMed] [Google Scholar]
- 299.Sladek R, Rocheleau G, Rung J, Dina C, Shen L, Serre D, Boutin P, Vincent D, Belisle A, Hadjadj S, Balkau B, Heude B, Charpentier G, Hudson TJ, Montpetit A, Pshezhetsky AV, Prentki M, Posner BI, Balding DJ, Meyre D, Polychronakos C, Froguel P. A genome-wide association study identifies novel risk loci for type 2 diabetes. Nature. 2007;445:881–885. doi: 10.1038/nature05616. [DOI] [PubMed] [Google Scholar]
- 300.Slentz CA, Tanner CJ, Bateman LA, Durheim MT, Huffman KM, Houmard JA, Kraus WE. Effects of exercise training intensity on pancreatic beta-cell function. Diabetes Care. 2009;32:1807–1811. doi: 10.2337/dc09-0032. [DOI] [PMC free article] [PubMed] [Google Scholar]
- 301.Sonne MP, Scheede-Bergdahl C, Olsen DB, Hojbjerre L, Alibegovic A, Nielsen NB, Stallknecht B, Helge JW, Vaag A, Dela F. Effects of physical training on endothelial function and limb blood flow in type 2 diabetes. Appl Physiol Nutr Metab. 2007;32:936–941. doi: 10.1139/H07-103. [DOI] [PubMed] [Google Scholar]
- 302.Spencer-Jones NJ, Ge D, Snieder H, Perks U, Swaminathan R, Spector TD, Carter ND, O’Dell SD. AMP-kinase alpha2 subunit gene PRKAA2 variants are associated with total cholesterol, low-density lipoprotein-cholesterol and high-density lipoprotein-cholesterol in normal women. J Med Genet. 2006;43:936–942. doi: 10.1136/jmg.2006.041988. [DOI] [PMC free article] [PubMed] [Google Scholar]
- 303.Spielman RS, McGinnis RE, Ewens WJ. Transmission test for linkage disequilibrium: the insulin gene region and insulin-dependent diabetes mellitus (IDDM) Am J Hum Genet. 1993;52:506–516. [PMC free article] [PubMed] [Google Scholar]
- 304.Spielmann N, Leon AS, Rao DC, Rice T, Skinner JS, Rankinen T, Bouchard C. Genome-wide linkage scan for submaximal exercise heart rate in the HERITAGE family study. Am J Physiol Heart Circ Physiol. 2007;293:H3366–3371. doi: 10.1152/ajpheart.00042.2007. [DOI] [PubMed] [Google Scholar]
- 305.Steensberg A, Fischer CP, Sacchetti M, Keller C, Osada T, Schjerling P, van Hall G, Febbraio MA, Pedersen BK. Acute interleukin-6 administration does not impair muscle glucose uptake or whole-body glucose disposal in healthy humans. J Physiol. 2003;548:631–638. doi: 10.1113/jphysiol.2002.032938. [DOI] [PMC free article] [PubMed] [Google Scholar]
- 306.Steensberg A, Keller C, Hillig T, Frosig C, Wojtaszewski JF, Pedersen BK, Pilegaard H, Sander M. Nitric oxide production is a proximal signaling event controlling exercise-induced mRNA expression in human skeletal muscle. FASEB J. 2007;21:2683–2694. doi: 10.1096/fj.06-7477com. [DOI] [PubMed] [Google Scholar]
- 307.Steensberg A, van Hall G, Osada T, Sacchetti M, Saltin B, Klarlund Pedersen B. Production of interleukin-6 in contracting human skeletal muscles can account for the exercise-induced increase in plasma interleukin-6. J Physiol. 2000;529(Pt 1):237–242. doi: 10.1111/j.1469-7793.2000.00237.x. [DOI] [PMC free article] [PubMed] [Google Scholar]
- 308.Stefan N, Vozarova B, Del Parigi A, Ossowski V, Thompson DB, Hanson RL, Ravussin E, Tataranni PA. The Gln223Arg polymorphism of the leptin receptor in Pima Indians: influence on energy expenditure, physical activity and lipid metabolism. Int J Obes Relat Metab Disord. 2002;26:1629–1632. doi: 10.1038/sj.ijo.0802161. [DOI] [PubMed] [Google Scholar]
- 309.Steinthorsdottir V, Thorleifsson G, Reynisdottir I, Benediktsson R, Jonsdottir T, Walters GB, Styrkarsdottir U, Gretarsdottir S, Emilsson V, Ghosh S, Baker A, Snorradottir S, Bjarnason H, Ng MC, Hansen T, Bagger Y, Wilensky RL, Reilly MP, Adeyemo A, Chen Y, Zhou J, Gudnason V, Chen G, Huang H, Lashley K, Doumatey A, So WY, Ma RC, Andersen G, Borch-Johnsen K, Jorgensen T, van Vliet-Ostaptchouk JV, Hofker MH, Wijmenga C, Christiansen C, Rader DJ, Rotimi C, Gurney M, Chan JC, Pedersen O, Sigurdsson G, Gulcher JR, Thorsteinsdottir U, Kong A, Stefansson K. A variant in CDKAL1 influences insulin response and risk of type 2 diabetes. Nat Genet. 2007;39:770–775. doi: 10.1038/ng2043. [DOI] [PubMed] [Google Scholar]
- 310.Stephens JW, Hurel SJ, Lowe GD, Rumley A, Humphries SE. Association between plasma IL-6, the IL6 -174G>C gene variant and the metabolic syndrome in type 2 diabetes mellitus. Mol Genet Metab. 2007;90:422–428. doi: 10.1016/j.ymgme.2006.10.004. [DOI] [PubMed] [Google Scholar]
- 311.Stephens NA, Gallagher IJ, Rooyackers O, Skipworth RJ, Tan BH, Marstrand T, Ross JA, Guttridge DC, Lundell L, Fearon KC, Timmons JA. Using transcriptomics to identify and validate novel biomarkers of human skeletal muscle cancer cachexia. Genome Med. 2:1. doi: 10.1186/gm122. [DOI] [PMC free article] [PubMed] [Google Scholar]
- 312.Stepto NK, Coffey VG, Carey AL, Ponnampalam AP, Canny BJ, Powell D, Hawley JA. Global gene expression in skeletal muscle from well-trained strength and endurance athletes. Med Sci Sports Exerc. 2009;41:546–565. doi: 10.1249/MSS.0b013e31818c6be9. [DOI] [PubMed] [Google Scholar]
- 313.Strachan T, Read AP. Human Molecular Genetics. New York: Garland Science/Taylor & Francis Group; 2011. [Google Scholar]
- 314.Stubbe JH, Boomsma DI, Vink JM, Cornes BK, Martin NG, Skytthe A, Kyvik KO, Rose RJ, Kujala UM, Kaprio J, Harris JR, Pedersen NL, Hunkin J, Spector TD, de Geus EJ. Genetic influences on exercise participation in 37.051 twin pairs from seven countries. PLoS ONE. 2006;1:e22. doi: 10.1371/journal.pone.0000022. [DOI] [PMC free article] [PubMed] [Google Scholar]
- 315.Sugie H, Sugie Y, Ito M, Fukuda T. A novel missense mutation (837T-->C) in the phosphoglycerate kinase gene of a patient with a myopathic form of phosphoglycerate kinase deficiency. J Child Neurol. 1998;13:95–97. doi: 10.1177/088307389801300212. [DOI] [PubMed] [Google Scholar]
- 316.Sundet JM, Magnus P, Tambs K. The heritability of maximal aerobic power: a study of Norwegian twins. Scand J Med Sci Sports. 1994;4:181–185. [Google Scholar]
- 317.Swan H, Piippo K, Viitasalo M, Heikkila P, Paavonen T, Kainulainen K, Kere J, Keto P, Kontula K, Toivonen L. Arrhythmic disorder mapped to chromosome 1q42-q43 causes malignant polymorphic ventricular tachycardia in structurally normal hearts. J Am Coll Cardiol. 1999;34:2035–2042. doi: 10.1016/s0735-1097(99)00461-1. [DOI] [PubMed] [Google Scholar]
- 318.Taggart RT, Smail D, Apolito C, Vladutiu GD. Novel mutations associated with carnitine palmitoyltransferase II deficiency. Hum Mutat. 1999;13:210–220. doi: 10.1002/(SICI)1098-1004(1999)13:3<210::AID-HUMU5>3.0.CO;2-0. [DOI] [PubMed] [Google Scholar]
- 319.Takeda H, Charlier C, Farnir F, Georges M. Demonstrating polymorphic miRNA-mediated gene regulation in vivo: application to the g+6223G->A mutation of Texel sheep. RNA. 2010;16:1854–1863. doi: 10.1261/rna.2131110. [DOI] [PMC free article] [PubMed] [Google Scholar]
- 320.Tang W, Arnett DK, Devereux RB, Panagiotou D, Province MA, Miller MB, de Simone G, Gu C, Ferrell RE. Identification of a novel 5-base pair deletion in calcineurin B (PPP3R1) promoter region and its association with left ventricular hypertrophy. Am Heart J. 2005;150:845–851. doi: 10.1016/j.ahj.2004.12.004. [DOI] [PubMed] [Google Scholar]
- 321.Taroni F, Verderio E, Dworzak F, Willems PJ, Cavadini P, DiDonato S. Identification of a common mutation in the carnitine palmitoyltransferase II gene in familial recurrent myoglobinuria patients. Nat Genet. 1993;4:314–320. doi: 10.1038/ng0793-314. [DOI] [PubMed] [Google Scholar]
- 322.Teran-Garcia M, Rankinen T, Koza RA, Rao DC, Bouchard C. Endurance training-induced changes in insulin sensitivity and gene expression. Am J Physiol Endocrinol Metab. 2005;288:E1168–1178. doi: 10.1152/ajpendo.00467.2004. [DOI] [PubMed] [Google Scholar]
- 323.Teran-Garcia M, Rankinen T, Rice T, Leon AS, Rao DC, Skinner JS, Bouchard C. Variations in the four and a half LIM domains 1 gene (FHL1) are associated with fasting insulin and insulin sensitivity responses to regular exercise. Diabetologia. 2007;50:1858–1866. doi: 10.1007/s00125-007-0733-x. [DOI] [PubMed] [Google Scholar]
- 324.Thomas KR, Capecchi MR. Targeted disruption of the murine int-1 proto-oncogene resulting in severe abnormalities in midbrain and cerebellar development. Nature. 1990;346:847–850. doi: 10.1038/346847a0. [DOI] [PubMed] [Google Scholar]
- 325.Thompson PD, Tsongalis GJ, Seip RL, Bilbie C, Miles M, Zoeller R, Visich P, Gordon P, Angelopoulos TJ, Pescatello L, Bausserman L, Moyna N. Apolipoprotein E genotype and changes in serum lipids and maximal oxygen uptake with exercise training. Metabolism. 2004;53:193–202. doi: 10.1016/j.metabol.2003.09.010. [DOI] [PubMed] [Google Scholar]
- 326.Tiainen KM, Perola M, Kovanen VM, Sipila S, Tuononen KA, Rikalainen K, Kauppinen MA, Widen EI, Kaprio J, Rantanen T, Kujala UM. Genetics of maximal walking speed and skeletal muscle characteristics in older women. Twin Res Hum Genet. 2008;11:321–334. doi: 10.1375/twin.11.3.321. [DOI] [PubMed] [Google Scholar]
- 327.Timmons JA, Jansson E, Fischer H, Gustafsson T, Greenhaff PL, Ridden J, Rachman J, Sundberg CJ. Modulation of extracellular matrix genes reflects the magnitude of physiological adaptation to aerobic exercise training in humans. BMC Biol. 2005;3:19. doi: 10.1186/1741-7007-3-19. [DOI] [PMC free article] [PubMed] [Google Scholar]
- 328.Timmons JA, Knudsen S, Rankinen T, Koch LG, Sarzynski M, Jensen T, Keller P, Scheele C, Vollaard NB, Nielsen S, Akerstrom T, MacDougald OA, Jansson E, Greenhaff PL, Tarnopolsky MA, van Loon LJ, Pedersen BK, Sundberg CJ, Wahlestedt C, Britton SL, Bouchard C. Using molecular classification to predict gains in maximal aerobic capacity following endurance exercise training in humans. J Appl Physiol. 2010;108:1487–1496. doi: 10.1152/japplphysiol.01295.2009. [DOI] [PMC free article] [PubMed] [Google Scholar]
- 329.Timmons JA, Larsson O, Jansson E, Fischer H, Gustafsson T, Greenhaff PL, Ridden J, Rachman J, Peyrard-Janvid M, Wahlestedt C, Sundberg CJ. Human muscle gene expression responses to endurance training provide a novel perspective on Duchenne muscular dystrophy. FASEB J. 2005;19:750–760. doi: 10.1096/fj.04-1980com. [DOI] [PubMed] [Google Scholar]
- 330.Timmons JA, Norrbom J, Scheele C, Thonberg H, Wahlestedt C, Tesch P. Expression profiling following local muscle inactivity in humans provides new perspective on diabetes-related genes. Genomics. 2006;87:165–172. doi: 10.1016/j.ygeno.2005.09.007. [DOI] [PubMed] [Google Scholar]
- 331.Timmons JA, Poucher SM, Constantin-Teodosiu D, Macdonald IA, Greenhaff PL. Metabolic responses from rest to steady state determine contractile function in ischemic skeletal muscle. Am J Physiol. 1997;273:E233–238. doi: 10.1152/ajpendo.1997.273.2.E233. [DOI] [PubMed] [Google Scholar]
- 332.Timmons JA, Poucher SM, Constantin-Teodosiu D, Worrall V, MacDonald IA, Greenhaff PL. Metabolic responses of canine gracilis muscle during contraction with partial ischemia. Am J Physiol. 1996;270:E400–406. doi: 10.1152/ajpendo.1996.270.3.E400. [DOI] [PubMed] [Google Scholar]
- 333.Timmons JA, Wennmalm K, Larsson O, Walden TB, Lassmann T, Petrovic N, Hamilton DL, Gimeno RE, Wahlestedt C, Baar K, Nedergaard J, Cannon B. Myogenic gene expression signature establishes that brown and white adipocytes originate from distinct cell lineages. Proc Natl Acad Sci U S A. 2007;104:4401–4406. doi: 10.1073/pnas.0610615104. [DOI] [PMC free article] [PubMed] [Google Scholar]
- 334.Torkamani A, Topol EJ, Schork NJ. Pathway analysis of seven common diseases assessed by genome-wide association. Genomics. 2008;92:265–272. doi: 10.1016/j.ygeno.2008.07.011. [DOI] [PMC free article] [PubMed] [Google Scholar]
- 335.Toscano A, Tsujino S, Vita G, Shanske S, Messina C, Dimauro S. Molecular basis of muscle phosphoglycerate mutase (PGAM-M) deficiency in the Italian kindred. Muscle Nerve. 1996;19:1134–1137. doi: 10.1002/(SICI)1097-4598(199609)19:9<1134::AID-MUS8>3.0.CO;2-0. [DOI] [PubMed] [Google Scholar]
- 336.Tsujino S, Servidei S, Tonin P, Shanske S, Azan G, DiMauro S. Identification of three novel mutations in non-Ashkenazi Italian patients with muscle phosphofructokinase deficiency. Am J Hum Genet. 1994;54:812–819. [PMC free article] [PubMed] [Google Scholar]
- 337.Tsujino S, Shanske S, Brownell AK, Haller RG, DiMauro S. Molecular genetic studies of muscle lactate dehydrogenase deficiency in white patients. Ann Neurol. 1994;36:661–665. doi: 10.1002/ana.410360418. [DOI] [PubMed] [Google Scholar]
- 338.Tsujino S, Shanske S, DiMauro S. Molecular genetic heterogeneity of myophosphorylase deficiency (McArdle’s disease) N Engl J Med. 1993;329:241–245. doi: 10.1056/NEJM199307223290404. [DOI] [PubMed] [Google Scholar]
- 339.Tsujino S, Shanske S, DiMauro S. Molecular genetic heterogeneity of phosphoglycerate kinase (PGK) deficiency. Muscle Nerve. 1995;3:S45–49. doi: 10.1002/mus.880181411. [DOI] [PubMed] [Google Scholar]
- 340.Tsujino S, Shanske S, Sakoda S, Fenichel G, DiMauro S. The molecular genetic basis of muscle phosphoglycerate mutase (PGAM) deficiency. Am J Hum Genet. 1993;52:472–477. [PMC free article] [PubMed] [Google Scholar]
- 341.Tsujino S, Tonin P, Shanske S, Nohria V, Boustany RM, Lewis D, Chen YT, DiMauro S. A splice junction mutation in a new myopathic variant of phosphoglycerate kinase deficiency (PGK North Carolina) Ann Neurol. 1994;35:349–353. doi: 10.1002/ana.410350316. [DOI] [PubMed] [Google Scholar]
- 342.Tuomilehto J, Lindstrom J, Eriksson JG, Valle TT, Hamalainen H, Ilanne-Parikka P, Keinanen-Kiukaanniemi S, Laakso M, Louheranta A, Rastas M, Salminen V, Uusitupa M. Prevention of type 2 diabetes mellitus by changes in lifestyle among subjects with impaired glucose tolerance. N Engl J Med. 2001;344:1343–1350. doi: 10.1056/NEJM200105033441801. [DOI] [PubMed] [Google Scholar]
- 343.ul Haque MF, King LM, Krakow D, Cantor RM, Rusiniak ME, Swank RT, Superti-Furga A, Haque S, Abbas H, Ahmad W, Ahmad M, Cohn DH. Mutations in orthologous genes in human spondyloepimetaphyseal dysplasia and the brachymorphic mouse. Nat Genet. 1998;20:157–162. doi: 10.1038/2458. [DOI] [PubMed] [Google Scholar]
- 344.Uusitupa M, Peltonen M, Lindstrom J, Aunola S, Ilanne-Parikka P, Keinanen-Kiukaanniemi S, Valle TT, Eriksson JG, Tuomilehto J. Ten-year mortality and cardiovascular morbidity in the Finnish Diabetes Prevention Study--secondary analysis of the randomized trial. PLoS One. 2009;4:e5656. doi: 10.1371/journal.pone.0005656. [DOI] [PMC free article] [PubMed] [Google Scholar]
- 345.van Hall G, Steensberg A, Fischer C, Keller C, Moller K, Moseley P, Pedersen BK. Interleukin-6 markedly decreases skeletal muscle protein turnover and increases nonmuscle amino acid utilization in healthy individuals. J Clin Endocrinol Metab. 2008;93:2851–2858. doi: 10.1210/jc.2007-2223. [DOI] [PubMed] [Google Scholar]
- 346.van Hall G, Steensberg A, Sacchetti M, Fischer C, Keller C, Schjerling P, Hiscock N, Moller K, Saltin B, Febbraio MA, Pedersen BK. Interleukin-6 stimulates lipolysis and fat oxidation in humans. J Clin Endocrinol Metab. 2003;88:3005–3010. doi: 10.1210/jc.2002-021687. [DOI] [PubMed] [Google Scholar]
- 347.Vaxillaire M, Veslot J, Dina C, Proenca C, Cauchi S, Charpentier G, Tichet J, Fumeron F, Marre M, Meyre D, Balkau B, Froguel P. Impact of common type 2 diabetes risk polymorphisms in the DESIR prospective study. Diabetes. 2008;57:244–254. doi: 10.2337/db07-0615. [DOI] [PubMed] [Google Scholar]
- 348.Venter JC, Adams MD, Myers EW, Li PW, Mural RJ, Sutton GG, Smith HO, Yandell M, Evans CA, Holt RA, Gocayne JD, Amanatides P, Ballew RM, Huson DH, Wortman JR, Zhang Q, Kodira CD, Zheng XH, Chen L, Skupski M, Subramanian G, Thomas PD, Zhang J, Gabor Miklos GL, Nelson C, Broder S, Clark AG, Nadeau J, McKusick VA, Zinder N, Levine AJ, Roberts RJ, Simon M, Slayman C, Hunkapiller M, Bolanos R, Delcher A, Dew I, Fasulo D, Flanigan M, Florea L, Halpern A, Hannenhalli S, Kravitz S, Levy S, Mobarry C, Reinert K, Remington K, Abu-Threideh J, Beasley E, Biddick K, Bonazzi V, Brandon R, Cargill M, Chandramouliswaran I, Charlab R, Chaturvedi K, Deng Z, Di Francesco V, Dunn P, Eilbeck K, Evangelista C, Gabrielian AE, Gan W, Ge W, Gong F, Gu Z, Guan P, Heiman TJ, Higgins ME, Ji RR, Ke Z, Ketchum KA, Lai Z, Lei Y, Li Z, Li J, Liang Y, Lin X, Lu F, Merkulov GV, Milshina N, Moore HM, Naik AK, Narayan VA, Neelam B, Nusskern D, Rusch DB, Salzberg S, Shao W, Shue B, Sun J, Wang Z, Wang A, Wang X, Wang J, Wei M, Wides R, Xiao C, Yan C, Yao A, Ye J, Zhan M, Zhang W, Zhang H, Zhao Q, Zheng L, Zhong F, Zhong W, Zhu S, Zhao S, Gilbert D, Baumhueter S, Spier G, Carter C, Cravchik A, Woodage T, Ali F, An H, Awe A, Baldwin D, Baden H, Barnstead M, Barrow I, Beeson K, Busam D, Carver A, Center A, Cheng ML, Curry L, Danaher S, Davenport L, Desilets R, Dietz S, Dodson K, Doup L, Ferriera S, Garg N, Gluecksmann A, Hart B, Haynes J, Haynes C, Heiner C, Hladun S, Hostin D, Houck J, Howland T, Ibegwam C, Johnson J, Kalush F, Kline L, Koduru S, Love A, Mann F, May D, McCawley S, McIntosh T, McMullen I, Moy M, Moy L, Murphy B, Nelson K, Pfannkoch C, Pratts E, Puri V, Qureshi H, Reardon M, Rodriguez R, Rogers YH, Romblad D, Ruhfel B, Scott R, Sitter C, Smallwood M, Stewart E, Strong R, Suh E, Thomas R, Tint NN, Tse S, Vech C, Wang G, Wetter J, Williams S, Williams M, Windsor S, Winn-Deen E, Wolfe K, Zaveri J, Zaveri K, Abril JF, Guigo R, Campbell MJ, Sjolander KV, Karlak B, Kejariwal A, Mi H, Lazareva B, Hatton T, Narechania A, Diemer K, Muruganujan A, Guo N, Sato S, Bafna V, Istrail S, Lippert R, Schwartz R, Walenz B, Yooseph S, Allen D, Basu A, Baxendale J, Blick L, Caminha M, Carnes-Stine J, Caulk P, Chiang YH, Coyne M, Dahlke C, Mays A, Dombroski M, Donnelly M, Ely D, Esparham S, Fosler C, Gire H, Glanowski S, Glasser K, Glodek A, Gorokhov M, Graham K, Gropman B, Harris M, Heil J, Henderson S, Hoover J, Jennings D, Jordan C, Jordan J, Kasha J, Kagan L, Kraft C, Levitsky A, Lewis M, Liu X, Lopez J, Ma D, Majoros W, McDaniel J, Murphy S, Newman M, Nguyen T, Nguyen N, Nodell M, Pan S, Peck J, Peterson M, Rowe W, Sanders R, Scott J, Simpson M, Smith T, Sprague A, Stockwell T, Turner R, Venter E, Wang M, Wen M, Wu D, Wu M, Xia A, Zandieh A, Zhu X. The sequence of the human genome. Science. 2001;291:1304–1351. doi: 10.1126/science.1058040. [DOI] [PubMed] [Google Scholar]
- 349.Verhaaren HA, Schieken RM, Mosteller M, Hewitt JK, Eaves LJ, Nance WE. Bivariate genetic analysis of left ventricular mass and weight in pubertal twins (the Medical College of Virginia twin study) Am J Cardiol. 1991;68:661–668. doi: 10.1016/0002-9149(91)90361-n. [DOI] [PubMed] [Google Scholar]
- 350.Vermeer S, Verrips A, Willemsen MA, ter Laak HJ, Ginjaar IB, Hamel BC. Novel mutations in three patients with LGMD2C with phenotypic differences. Pediatr Neurol. 2004;30:291–294. doi: 10.1016/j.pediatrneurol.2003.11.006. [DOI] [PubMed] [Google Scholar]
- 351.Vincent B, De Bock K, Ramaekers M, Van den Eede E, Van Leemputte M, Hespel P, Thomis MA. ACTN3 (R577X) genotype is associated with fiber type distribution. Physiol Genomics. 2007;32:58–63. doi: 10.1152/physiolgenomics.00173.2007. [DOI] [PubMed] [Google Scholar]
- 352.Vissing J, Salamon MB, Arlien-Soborg P, Norby S, Manta P, DiMauro S, Schmalbruch H. A new mitochondrial tRNA(Met) gene mutation in a patient with dystrophic muscle and exercise intolerance. Neurology. 1998;50:1875–1878. doi: 10.1212/wnl.50.6.1875. [DOI] [PubMed] [Google Scholar]
- 353.Vissing K, Andersen JL, Schjerling P. Are exercise-induced genes induced by exercise? FASEB J. 2005;19:94–96. doi: 10.1096/fj.04-2084fje. [DOI] [PubMed] [Google Scholar]
- 354.Vives-Bauza C, Gamez J, Roig M, Briones P, Cervera C, Solano A, Montoya J, Andreu AL. Exercise intolerance resulting from a muscle-restricted mutation in the mitochondrial tRNA(Leu (CUN)) gene. Ann Med. 2001;33:493–496. doi: 10.3109/07853890109002099. [DOI] [PubMed] [Google Scholar]
- 355.Vladutiu GD, Bennett MJ, Fisher NM, Smail D, Boriack R, Leddy J, Pendergast DR. Phenotypic variability among first-degree relatives with carnitine palmitoyltransferase II deficiency. Muscle Nerve. 2002;26:492–498. doi: 10.1002/mus.10217. [DOI] [PubMed] [Google Scholar]
- 356.Vladutiu GD, Bennett MJ, Smail D, Wong LJ, Taggart RT, Lindsley HB. A variable myopathy associated with heterozygosity for the R503C mutation in the carnitine palmitoyltransferase II gene. Mol Genet Metab. 2000;70:134–141. doi: 10.1006/mgme.2000.3009. [DOI] [PubMed] [Google Scholar]
- 357.Vollaard NB, Constantin-Teodosiu D, Fredriksson K, Rooyackers O, Jansson E, Greenhaff PL, Timmons JA, Sundberg CJ. Systematic analysis of adaptations in aerobic capacity and submaximal energy metabolism provides a unique insight into determinants of human aerobic performance. J Appl Physiol. 2009;106:1479–1486. doi: 10.1152/japplphysiol.91453.2008. [DOI] [PubMed] [Google Scholar]
- 358.Vorgerd M, Karitzky J, Ristow M, Van Schaftingen E, Tegenthoff M, Jerusalem F, Malin JP. Muscle phosphofructokinase deficiency in two generations. J Neurol Sci. 1996;141:95–99. doi: 10.1016/0022-510x(96)00131-1. [DOI] [PubMed] [Google Scholar]
- 359.Wagoner LE, Craft LL, Zengel P, McGuire N, Rathz DA, Dorn GW, 2nd, Liggett SB. Polymorphisms of the beta1-adrenergic receptor predict exercise capacity in heart failure. Am Heart J. 2002;144:840–846. doi: 10.1067/mhj.2002.125325. [DOI] [PubMed] [Google Scholar]
- 360.Walsh T, McClellan JM, McCarthy SE, Addington AM, Pierce SB, Cooper GM, Nord AS, Kusenda M, Malhotra D, Bhandari A, Stray SM, Rippey CF, Roccanova P, Makarov V, Lakshmi B, Findling RL, Sikich L, Stromberg T, Merriman B, Gogtay N, Butler P, Eckstrand K, Noory L, Gochman P, Long R, Chen Z, Davis S, Baker C, Eichler EE, Meltzer PS, Nelson SF, Singleton AB, Lee MK, Rapoport JL, King MC, Sebat J. Rare structural variants disrupt multiple genes in neurodevelopmental pathways in schizophrenia. Science. 2008;320:539–543. doi: 10.1126/science.1155174. [DOI] [PubMed] [Google Scholar]
- 361.Walter MC, Czermin B, Muller-Ziermann S, Bulst S, Stewart JD, Hudson G, Schneiderat P, Abicht A, Holinski-Feder E, Lochmuller H, Chinnery PF, Klopstock T, Horvath R. Late-onset ptosis and myopathy in a patient with a heterozygous insertion in POLG2. J Neurol. 2010;257:1517–1523. doi: 10.1007/s00415-010-5565-9. [DOI] [PubMed] [Google Scholar]
- 362.Wang K, Dickson SP, Stolle CA, Krantz ID, Goldstein DB, Hakonarson H. Interpretation of association signals and identification of causal variants from genome-wide association studies. Am J Hum Genet. 2010;86:730–742. doi: 10.1016/j.ajhg.2010.04.003. [DOI] [PMC free article] [PubMed] [Google Scholar]
- 363.Wang L, Limongelli A, Vila MR, Carrara F, Zeviani M, Eriksson S. Molecular insight into mitochondrial DNA depletion syndrome in two patients with novel mutations in the deoxyguanosine kinase and thymidine kinase 2 genes. Mol Genet Metab. 2005;84:75–82. doi: 10.1016/j.ymgme.2004.09.005. [DOI] [PubMed] [Google Scholar]
- 364.Wang Q, Curran ME, Splawski I, Burn TC, Millholland JM, VanRaay TJ, Shen J, Timothy KW, Vincent GM, de Jager T, Schwartz PJ, Toubin JA, Moss AJ, Atkinson DL, Landes GM, Connors TD, Keating MT. Positional cloning of a novel potassium channel gene: KVLQT1 mutations cause cardiac arrhythmias. Nat Genet. 1996;12:17–23. doi: 10.1038/ng0196-17. [DOI] [PubMed] [Google Scholar]
- 365.Ways JA, Cicila GT, Garrett MR, Koch LG. A genome scan for loci associated with aerobic running capacity in rats. Genomics. 2002;80:13–20. doi: 10.1006/geno.2002.6797. [DOI] [PubMed] [Google Scholar]
- 366.Ways JA, Smith BM, Barbato JC, Ramdath RS, Pettee KM, DeRaedt SJ, Allison DC, Koch LG, Lee SJ, Cicila GT. Congenic strains confirm aerobic running capacity quantitative trait loci on rat chromosome 16 and identify possible intermediate phenotypes. Physiol Genomics. 2007;29:91–97. doi: 10.1152/physiolgenomics.00027.2006. [DOI] [PubMed] [Google Scholar]
- 367.Wehner M, Clemens PR, Engel AG, Kilimann MW. Human muscle glycogenosis due to phosphorylase kinase deficiency associated with a nonsense mutation in the muscle isoform of the alpha subunit. Human Molecular Genetics. 1994;3:1983–1987. doi: 10.1093/hmg/3.11.1983. [DOI] [PubMed] [Google Scholar]
- 368.West DW, Kujbida GW, Moore DR, Atherton P, Burd NA, Padzik JP, De Lisio M, Tang JE, Parise G, Rennie MJ, Baker SK, Phillips SM. Resistance exercise-induced increases in putative anabolic hormones do not enhance muscle protein synthesis or intracellular signalling in young men. J Physiol. 2009;587:5239–5247. doi: 10.1113/jphysiol.2009.177220. [DOI] [PMC free article] [PubMed] [Google Scholar]
- 369.Widegren U, Jiang XJ, Krook A, Chibalin AV, Bjornholm M, Tally M, Roth RA, Henriksson J, Wallberg-henriksson H, Zierath JR. Divergent effects of exercise on metabolic and mitogenic signaling pathways in human skeletal muscle. FASEB J. 1998;12:1379–1389. doi: 10.1096/fasebj.12.13.1379. [DOI] [PubMed] [Google Scholar]
- 370.Wilmore JH, Stanforth PR, Gagnon J, Rice T, Mandel S, Leon AS, Rao DC, Skinner JS, Bouchard C. Cardiac output and stroke volume changes with endurance training: the HERITAGE Family Study. Med Sci Sports Exerc. 2001;33:99–106. doi: 10.1097/00005768-200101000-00016. [DOI] [PubMed] [Google Scholar]
- 371.Wilmore JH, Stanforth PR, Gagnon J, Rice T, Mandel S, Leon AS, Rao DC, Skinner JS, Bouchard C. Heart rate and blood pressure changes with endurance training: the HERITAGE Family Study. Med Sci Sports Exerc. 2001;33:107–116. doi: 10.1097/00005768-200101000-00017. [DOI] [PubMed] [Google Scholar]
- 372.Winnicki M, Accurso V, Hoffmann M, Pawlowski R, Dorigatti F, Santonastaso M, Longo D, Krupa-Wojciechowska B, Jeunemaitre X, Pessina AC, Somers VK, Palatini P. Physical activity and angiotensin-converting enzyme gene polymorphism in mild hypertensives. Am J Med Genet A. 2004;125:38–44. doi: 10.1002/ajmg.a.20434. [DOI] [PubMed] [Google Scholar]
- 373.Wisloff U, Nilsen TI, Droyvold WB, Morkved S, Slordahl SA, Vatten LJ. A single weekly bout of exercise may reduce cardiovascular mortality: how little pain for cardiac gain? ‘The HUNT study, Norway’. Eur J Cardiovasc Prev Rehabil. 2006;13:798–804. doi: 10.1097/01.hjr.0000216548.84560.ac. [DOI] [PubMed] [Google Scholar]
- 374.Wittwer M, Billeter R, Hoppeler H, Fluck M. Regulatory gene expression in skeletal muscle of highly endurance-trained humans. Acta Physiol Scand. 2004;180:217–227. doi: 10.1046/j.0001-6772.2003.01242.x. [DOI] [PubMed] [Google Scholar]
- 375.Wu H, Kanatous SB, Thurmond FA, Gallardo T, Isotani E, Bassel-Duby R, Williams RS. Regulation of mitochondrial biogenesis in skeletal muscle by CaMK. Science. 2002;296:349–352. doi: 10.1126/science.1071163. [DOI] [PubMed] [Google Scholar]
- 376.Yang N, MacArthur DG, Gulbin JP, Hahn AG, Beggs AH, Easteal S, North K. ACTN3 genotype is associated with human elite athletic performance. Am J Hum Genet. 2003;73:627–631. doi: 10.1086/377590. [DOI] [PMC free article] [PubMed] [Google Scholar]
- 377.Yang N, MacArthur DG, Wolde B, Onywera VO, Boit MK, Lau SY, Wilson RH, Scott RA, Pitsiladis YP, North K. The ACTN3 R577X polymorphism in East and West African athletes. Med Sci Sports Exerc. 2007;39:1985–1988. doi: 10.1249/mss.0b013e31814844c9. [DOI] [PubMed] [Google Scholar]
- 378.Yi X, Liang Y, Huerta-Sanchez E, Jin X, Cuo ZX, Pool JE, Xu X, Jiang H, Vinckenbosch N, Korneliussen TS, Zheng H, Liu T, He W, Li K, Luo R, Nie X, Wu H, Zhao M, Cao H, Zou J, Shan Y, Li S, Yang Q, Asan, Ni P, Tian G, Xu J, Liu X, Jiang T, Wu R, Zhou G, Tang M, Qin J, Wang T, Feng S, Li G, Huasang, Luosang J, Wang W, Chen F, Wang Y, Zheng X, Li Z, Bianba Z, Yang G, Wang X, Tang S, Gao G, Chen Y, Luo Z, Gusang L, Cao Z, Zhang Q, Ouyang W, Ren X, Liang H, Huang Y, Li J, Bolund L, Kristiansen K, Li Y, Zhang Y, Zhang X, Li R, Yang H, Nielsen R, Wang J. Sequencing of 50 human exomes reveals adaptation to high altitude. Science. 2010;329:75–78. doi: 10.1126/science.1190371. [DOI] [PMC free article] [PubMed] [Google Scholar]
- 379.Yokomizo T, Hasegawa K, Ishitobi H, Osato M, Ema M, Ito Y, Yamamoto M, Takahashi S. Runx1 is involved in primitive erythropoiesis in the mouse. Blood. 2008;111:4075–4080. doi: 10.1182/blood-2007-05-091637. [DOI] [PubMed] [Google Scholar]
- 380.Zeggini E, Weedon MN, Lindgren CM, Frayling TM, Elliott KS, Lango H, Timpson NJ, Perry JR, Rayner NW, Freathy RM, Barrett JC, Shields B, Morris AP, Ellard S, Groves CJ, Harries LW, Marchini JL, Owen KR, Knight B, Cardon LR, Walker M, Hitman GA, Morris AD, Doney AS, McCarthy MI, Hattersley AT. Replication of genome-wide association signals in UK samples reveals risk loci for type 2 diabetes. Science. 2007;316:1336–1341. doi: 10.1126/science.1142364. [DOI] [PMC free article] [PubMed] [Google Scholar]
- 381.Zhang SJ, Truskey GA, Kraus WE. Effect of cyclic stretch on beta1D-integrin expression and activation of FAK and RhoA. American journal of physiology. 2007;292:C2057–2069. doi: 10.1152/ajpcell.00493.2006. [DOI] [PubMed] [Google Scholar]
- 382.Zhang Y, Proenca R, Maffei M, Barone M, Leopold L, Friedman JM. Positional cloning of the mouse obese gene and its human homologue. Nature. 1994;372:425–432. doi: 10.1038/372425a0. [DOI] [PubMed] [Google Scholar]
- 383.Zhou D, Shen Z, Strack AM, Marsh DJ, Shearman LP. Enhanced running wheel activity of both Mch1r- and Pmch-deficient mice. Regul Pept. 2005;124:53–63. doi: 10.1016/j.regpep.2004.06.026. [DOI] [PubMed] [Google Scholar]
- 384.Zisman A, Peroni OD, Abel ED, Michael MD, Mauvais-Jarvis F, Lowell BB, Wojtaszewski JF, Hirshman MF, Virkamaki A, Goodyear LJ, Kahn CR, Kahn BB. Targeted disruption of the glucose transporter 4 selectively in muscle causes insulin resistance and glucose intolerance. Nat Med. 2000;6:924–928. doi: 10.1038/78693. [DOI] [PubMed] [Google Scholar]