

Abstract
BACKGROUND:
Maximal inspiratory pressure (MIP) is the most commonly used measure to evaluate inspiratory muscle strength. Normative values for MIP vary significantly among studies, which may reflect differences in participant demographics and technique of MIP measurement.
OBJECTIVE:
To perform a systematic review with meta-analyses to synthesize MIP values that represent healthy adults.
METHODS:
A systematic literature search was conducted using Medline, EMBASE, Cochrane, Cumulative Index to Nursing and Allied Health (CINAHL) and Sport Discus databases. Two reviewers identified and selected articles, and abstracted data. Methodological quality was assessed using the Quality Assessment of Diagnostic Accuracy Studies (QUADAS) tool. A random-effects model was used to calculate overall means and 95% CIs.
RESULTS:
Of 22 included articles, MIP data were synthesized according to age group and sex from six reports (n=840) in the meta-analyses. The mean QUADAS score was 3.5 of 7. The age range was between 18 and 83 years (426 men, 414 women). MIP began to decrease with age in the 40 to 60 years age range and continued to fall progressively with age. For the same age group, men tended to have higher MIPs than women. Sensitivity analysis of withdrawing studies from the meta-analysis identified one study that contributed more to heterogeneity in some age groups.
DISCUSSION:
MIP was higher in men and decreased with age, which was initially apparent in middle age. Several characteristics of participants and MIP technique influence values in healthy individuals.
CONCLUSIONS:
The present meta-analysis provides normative MIP values that are reflective of a large sample (n=840) and likely represents the broadest representation of participant characteristics compared with previous reports of normative data.
Keywords: Adults, Muscle strength, Reference values, Respiratory muscles
Abstract
HISTORIQUE :
La pression inspiratoire maximale (PIM) est la mesure la plus utilisée pour évaluer la force des muscles inspiratoires. Les valeurs normatives de PIM varient considérablement selon les études, ce qui reflète peut-être des différences dans la démographie des participants et dans la technique pour mesurer la PIM.
OBJECTIF :
Effectuer une analyse systématique au moyen de méta-analyses pour synthétiser les valeurs de PIM qui représentent des adultes en santé.
MÉTHODOLOGIE :
En vue de l’analyse systématique, les chercheurs ont fouillé dans les bases de données Medline, EMBASE, Cochrane, Cumulative Index to Nursing and Allied Health (CINAHL) et Sport Discus. Deux analystes ont déterminé et sélectionné les articles et synthétisé les données. Ils ont évalué la qualité méthodologique au moyen de l’outil QUADAS d’études d’évaluation de la qualité et d’exactitude diagnostique. Ils ont utilisé un modèle à effets aléatoires pour calculer les moyennes globales et les IC de 95 %.
RÉSULTATS :
Les données de PIM ont été synthétisées selon le groupe d’âge et le sexe dans six des 22 articles inclus (n=840) dans la méta-analyse. L’indice QUADAS moyen était de 3,5 sur 7. La fourchette d’âge se situait entre 18 et 83 ans (426 hommes, 414 femmes). La PIM maximale s’est mise à diminuer avec le vieillissement dans la fourchette des 40 à 60 ans et a continué à dégresser progressivement avec l’âge. Dans le même groupe d’âge, les hommes avaient tendance à présenter des PIM plus élevées que les femmes. Les analyses de sensibilité pour retirer des études de la méta-analyse n’ont pas permis de repérer une seule étude qui contribuait davantage à l’hétérogénéité que les cinq autres.
EXPOSÉ :
La PIM était plus élevée chez les hommes et diminuait avec l’âge, une tendance qui a commencé à être apparente à l’âge mur. Plusieurs caractéristiques des participants et la technique de PIM influaient sur les valeurs chez les personnes en santé.
CONCLUSIONS :
La présente méta-analyse fournit des valeurs de PIM normatives qui reflètent un énorme échantillonnage (n=840) et représentent probablement la plus vaste représentation des caractéristiques des participants par rapport aux rapports antérieurs de données normatives.
Impairment of the respiratory muscles compromises ventilation, gas exchange and oxygen delivery to tissues (1). Respiratory muscle weakness has been reported in several conditions including those that are cardiovascular (2,3), pulmonary (4) and neuromuscular (5,6) in origin. Inspiratory muscle strength is reflected by the pressure developed within the thorax; these pressure measures are informative for clinical evaluation as well as physiological studies (1). Measurement of maximal inspiratory pressure (MIP) is a straightforward test in which individuals are asked to perform a forceful inspiration against an occluded mouthpiece (1,7). The advantages of this test are that it is noninvasive and performed quickly. On the other hand, its dependence on voluntary effort and the wide range of normative values limit the clinical utility of MIP. Consequently, a low value can reflect inspiratory muscle impairment but also can be due to poor test performance (8–10). Even a well-performed MIP test is difficult to interpret due to uncertainty of the most representative normative values.
Numerous sets of reference values for MIP have been reported (5,7–30); however, the usefulness of normal MIP values is obscured by the large variability among studies. The variation among these reports likely indicates differences in participant demographics and technical aspects of test performance (1,7). Participant characteristics that have been considered to influence MIP include effort and understanding of test performance, age, sex, height, weight, fitness level and smoking status (31–33). Apparatus set-up and test performance issues that can affect MIP values include type of mouthpiece, presence of a small leak, pressure evaluated (ie, peak or plateau), number of trials and lung volume at the starting point of test performance (1,7,19,27,34,35).
Due to the large interstudy variation of normative values for MIP, the data from a single study may not be appropriate to establish the lower limit indicating respiratory muscle weakness (25). The American Thoracic Society (ATS)/European Respiratory Society (ERS) (1) statement on respiratory muscle testing states that the normal ranges of MIP are wide, and the values in the lower quartile of the normal range can be consistent with either normal strength or mild to moderate weakness. This guideline states that an MIP of −80 cmH2O usually excludes clinically important inspiratory muscle weakness; however, this threshold does not consider age and sex, and is higher than the mean predicted values for older men, and middle-age and older women (8,10,13).
Unfortunately, universally applicable normal values for MIP resulting from prediction equations and, specifically, agreement on the lower limits of normal, are not available. Because the application and interpretation of MIPs for clinical evaluation is complicated by the extremely wide range of reported normative values, the purpose of the present meta-analysis was to synthesize and to evaluate the quality of study design and methodology to determine normative MIP values in healthy adults.
METHODS
Search strategy and selection criteria
A search of the Medline, EMBASE, Cochrane, Cumulative Index to Nursing and Allied Health (CINAHL) and Sport Discus databases (from inception to May 2012) was conducted. Inclusion criteria were as follows: participants were healthy adults (>18 years of age); the purpose of the study was to determine reference values for MIP; and published in English or Portuguese. Articles were excluded if they were a review article, thesis or dissertation; and the measurement was assessed in a standing position rather than sitting. The search strategy used the following terms: “respiratory muscles” combined with “maximal inspiratory pressure” and “reference values”. These terms were modified to meet the requirements of the different databases. Details of search strategies are available on request from the corresponding author. Additional studies were identified by examining the reference list of all included articles. Duplicates were removed, and two authors independently reviewed titles and abstracts of citations retrieved from the search. Disagreements were discussed until consensus for inclusion or exclusion was reached. Subsequently, two authors reviewed the full text of all selected articles to determine whether they met the inclusion criteria.
Data abstraction
Five authors (AWS, WDR, FC, ISP and VFP) abstracted data from the included articles regarding subject characteristics and technical aspects of test performance including: age, sex, height, weight, lung function, presence of diseases, fitness, smoking status, race, mouthpiece type, small leak, pressure evaluated, gauge type, lung volume of test performance, noseclip, total time of the MIP manoeuvre, number of trials, criterion for stopping, instruction and demonstration, interval between manoeuvres, screen incentive and calibration of the instrument. MIP was also abstracted and, when possible, MIP and other data were abstracted according to age per decade (eg, 20 to 29 years) and sex. Due to the different definitions reported for peak, plateau and average pressures in the 22 studies, the following definitions were operationalized: plateau pressure was reported as the highest pressure that could be sustained for a defined minimum period (7,16,25,27); and peak pressure was defined as the highest value reached during MIP (1,18,19). Authors of two studies (9,23) were contacted to provide additional information for missing data.
Methodological quality of included studies
Methodological quality of each study was independently assessed by two authors using the relevant items of the Quality Assessment of Diagnostic Accuracy Studies (QUADAS) scale (36,37). QUADAS is an evidence-based, validated, quality assessment tool used specifically for systematic reviews to evaluate risk of bias and study accuracy (36,37). Given that MIP was not compared with another reference standard in the retrieved articles, seven of the 14 items were relevant for quality assessment. Additional items specific to the quality of MIP testing methodology were also abstracted.
Synthesis and meta-analysis
Subject characteristics and technical aspects of the test, including quality assessment, were synthesized in tabular format. Meta-analyses were performed on MIP by inputting mean and SD of MIP (cmH2O) values that were categorized according to age (divided into six ranges) and sex. Studies were included in the meta-analyses if data were reported in comparable age ranges and sex. Six studies reported data in comparable age ranges (12,15,24,26,29,30). The random-effects model was selected for the meta-analyses to examine methodological variation in the included studies (38–40). The inverse variance and variance component (τ2) were used to calculate the weight applied in the random-effects model (39–41). The method of moments estimate were used to calculate individual τ2 (39,40). The homogeneity statistic, Q, was calculated to provide a measure of the heterogeneity of MIP among studies. A sensitivity analysis was performed to determine whether one or more studies contributed more to hetereogeneity.
RESULTS
Search and selection
A flow diagram depicting the search and selection of studies is shown in Figure 1. The search of databases identified 4367 titles and abstracts, of which 19 full-text articles were reviewed. Eleven additional articles were identified from the reference lists of articles (manual search). Of the 30 full-text articles reviewed, eight were excluded because the study purpose was not to determine reference values of MIP (31,33,35,42,43); it was a review (43); the MIP manoeuvre was performed at functional residual capacity rather than residual volume (9) or in a standing rather than sitting position (20,44).
Figure 1).
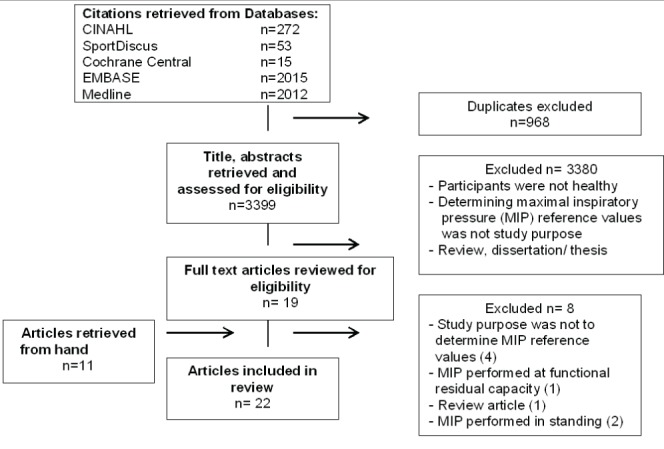
Flow diagram indicating articles identified, screened and included. CINAHL Cumulative Index to Nursing and Allied Health Literature
Methodological quality of studies
Methodological quality, as assessed according to seven items of the QUADAS, ranged between 0 and 7, with a mean score of 3 (Table 1). The most common items that were reported included: similar data available during test results and in practice (15 of 22 studies); study participants were representative of participants who would be tested in practice (12 of 22 studies); and the selection criteria were clearly described (12 of 22 studies). The quality criteria that were least often reported were whether the reference standard was likely to correctly classify the target condition (six of 22 studies); and whether uninterpretable/intermediate tests results were reported (six of 22 studies). Other issues that affected methodological quality were patient characteristics and MIP technique not queried by QUADAS. These issues are described in more detail in the following two sections and in Tables 2 and 3.
TABLE 1.
Ratings of Quality Assessment of Diagnostic Accuracy Studies (QUADAS)
| Author (reference), year |
QUADAS rating
|
Total (of 7) | ||||||
|---|---|---|---|---|---|---|---|---|
| 1 | 2 | 3 | 9 | 12 | 13 | 14 | ||
| Cook et al (11), 1964 | No | No | No | No | No | No | Unclear | 0 |
| Ringqvist (12), 1966 | No | No | No | No | Yes | No | Yes | 2 |
| Black and Hyatt (5), 1969 | No | No | No | Unclear | No | No | Unclear | 0 |
| Leech et al (13), 1983 | Yes | Yes | No | No | Yes | Yes | Yes | 5 |
| Wilson et al (14), 1984 | No | No | No | No | No | No | Unclear | 0 |
| Camelo Jr et al (15), 1985 | No | No | No | Yes | No | Yes | Unclear | 2 |
| Vincken et al (16), 1987 | No | No | No | Yes | No | Unclear | Unclear | 1 |
| McElvaney et al (17), 1989 | Yes | Yes | Yes | Yes | Yes | No | Yes | 6 |
| Bruschi et al (18), 1992 | No | No | No | Yes | No | Yes | Yes | 3 |
| Enright et al (19), 1994 | No | No | No | Yes | Yes | No | Yes | 3 |
| Enright et al (21), 1995 | Yes | Yes | Yes | Yes | Yes | Yes | Yes | 7 |
| Johan et al (22), 1997 | Yes | Yes | Unclear | Unclear | Yes | No | Unclear | 3 |
| Pande et al (23), 1998 | Yes | Yes | No | No | Yes | No | Unclear | 3 |
| Harik-Khan et al (8), 1998 | Yes | Yes | Yes | Yes | Yes | Yes | Yes | 7 |
| Neder et al (24), 1999 | Yes | Yes | No | No | Yes | No | Unclear | 3 |
| Hautmann et al (25), 2000 | Yes | Yes | No | No | Yes | Unclear | Yes | 4 |
| Wohlgemuth et al (26), 2003 | Yes | Yes | Yes | Yes | Yes | No | Unclear | 5 |
| Windisch et al (27), 2004 | Yes | Yes | Yes | Yes | Yes | No | Unclear | 5 |
| Sachs et al (28), 2009 | No | No | No | No | Yes | Yes | Yes | 3 |
| Simões et al (29), 2010 | Yes | Yes | Yes | Yes | Yes | No | Yes | 6 |
| Costa et al (30), 2010 | Yes | Yes | No | No | Yes | No | Unclear | 3 |
| Gopalakrishna et al (10), 2011 | No | No | No | No | No | No | Unclear | 0 |
| Subtotals for items | 12 | 12 | 6 | 10 | 15 | 6 | 10 | |
QUADAS Items (36): 1. Was the spectrum of persons representative of the demographics of the patients who will receive the test in practice?; 2. Were selection criteria clearly described?; 3. Is the reference standard likely to correctly classify the target condition?; 9. Was the execution of the reference standard described in sufficient detail to permit its replication?; 12. Were the same clinical data available when test results were interpreted as would be available when the test is used in practice?; 13. Were uninterpretable/intermediate test results reported?; 14. Were withdrawals from the study explained?
TABLE 2.
Characteristics of participants
| Author (reference), year | Age, years (range) | Height, cm, mean ± SD | Weight, kg mean ± SD | BMI, kg/m2, mean ± SD or 95% CI | FEV1, mean ± SD or 95% CI | Lung disease | Smoking status |
|---|---|---|---|---|---|---|---|
| Cook et al (11), 1964; n=32 (23M/9F) | M: Gp 3 18–47, Gp 4 49–64; F: Gp 6 17.5–32 |
M: Gp 3 181; Gp 4 177 F: Gp 6 164 |
NR | NR | NR | NR | NR |
| Ringqvist (12), 1966; n=200 (106M/94F) | 18–83 | Reported according to age | Reported according to age | NR | NR | No | NR |
| Black and Hyatt (5), 1969; n=120, (60M/60F) | 20–74 | NR | NR | NR | NR | No | Nonsmokers, smokers |
| Leech et al (13), 1983; n=595 (252M/343F) | 15–35 | Reported according to age | Reported according to age | NR | M: 4.5–4.6 L*
F: 3.2–3.4 L |
NR | Former and current smokers |
| Wilson et al (14), 1984; n=135 (48M/87F) | 18–49 >50 | M: 179±6 F: 163±7 |
M: 74.5±8.5 F: 61.4±9 |
NR M: 20, F: 23 |
NR | No | Former and current smokers |
| Camelo Jr et al (15), 1985; n=60 (30M/30F) | 20–49 | M: 170±7.7 F: 160.2±6.2 |
M: 70.0±10.8 F: 56.0±9.1 |
NR M: 24, F: 22 |
NR | NR | Former, current and never smokers |
| Vincken et al (16), 1987; n=106 (46M/60F) | 16–79 | M: 172±7 F: 160±7 |
M: 74±9 F: 59±10.0 |
NR M: 25, F: 23 |
NR | No | Nonsmokers and smokers |
| McElvaney et al (17), 1989; n=104 (40M/64F) | >55 | M: 174±7 F: 161±6 |
M: 107±10 F: 112±12 |
NR | M: 120±13% F: 117±17% |
No | NR |
| Bruschi et al (18), 1992; n=669 (290M/379F) | 18–70 | NR | NR | NR | NR | No | Nonsmokers and smokers |
| Enright et al (19), 1994; n=2871 (1269M/1602F) | >65 | M: 173.2±6.59 F: 158.8±6.30 |
M: 79.5±11.6 F: 66.2±12.5 |
M: 26.5, F: 26.3 | NR | NR | Nonsmokers and former smokers |
| Enright et al (21), 1995; n=228 (112M/176F) | >65 | M: 171.25 F: 157 |
M: 79.7 F: 65.7 |
M: 26.4 (22,32) F: 26 (20,34) |
M: 2.9 (2.0–3.7) L F: 1.9 (1.2–2.6) L |
No | Nonsmokers and former smokers |
| Johan et al (22), 1997; n=452 (277M/175F) | 20–80 | M: 164–167* F: 155–157* |
M: 64.1–67.21 F: 53.6–57.81 |
M: 23.0, 24.31 F: 21.9, 24.11 |
NR | No | Nonsmokers and former smokers |
| Pande et al (23), 1998; n=273 (153M/120F) | 20–65 | M: 165.6±6.1 F: 153.5±5.2 |
M: 62.5±11.7 F: 57.5±10.9 |
M: 22.8±3.8 F: 24.6±4.8 |
M: 2.15±0.48 L F: 3.18±0.64 L |
No | Nonsmokers |
| Harik-Khan et al (8), 1998; n=267 (139M/128F) | <40 – >75 | M: 164.2±7.3 F: 177.6±6.6 |
M: 64.7±11.9 F: 81.7±13.3 |
M: 25.8±3.6 F: 23.9±4.1 |
M: 91.7±12.0% F: 98.0±10.3% |
No | Nonsmokers, former, occasional, current smokers |
| Neder et al (24), 1999; n=100 (50M/50F) | 20–80 | M: 168.4±6.2 F: 157.1±7.1 |
M: 73.8±10.7 F: 62.5±10.8 |
M: 25.3±3.9 F: 24.7±4.0 |
M: 2.51–4.14 L* F: 1.85–3.01 L |
No | Nonsmokers |
| Hautmann et al (25), 2000; n=504 (248M/256F) | 18–82 | M: 176.9±6.82 F: 164.9±6.37 |
M: 78.3±10.9 F: 66.4±10.8 |
M: 25±3.4 F: 24.5±4.0 |
M: 106±21 L F: 3.01±0.71 L |
No | Smokers, former and nonsmokers |
| Wohlgemuth et al (26), 2003; n=252 (126M/126F) | 18–80 | Reported according to age | Reported according to age | NR | NR | No | Former and current smokers, |
| Windisch et al (27), 2004; n=490 (204M/286F) | 10–90 | M: 179.5±7.7 F: 166.4±7.0 |
M: 77.9±11.2 F: 66.0±10.9 |
M: 24.2±3.1 F: 23.9±4.1 |
99.8±10.6% | No | Never, former and current smokers |
| Sachs et al (28), 2009; n=1755 (872M/883F) | 45–84 | M: 172 F: 158 |
M: 80.45 F: 68.18 |
M: 27.19; F: 27.31 | >65% | No | Nonsmokers |
| Simões et al (29), 2010; n=140 (70M/70F) | 20–89 | Reported according to age | Reported according to age | Reported according to age | M: 92±8% F: 93±7% |
No | Nonsmokers |
| Costa et al (30), 2010; n=120 (60M/60F) | 20–80 | Reported according to age | Reported according to age | Reported according to age | NR | No | Nonsmokers |
| Gopalakrishna et al (10), 2011; n=250 (125M/125F) | 20–70 | M: 165.70±7.56 F: 155.99±5.81 |
M: 64.62±9.73 F: 56.41±9.90 |
M: 23.54±3.21 F: 23.17±3.89 |
NR | No | Nonsmokers |
Range of mean data shown for different subgroups. BMI Body mass index; F Female; FEV1 Forced expiratory volume in 1 s; Gp Group; M Male; NR not reported
TABLE 3.
Technical aspects that influence maximal inspiratory pressure (MIP)
| Author (reference), year | Mouth-piece | Small leak (size) | Pressure evaluated | Starting volume | Time of MIP | Trials, n | Criterion for stopping | LLN (percentile or cmH20) |
|---|---|---|---|---|---|---|---|---|
| Cook et al (11), 1963 | Tube | NR | Peak | RV and FRC | Without control | Min of 2 | NR | NR |
| Ringqvist (12), 1966 | Tube | Yes (2 mm) | Peak | RV | Max 1.5 s | Min of 5 | Highest value | NR |
| Black and Hyatt (5), 1969 | Tube | Yes (2 mm) | Peak | RV | Min of 1 s | Min of 2 | Highest value | NR |
| Leech et al (13),1983 | NR | Yes (0.90 mm) | Peak | RV | NR | Max of 3 | Highest value | NR |
| Wilson et al (14), 1984 | Flanged | Yes, size NR | Peak | RV | Min of 1 s | Min of 3 | 2 identical readings | NR |
| Camelo Jr et al (15), 1985 | Tube | Yes (2 mm) | Peak | RV | Min of 1 s | Min of 4 | Highest value | NR |
| Vincken et al (16), 1987 | Flanged | Yes (1.27 mm) | Plateau | RV | Min of 1 s | Min of 4 | Highest 2 values within 5% difference | NR |
| McElvaney et al (17), 1989 | Tube | Yes (0.6 mm) | Peak | RV | Min of 1s | Min of 3 | Highest 3 values within 5% difference | NR |
| Bruschi et al (18), 1992 | Tube | Yes (1.06 mm) | Peak | RV and FRC | Min of 1 s | Min of 5 | Highest value | NR |
| Enright et al (19), 1994 | Tube | Yes (1 mm) | Peak | RV | 2 s | 3–5 | Highest 2 values within 10% difference | Yes (5th %); M: −41; F: −32 |
| Enright et al (21),1995 | Tube | Yes (1 mm) | Peak | RV | 2 s | 5 | Highest 2 values within 10% difference | Yes (5th %); M: −42; F: −38 |
| Johan et al (22), 1997 | Flanged | Yes, size NR | Peak | RV | Min of 1 s | 3–5 | Highest value of 3 similar trials | NR |
| Pande et al (23), 1998 | NR | Yes (1.27 mm) | Peak | RV | Min of 2 s | NR | Highest value | NR |
| Harik-Khan et al (8), 1998 | Tube | Yes (1 mm) | Peak | RV | 2 s | Max of 5 | Highest 2 values within 10% difference | Yes (5th %); M: −37; F: −32 |
| Neder et al (24), 1999 | Flanged | Yes, size NR | Peak | RV | Min of 1 s | 3–5 | Highest value. <10% of 3 trials | Yes (1.96 × SEE) M: −34; F: −18 |
| Hautmann et al (25), 2000 | NR | Yes, size NR | Plateau | RV | Min of 2 s | Min of 7 | Highest value | Yes (5th %); M: ×0.60; F: ×0.59 |
| Wohlgemuth et al (26), 2003 | Face mask | Yes (2 mm) | Peak | RV | Min of 1 s | Min of 3 | Highest value varying 5% | NR |
| Windisch et al (27), 2004 | Flanged | Yes (2 mm) | Peak and plateau | RV and FRC | Min of 1 s | Min of 7 | Highest 2 values within 10% difference | Yes (5th %); according to age in decades |
| Sachs et al (28), 2009 | Tube | NR | Plateau | RV | Min of 1 s | 5 | Highest 2 values within 10% difference | Yes (NR) M: −40; F: −36 |
| Simões et al (29), 2010 | Tube | Yes (2 mm) | Plateau | RV | About 1 s | Min of 3 | Highest value <10% of all trials | Yes (1.645×SEE) M: −25; F: −69 |
| Costa et al (30), 2010 | NR | Yes (2 mm) | Peak | RV | Min of 1 s | Min of 3 | Highest value <10% of 2 trials | Yes (5th %); M: −23.38; F: −28.83 |
| Gopalakrishna et al (10), 2011 | NR | NR | Peak | RV | Min of 1 s | Min of 3 | Highest 2 values within <10% difference | NR |
5th % Fifth percentile of the negative residuals of maximal inspiratory pressure; F Female; FRC Functional residual capacity; LLN Lower limit of the normal range; M Male; Max Maximum; Min Minimum; n/a not applicable; NR Not reported; Peak The highest value reached during a brief maximal effort; Plateau The highest pressure sustained for a defined minimum period; RV Residual volume; SEE Standard error of the estimate of the model
Characteristics of participants
The characteristics of the participants are summarized in Table 2. All studies used convenience samples except one (24), which used a random sample procedure. The total number of participants was 9723. Age ranged between 18 and 90 years. The number of men and women ranged from 23 to 1269, and nine to 1602, respectively. Most studies had more women except four (11,12,22,23). Nine studies were performed in North America (5,8,11,13,16,17,19,21,28), four in Brazil (15,24,29,30), three in India (10,22,23), two in Germany (25,27), and one in Italy (18), Sweden (12), England (14) and The Netherlands (26). Only seven studies reported the height and weight for each age group (10,12,13,24,26,29,30). Most studies included normal and overweight participants (body mass index [BMI] between 18.5 kg/m2 and 24.9 kg/m2 and between 25.0 kg/m2 and 29.9 kg/m2, respectively). Some participants in two reports were obese (21,27). Five studies reported other pulmonary function measures apart from forceded expiratory volume in 1 s (FEV1) (11,12,19,22,26). There were 10 studies that did not perform any subgroup analyses on smokers and nonsmokers (5,8,13–16,18,25–27). Of these, six studies did not report FEV1 values to substantiate the absence or presence of respiratory disease (5,14–16,18,26). Seventeen of the 18 studies stated that individuals with comorbidities, such as cardiac, neuromuscular or endocrine diseases, renal failure and active cancer treatment, were excluded (5,8,10,12,14, 16,17,21–30).
Characteristics of MIP technique
The methodology for measuring MIP varied considerably (Table 3). A flanged mouthpiece was used in five studies (14,16,22,24,27). A small leak was reported in 18 studies but the size was not specified in four (14,22,24,25). Most studies reported using nose clips (16 of 22) and provided instructions (18 of 22). The number of repetitive manoeuvres to obtain MIP was at least five in two studies (12,18) and at least seven in two others (25,27). In six studies, the authors considered the learning effect for MIP test; it was reported that the final manoeuvre was not the best manoeuvre in five studies (12,16,24,25,28), the test could be stopped when the subject considered him or herself unable to perform better (22). Several studies considered the highest value within two or three measures that were within 5% to 10% (Table 3). The lower limit of normal was reported in nine studies (8,19,21,24,25,27–30). Most used the fifth percentile of the negative residuals of MIP (8,19,21,25,27,30), which was calculated in each age group for both sexes in one report (27). In contrast, two studies provided an alternative definition (Table 3) and one did not define the lower limit of normal (28).
Meta-analyses
MIP values for men and women in different age groups derived from the random-effects analysis are shown in Table 4. Each age range reflected data from 59 to 96 subjects from at least five of the six studies (12,15,24,26,29,30). The total number of participants was 840. These six studies had an average QUADAS quality score of 3.5 of 7 (range 2 to 6). MIP decreased with age for both men and women. For the same age group, men tended to have a higher MIP than women. Sensitivity analysis of withdrawing studies from the meta-analysis often lowered the Q statistic. One study (26) contributed more to the Q statistic than the other five. MIP values from this report were within the range of the other five studies. As mentioned in the methods section, the random-effects model (40) was selected for the meta-analyses to examine methodological variations of the included studies.
TABLE 4.
Maximal inspiratory pressure (MIP) for men and women in different age groups derived from the random-effects model used in the meta-analysis
| Age group, years |
Men
|
Women
|
||
|---|---|---|---|---|
| Studies, n/sample size, n | MIP, cmH2O, mean (95% CI) | Studies, n/sample size, n | MIP, cmH2O, mean (95% CI) | |
| 18–29 | 6/96 | 128.0 (116.3–139.5) | 6/92 | 97.0 (88.6–105.4) |
| 30–39 | 6/69 | 128.5 (118.3–138.7) | 6/66 | 89.0 (84.5–93.5) |
| 40–49 | 6/72 | 117.1 (104.9–129.2) | 6/71 | 92.9 (78.4–107.4) |
| 50–59 | 5/61 | 108.1 (98.7–117.6) | 5/60 | 79.7 (74.9–84.9) |
| 60–69 | 5/65 | 92.7 (84.6–100.8) | 5/66 | 75.1 (67.3–82.9) |
| 70–83 | 5/63 | 76.2 (66.1–86.4) | 5/59 | 65.3 (57.8–72.7) |
DISCUSSION
Our meta-analysis provides a synthesis of normative values for MIPs, the most commonly performed measure to indicate inspiratory muscle strength. We reported data based on 840 subjects, the largest and most representative reference group available for this measure. This synthesis demonstrates strong age-related trends and sex differences in MIP, similar to trends reported by the included studies.
Our meta-analysis considered data from 840 subjects recruited from North America, Brazil, Sweden and The Netherlands. Therefore, the reference values are reflective of women and men from different ethnic backgrounds, with associated differences in body stature that could be expressed as variations in MIPs. Mean MIP data from each of the six studies that contributed to the meta-analyses had mean values (in different age groups for each sex) that overlapped with at least one other study. MIP values from three reports (29,12,24) were generally higher for all age groups in both sexes, whereas the data from the two reports (26,30) were generally lower in both sexes for most age groups. Interestingly, the two studies that recruited American subjects and reported the highest quality scores (8,21) provided regression equations that produced MIPs that were higher than our mean values in one case (21) and lower in the other (8). In other words, the reports with high methodological quality provided mean MIP values that bracket the mean data derived from our synthesis, which lends further credence to the validity of the data derived by the meta-analyses.
Application of reference values require consideration of participant and methodological differences. Participant characteristics varied considerably among studies, and many of these could not be considered by our subgroup analyses. In addition to age and sex, other factors are reported to influence MIP (eg, height, weight, fitness and smoking status) (31–33). Unfortunately, there is no consensus regarding which of these variables have a significant influence on MIP or the directional influence of some of these variables. For example, height has been shown to be positively predictive (14,22), negatively predictive (8,22) and not predictive (5,16,18,19,21,23–25,29,30) of MIP. Smoking exemplifies another characteristic that could influence normative values if the participant had undetected lung disease.
Most studies demonstrated that MIP was significantly affected by sex and age in healthy subjects. This is in accordance with the study by Black and Hyatt (5), who reported a linear regression of MIP on age in both males and females; however, the regression was not significant in subjects <55 years of age. Our data are in accordance with this early investigation (5) and indicates modest decreases in MIP before 45 to 55 years of age (Table 4). Unfortunately, there is no consensus regarding the threshold when age-related decline in MIP occurs. It has been reported to occur after 30 years of age in one study (16) or after 60 years of age in another (25). It is plausible that MIP has not undergone study with sufficiently large sample sizes to determine the many factors that may contribute to valid reference values. A recent article on reference values for spirometry examined 55,136 healthy subjects (45), whereas the number of participants in the studies for the present systematic review ranged from 60 to 252. Considering the relatively small sample sizes and the ethnic diversity in studies performed on different continents, it is not surprising that MIP values varied among studies. Future studies should recruit larger numbers and factor in confounders such as ethnicity, smoking history, physical activity and parameters of body stature (ie, BMI, height and weight).
A primary methodological issue that likely contributed to the large interstudy variation of normative values for MIP is participant learning. Given that MIP is volitional, it requires full understanding of the task to be performed, maximal participant effort and enthusiastic coaching from the technologist. To attain a valid MIP, the selection of truly maximum efforts depends not only on setting a limit on variation between successive measurements, but also by carefully considering whether optimal learning has occurred. Several studies did not consider the need to continue the test if the final manoeuvre was the highest value (5,8,10,11,13–15,17–19,21–23,27,28,30). Incomplete learning combined with too few repetitions to achieve a maximal value are likely primary factors that influence heterogeneity of MIP values among studies.
The large interstudy variation of normative values for MIP may also be explained by technical aspects of test performance including variation in the type of mouthpiece, size of leak and the point of MIP measurement (peak or plateau) (Table 3). Five of the 22 studies used flanged mouthpieces (14,16,22,24,27), which have been reported to provide lower values than those obtained with rubber tube mouthpieces (1). A larger leak can also result in lower values (ie, MIP measurements obtained with leak of 2 mm internal diameter were 17% and 22% lower than those with leak of 1 mm or no leak, respectively) (35). A plateau measure that is averaged over 1 s would be lower than a peak pressure defined as the highest value reached during a brief maximal effort (18,19). Notably, not all studies after 2002 used the 1 s average pressure, which was recommended by the ATS/ERS, even though this measure is more reproducible than the peak pressure (1,46).
Limitations
The present synthesis was limited by variability in study quality, participant characteristics and MIP technique. Of the 22 included studies, only six were included in the present meta-analysis because of the necessity for MIP data to be reported according to sex and stratified into one or more of six comparable age groups (Table 4). Nine other included studies stratified MIP data according to age groups; however, the categories included either a wider age range or straddled the above-mentioned groupings (5,8,11,13,14,17,21,23,25). The methodological quality of studies (ie, QUADAS assessment) examined in the meta-analysis ranged between 2 and 6. Unfortunately, it was not possible to include some of the studies that had a QUADAS score of 7 of 7 because the MIP data were not reported in similar age groups (8) or they were presented as regression equations (8,21).
Despite an ATS/ERS statement on respiratory muscle testing, many subsequent reports included in the present review did not describe methods consistent with these guidelines. Several studies did not use the recommended flanged mouthpiece or did not report the type of mouthpiece (26–30). Description of a sustained pressure for 1.5 s to evaluate the maximum sustained pressure for 1 s was rarely detailed. It was also seldom noted whether the tester was experienced, and how much urging and encouragement was provided to the individual being tested. Regarding some of these technical issues, it was not possible to conclude whether some of these methods were not performed or simply not reported.
Attributing a bias toward larger or smaller MIP due to participant characteristics in a particular study was also difficult because of small sample sizes, the large number of potential confounders that could influence strength measures, and equivocal findings regarding their effect. For example, greater height and fitness were not consistently associated with higher MIPs. Because of these uncertainties and omissions in reporting, it was difficult to conclude whether MIP data were higher or lower in a particular study due to differences in MIP technique or participant characteristics. Thus, to date, no predictable correction factors can be applied to MIP data to normalize technical or participant differences.
Practical implications
Standardized techniques for measuring MIP will ensure more reliable and valid data. The ATS/ERS statement on respiratory muscle testing recommends that MIPs are measured using a flanged mouthpiece with a 2 mm leak at residual volume (1). The latter two criteria were consistently met by all six studies included in the present meta-analysis (12,15,24,26,29,30). A sustained pressure for 1.5 s to evaluate the maximum sustained pressure for 1 s is also recommended to obtain reliable measures (1). Finally, the importance of an experienced tester who can optimize volitional effort of the participant by clear instruction and strong encouragement is essential (1). These latter two issues, although not always reported in the included studies, are highly recommended for attaining MIP.
Regardless of the reasons for the differences in MIP among studies, appropriate normative values are required by pulmonary function laboratories to provide a valid reference of respiratory function for an individual patient. Ideally, appropriate reference values should be obtained in the same laboratory from a sample that represents the demographic characteristics of the patients to be tested. From a practical perspective, such reference values are usually not established in many centres due to limited resources. In these situations, the data provided by our meta-analysis are likely the broadest representation of an ethnically diverse sample and are recommended for general use when patient referrals have considerable ethnic variation. Whether using these data or reference values from a single study, selection should be determined by ensuring close alliance with ATS/ERS methodology of MIP measures and that the participants’ characteristics were similar to those of the patient of interest.
Future larger-scale studies are required to investigate other subject-related factors that influence MIPs, aside from age and sex. Until larger-scale studies of similar magnitude to the reported 55,136 healthy subjects for spirometric reference values (45), confirmation of additional independent correlates of MIP (such as height, BMI, fitness, smoking) is unlikely. These normative reference values are especially important to establish in elderly patients because the commonly accepted threshold to indicate inspiratory weakness is 80 cmH2O; this value is lower than the predicted mean values reported in several studies including the data synthesized in the present meta-analysis.
Footnotes
AUTHOR CONTRIBUTIONS: Study concept and design: ISP, VFP, WDR, GF; Data acquisition, analysis or interpretation of data: ISP, VFP, WDR, AWS, FC; Drafting the manuscript, revising and approval of the submitted and final version: ISP, VFP, AWS, FC, GF, WDR.
DISCLOSURES: The authors have no financial disclosurs or conflicts of interest to declare.
REFERENCES
- 1.ATS/ERS Statement on respiratory muscle testing. Am J Respir Crit Care Med. 2002;166(Suppl 15):518–624. doi: 10.1164/rccm.166.4.518. [DOI] [PubMed] [Google Scholar]
- 2.Meyer FJ, Lossnitzer D, Kristen AV, et al. Respiratory muscle dysfunction in idiopathic pulmonary arterial hypertension. Eur Respir J. 2005;25:125–30. doi: 10.1183/09031936.04.00095804. [DOI] [PubMed] [Google Scholar]
- 3.Meyer FJ, Borst MM, Zugck C, et al. Respiratory muscle dysfunction in congestive heart failure: Clinical correlation and prognostic significance. Circulation. 2001;103:2153–8. doi: 10.1161/01.cir.103.17.2153. [DOI] [PubMed] [Google Scholar]
- 4.Wijkstra PJ, Van der Mark TW, Boezen M, Van AR, Postma DS, Koeter GH. Peak inspiratory mouth pressure in healthy subjects and in patients with COPD. Chest. 1995;107:652–6. doi: 10.1378/chest.107.3.652. [DOI] [PubMed] [Google Scholar]
- 5.Black LF, Hyatt RE. Maximal respiratory pressures: Normal values and relationship to age and sex. Am Rev Respir Dis. 1969;99:696–702. doi: 10.1164/arrd.1969.99.5.696. [DOI] [PubMed] [Google Scholar]
- 6.Mehta S. Neuromuscular disease causing acute respiratory failure. Respir Care. 2006;51:1016–21. [PubMed] [Google Scholar]
- 7.Evans JA, Whitelaw WA. The assessment of maximal respiratory mouth pressures in adults. Respir Care. 2009;54:1348–59. [PubMed] [Google Scholar]
- 8.Harik-Khan RI, Wise RA, Fozard JL. Determinants of maximal inspiratory pressure. The Baltimore Longitudinal Study of Aging. Am J Respir Crit Care Med. 1998;158:1459–64. doi: 10.1164/ajrccm.158.5.9712006. [DOI] [PubMed] [Google Scholar]
- 9.Koch B, Schaper C, Ittermann T, et al. Reference values for respiratory pressures in a general adult population – results of the Study of Health in Pomerania (SHIP) Clin Physiol Funct Imaging. 2010;30:460–5. doi: 10.1111/j.1475-097X.2010.00966.x. [DOI] [PubMed] [Google Scholar]
- 10.Gopalakrishna A, Vaishali K, Prem V, Aaron P. Normative values for maximal respiratory pressures in an Indian Mangalore population: A cross-sectional pilot study. Lung India. 2011;28:247–52. doi: 10.4103/0970-2113.85684. [DOI] [PMC free article] [PubMed] [Google Scholar]
- 11.Cook CD, Mead J, Orzalesi MM. Static volume-pressure characteristics of the respiratory system during maximal efforts. J Appl Physiol. 1964;19:1016–22. doi: 10.1152/jappl.1964.19.5.1016. [DOI] [PubMed] [Google Scholar]
- 12.Ringqvist T. The ventilatory capacity in healthy subjects. An analysis of causal factors with special reference to the respiratory forces. Scand J Clin Lab Invest. 1966;88:5–179. [PubMed] [Google Scholar]
- 13.Leech JA, Ghezzo H, Stevens D, Becklake MR. Respiratory pressures and function in young adults. Am Rev Respir Dis. 1983;128:17–23. doi: 10.1164/arrd.1983.128.1.17. [DOI] [PubMed] [Google Scholar]
- 14.Wilson SH, Cooke NT, Edwards RH, Spiro SG. Predicted normal values for maximal respiratory pressures in caucasian adults and children. Thorax. 1984;39:535–8. doi: 10.1136/thx.39.7.535. [DOI] [PMC free article] [PubMed] [Google Scholar]
- 15.Camelo JS, Jr, Terra Filho JT, Manco JC. Pressões respiratórias máximas em adultos normais. J Pneumol. 1985;11:181–4. [Google Scholar]
- 16.Vincken W, Ghezzo H, Cosio MG. Maximal static respiratory pressures in adults: normal values and their relationship to determinants of respiratory function. Bull Eur Physiopathol Respir. 1987;23:435–9. [PubMed] [Google Scholar]
- 17.McElvaney G, Blackie S, Morrison NJ, Wilcox PG, Fairbarn MS, Pardy RL. Maximal static respiratory pressures in the normal elderly. Am Rev Respir Dis. 1989;139:277–81. doi: 10.1164/ajrccm/139.1.277. [DOI] [PubMed] [Google Scholar]
- 18.Bruschi C, Cerveri I, Zoia MC, et al. Reference values of maximal respiratory mouth pressures: A population-based study. Am Rev Respir Dis. 1992;146:790–3. doi: 10.1164/ajrccm/146.3.790. [DOI] [PubMed] [Google Scholar]
- 19.Enright PL, Kronmal RA, Manolio TA, Schenker MB, Hyatt RE. Respiratory muscle strength in the elderly. Correlates and reference values. Cardiovascular Health Study Research Group. Am J Respir Crit Care Med. 1994;149:430–8. doi: 10.1164/ajrccm.149.2.8306041. [DOI] [PubMed] [Google Scholar]
- 20.Karvonen J, Saarelainen S, Nieminen MM. Measurement of respiratory muscle forces based on maximal inspiratory and expiratory pressures. Respiration. 1994;61:28–31. doi: 10.1159/000196299. [DOI] [PubMed] [Google Scholar]
- 21.Enright PL, Adams AB, Boyle PJ, Sherrill DL. Spirometry and maximal respiratory pressure references from healthy Minnesota 65- to 85-year-old women and men. Chest. 1995;108:663–9. doi: 10.1378/chest.108.3.663. [DOI] [PubMed] [Google Scholar]
- 22.Johan A, Chan CC, Chia HP, Chan OY, Wang YT. Maximal respiratory pressures in adult Chinese, Malays and Indians. Eur Respir J. 1997;10:2825–8. doi: 10.1183/09031936.97.10122825. [DOI] [PubMed] [Google Scholar]
- 23.Pande JN, Verma SK, Singh SP, Guleria R, Khilnani GC. Respiratory pressures in normal Indian subjects. Indian J Chest Dis Allied Sci. 1998;40:251–6. [PubMed] [Google Scholar]
- 24.Neder JA, Andreoni S, Lerario MC, Nery LE. Reference values for lung function tests. II. Maximal respiratory pressures and voluntary ventilation. Braz J Med Biol Res. 1999;32:719–27. doi: 10.1590/s0100-879x1999000600007. [DOI] [PubMed] [Google Scholar]
- 25.Hautmann H, Hefele S, Schotten K, Huber RM. Maximal inspiratory mouth pressures (PIMAX) in healthy subjects – what is the lower limit of normal? Respir Med. 2000;94:689–93. doi: 10.1053/rmed.2000.0802. [DOI] [PubMed] [Google Scholar]
- 26.Wohlgemuth M, Van der Kooi EL, Hendriks JC, Padberg GW, Folgering HT. Face mask spirometry and respiratory pressures in normal subjects. Eur Respir J. 2003;22:1001–6. doi: 10.1183/09031936.03.00028103. [DOI] [PubMed] [Google Scholar]
- 27.Windisch W, Hennings E, Sorichter S, Hamm H, Criee CP. Peak or plateau maximal inspiratory mouth pressure: Which is best? Eur Respir J. 2004;23:708–13. doi: 10.1183/09031936.04.00136104. [DOI] [PubMed] [Google Scholar]
- 28.Sachs MC, Enright PL, Hinckley Stukovsky KD, Jiang R, Barr RG. Performance of maximum inspiratory pressure tests and maximum inspiratory pressure reference equations for 4 race/ethnic groups. Respir Care. 2009;54:1321–8. [PMC free article] [PubMed] [Google Scholar]
- 29.Simões RP, Deus AP, Auad MA, Dionisio J, Mazzonetto M, Borghi-Silva A. Maximal respiratory pressure in healthy 20 to 89 year-old sedentary individuals of central Sao Paulo State. Rev Bras Fisioter. 2010;14:60–7. doi: 10.1590/s1413-35552010000100010. [DOI] [PubMed] [Google Scholar]
- 30.Costa D, Goncalves HA, Lima LP, Ike D, Cancelliero KM, Montebelo MI. New reference values for maximal respiratory pressures in the Brazilian population. J Bras Pneumol. 2010;36:306–12. doi: 10.1590/s1806-37132010000300007. [DOI] [PubMed] [Google Scholar]
- 31.Carpenter MA, Tockman MS, Hutchinson RG, Davis CE, Heiss G. Demographic and anthropometric correlates of maximum inspiratory pressure: The Atherosclerosis Risk in Communities Study. Am J Respir Crit Care Med. 1999;159:415–22. doi: 10.1164/ajrccm.159.2.9708076. [DOI] [PubMed] [Google Scholar]
- 32.McConnell AK, Copestake AJ. Maximum static respiratory pressures in healthy elderly men and women: Issues of reproducibility and interpretation. Respiration. 1999;66:251–8. doi: 10.1159/000029386. [DOI] [PubMed] [Google Scholar]
- 33.Chen HI, Kuo CS. Relationship between respiratory muscle function and age, sex, and other factors. J Appl Physiol. 1989;66:943–8. doi: 10.1152/jappl.1989.66.2.943. [DOI] [PubMed] [Google Scholar]
- 34.Koulouris N, Mulvey DA, Laroche CM, Green M, Moxham J. Comparison of two different mouthpieces for the measurement of Pimax and Pemax in normal and weak subjects. Eur Respir J. 1988;1:863–7. [PubMed] [Google Scholar]
- 35.Mayos M, Giner J, Casan P, Sanchis J. Measurement of maximal static respiratory pressures at the mouth with different air leaks. Chest. 1991;100:364–6. doi: 10.1378/chest.100.2.364. [DOI] [PubMed] [Google Scholar]
- 36.Whiting P, Rutjes AW, Reitsma JB, Bossuyt PM, Kleijnen J. The development of QUADAS: A tool for the quality assessment of studies of diagnostic accuracy included in systematic reviews. BMC Med Res Methodol. 2003;10:3–25. doi: 10.1186/1471-2288-3-25. [DOI] [PMC free article] [PubMed] [Google Scholar]
- 37.Whiting PF, Weswood ME, Rutjes AW, Reitsma JB, Bossuyt PN, Kleijnen J. Evaluation of QUADAS, a tool for the quality assessment of diagnostic accuracy studies. BMC Med Res Methodol. 2006;6:9. doi: 10.1186/1471-2288-6-9. [DOI] [PMC free article] [PubMed] [Google Scholar]
- 38.Borenstein M, Hedges L, Rothstein H. Meta-analysis: Fixed effect vs random effects. < www.meta-analysis.com/downloads/Meta-analysis%20fixed%20effect%20vs%20random%20effects_orig.pdf> (Accessed August 1, 2012) [DOI] [PubMed]
- 39.Wilson DB. Meta-analysis stuff. < http://mason.gmu.edu/~dwilsonb/home.html> (Accessed January 6, 2012)
- 40.Pigott T. Fixed and random effect models in meta-analysis. < www.campbellcollaboration.org/artman2/uploads/1/2_Pigott_RandomFixedModels.pdf> (Accessed May 8, 2012)
- 41.Marín-Martínez F, Sánchez-Meca J. Weighting by inverse variance or by sample size in random effects meta-analysis. Educational and Psychological Measuremen. 2010;70:56–73. [Google Scholar]
- 42.Arora NS, Rochester DF. Respiratory muscle strength and maximal voluntary ventilation in undernourished patients. Am Rev Respir Dis. 1982;126:5–8. doi: 10.1164/arrd.1982.126.1.5. [DOI] [PubMed] [Google Scholar]
- 43.Rodrigues F, Bárbara C. Pressões respiratórias máximas – Proposta de um protocolo de procedimentos. Rev Port Pneumol. 2000;4:297–307. [Google Scholar]
- 44.Charfi MR, Martran R, Regnard J, et al. Les pressions ventilatoires maximales a la bouche chez I’adulte : valeurs normales et variables explicatives. Rev Mal Respir. 1991;8:367–74. [PubMed] [Google Scholar]
- 45.Quanjer PH, Hall GL, Stanojevic S, Cole TJ, Stocks J. Age- and height-based prediction bias in spirometry reference equations. Eur Respir J. 2012;40:190–7. doi: 10.1183/09031936.00161011. [DOI] [PubMed] [Google Scholar]
- 46.Hamnegard CH, Wragg S, Kyroussis D, Aquilina R, Moxham J, Green M. Portable measurement of maximum mouth pressures. Eur Respir J. 1994;7:398–401. doi: 10.1183/09031936.94.07020398. [DOI] [PubMed] [Google Scholar]