

Abstract
Genetic variation at the chromosome 9p21 risk locus promotes cardiovascular disease; however, it is unclear how or which proteins encoded at this locus contribute to disease. We have previously demonstrated that loss of one candidate gene at this locus, cyclin-dependent kinase inhibitor 2B (Cdkn2b), in mice promotes vascular SMC apoptosis and aneurysm progression. Here, we investigated the role of Cdnk2b in atherogenesis and found that in a mouse model of atherosclerosis, deletion of Cdnk2b promoted advanced development of atherosclerotic plaques composed of large necrotic cores. Furthermore, human carriers of the 9p21 risk allele had reduced expression of CDKN2B in atherosclerotic plaques, which was associated with impaired expression of calreticulin, a ligand required for activation of engulfment receptors on phagocytic cells. As a result of decreased calreticulin, CDKN2B-deficient apoptotic bodies were resistant to efferocytosis and not efficiently cleared by neighboring macrophages. These uncleared SMCs elicited a series of proatherogenic juxtacrine responses associated with increased foam cell formation and inflammatory cytokine elaboration. The addition of exogenous calreticulin reversed defects associated with loss of Cdkn2b and normalized engulfment of Cdkn2b-deficient cells. Together, these data suggest that loss of CDKN2B promotes atherosclerosis by increasing the size and complexity of the lipid-laden necrotic core through impaired efferocytosis.
Introduction
Traditional risk factors account for approximately half of an individual’s lifetime risk of cardiovascular disease (1, 2). The balance, therefore, is accounted for by a combination of unmeasured environmental exposures and genetic factors. The recent advent of the genome-wide association study (GWAS) platform has made it possible to investigate the heritable component of complex polygenic disorders, such as atherosclerotic coronary artery disease (CAD). Using this approach, a region on chromosome 9p21 has repeatedly been identified in GWAS as the top locus for complex cardiovascular disease (3, 4). Available data suggest that the risk-associated polymorphisms (a) are very common, with as much as a fifth of the world population carrying two copies of the risk allele (minor allele frequency ~50%) (5); (b) are independent of all established risk factors, suggesting a novel mechanism of action (6); (c) are responsible for up to 21% of the attributable risk of myocardial infarction (MI) (3); and (d) promote risk across a spectrum of vascular diseases, including CAD, stroke, peripheral artery disease (PAD), and abdominal aortic aneurysm (AAA) (7). Elucidating the vascular biology of the 9p21 locus has become a priority for the scientific community.
Because the most highly associated SNPs occur in a noncoding region of the genome, a number of expression quantitative trait locus (eQTL) and allelic expression imbalance (AEI) studies have been performed in an attempt to identify the causal gene(s) that are dysregulated in carriers of the 9p21 risk variant. Though a variety of associations have been reported (8–12), reduced expression of the nearby tumor-suppressor gene CDKN2B has now been observed in several tissues from carriers of the risk allele, including adipose tissue and circulating cells (8, 13), as well as in the end organ, including atherosclerotic plaque and vascular SMCs (14, 15). CDKN2B is a well-described cell cycle inhibitor that is frequently lost during malignant transformation, but had not previously been implicated in vascular disease. We recently reported that CDKN2B does play a role in vascular SMC physiology and that Cdkn2b knockout mice develop advanced aneurysms related to accelerated SMC apoptosis and medial thinning (16). Because the mechanism(s) by which 9p21 promote coronary disease remain unclear and the subject of debate (17–22), we hypothesized that CDKN2B’s effects on programmed cell death contribute to the development of CAD by stimulating the accumulation of necrotic debris within the evolving plaque. In the experiments discussed below, we continued to pursue the role of this candidate gene in a murine model of atherogenesis, with a focus on its ability to regulate the clearance of apoptotic bodies (ABs) and the proatherosclerotic consequences of failed phagocytosis.
Results
Cdkn2b regulates atherosclerotic lesion size and features of plaque vulnerability in vivo.
To study the effect of Cdkn2b on atherosclerosis in vivo, we evaluated a total of 114 male and female Cdkn2b–/–,ApoE–/–, Cdkn2b+/–,ApoE–/–, and Cdkn2b+/+,ApoE–/– mice that had been fed a high-fat Western diet for 4, 8, or 12 weeks. Total atherosclerotic burden was increased in male Cdkn2b–/–,ApoE–/– animals as soon as 8 weeks after initiating the high-fat diet, as measured by the Oil Red O–positive (ORO-positive) area within the aortic sinus (35.1% increase, P = 0.02; Supplemental Figure 1A; supplemental material available online with this article; doi: 10.1172/JCI70391DS1). These differences persisted over time to the terminal endpoint of 12 weeks (33.8% increase, P = 0.001), with an intermediate phenotype observed for heterozygous animals (P for trend < 0.001; Figure 1A). Similar changes in atherosclerotic burden were observed in female mice (17.5% increase, P = 0.04; Supplemental Figure 1B). At the terminal endpoint, lesions from Cdkn2b–/–,ApoE–/– mice displayed several features of plaque vulnerability, including reduced lesional α-SMA content (34.0% reduction, P < 0.02; Figure 1B) and larger necrotic cores (37% increase, P < 0.03; Figure 1C and Supplemental Figure 1C), with no change in Mac-3 staining (P = 0.26; Figure 1D) relative to lesions from control animals. We observed similar findings in the brachiocephalic artery, in which Cdkn2b–/–,ApoE–/– lesions displayed decreased collagen content (50.2% reduction, P < 0.05; Figure 1F), reduced α-SMA content (34.1%, P < 0.02; Figure 1G), and thinning of the fibrous cap overlying the necrotic core of the lesion (54.2% reduction, P < 0.04; Figure 1H). We observed no change in macrophage content between genotypes (P = 0.89; Figure 1I). At this terminal endpoint, very few TUNEL-positive cells were present (~0–2/section), and we observed no difference in apoptosis between genotypes (38.5% increase in TUNEL-positive cells, P = 0.54; Figure 1E). Conversely, Cdkn2b–/–,ApoE–/– mice infused with angiotensin II for 72 hours at an early time point (4 weeks, Western diet) displayed a 97% increase in apoptotic cells relative to controls (P = 0.06; Supplemental Figure 1D). The compensatory expression of other 9p21 locus genes is provided in Supplemental Figure 1E. We observed no difference in glucose or lipid levels across the genotypes (Supplemental Figure 1F).
Figure 1. Cdkn2b regulates atherosclerotic lesion size and growth of the necrotic core.

(A) Compared with Cdkn2b+/+,ApoE–/– control mice (n = 22), Cdkn2b–/–,ApoE–/– (n = 22) mice developed significantly larger aortic sinus atherosclerotic plaques, as assessed by the ORO-positive area. An intermediate phenotype was observed in heterozygous Cdkn2b+/–,ApoE–/– mice (n = 10). (B) These lesions displayed reduced α-SMA content and (C) larger necrotic cores, with (D) no increase in macrophage burden. (E) Only a trend toward a higher rate of apoptosis could be detected in Cdkn2b–/–,ApoE–/– animals at the terminal time point. (F) Brachiocephalic artery lesions in Cdkn2b–/–,ApoE–/– mice displayed several features of lesion vulnerability, including reduced plaque collagen content, (G) reduced α-SMA content and cap coverage, and (H) thinning of the fibrous cap overlying the necrotic core. (I) No difference in macrophage burden was appreciated in the brachiocephalic lesions across genotypes. Original magnification, ×4 for all aortic sinus images, ×10 for the Trichrome images in C, and ×10 for all brachiocephalic images. *P < 0.05; †P < 0.03; **P < 0.001.
Reduced expression of CDKN2B is associated with reduced expression of the phagocyte receptor ligand calreticulin in human coronary artery atherosclerotic plaque, human vascular SMC, and mouse aorta; and eQTL analysis confirms the association between 9p21, CDKN2B, and calreticulin in human carotid artery atherosclerotic plaque.
To explain the larger necrotic cores observed in the Cdkn2b–/–,ApoE–/– mice, we next evaluated the expression of several pro- and antiphagocytic molecules (known as “eat-me” and “don’t-eat-me” ligands, respectively) in 51 human coronary artery sections with and without atherosclerotic lesions. We first evaluated the relationship between CDKN2B and 28 genes that have previously been implicated in the clearance of apoptotic debris, a process known as efferocytosis. Weighted gene coexpression network analysis revealed two modules of efferocytosis gene expression (Supplemental Figure 2A). Eigengene analysis revealed that the module containing CDKN2B had significantly lower expression in samples with atherosclerotic lesions than in those without atherosclerotic lesions (log2 expression 0.16 vs. 0.27, for samples with and without lesions, respectively, P = 0.00000016; Figure 2A). We next used naive expression clustering of all 20,226 transcripts annotated on the array into 51 modules using weighted gene coexpression analysis to identify genes that share local coexpression topology with CDKN2B (Supplemental Figure 2, B and C). Of the candidate efferocytosis genes, only calreticulin (CALR), a key phagocyte receptor ligand, was found in the coexpression module to which CDKN2B was assigned (Figure 2B; global gene and module summary provided in Supplemental Table 1). CALR was positively correlated with CDKN2B expression (r2 = 0.32, P = 0.02; Figure 2C, such that patients with impaired vascular CDKN2B also had reduced expression of CALR in vivo. Similar findings were observed in vitro in CDKN2B-deficient (siCDKN2B) human coronary artery SMCs (HCASMCs) at baseline and during apoptosis (P < 0.01 each; Figure 2D and Supplemental Figure 2, D and E), and in vivo in Cdkn2b–/– aortic and kidney tissue (P < 0.01 each; Figure 2E). We also observed a gene-dosage effect, with an intermediate reduction in Calr measured in aortic tissue from heterozygous Cdkn2b+/–,ApoE–/– animals relative to Cdkn2b–/–,ApoE–/– knockout animals (Supplemental Figure 2F). Semiquantitative immunostaining confirmed the downregulation of CALR in atherosclerotic plaque from Cdkn2b–/–,ApoE–/– mice (Figure 2F).
Figure 2. Loss of CDKN2B is associated with reduced expression of the key phagocyte receptor ligand calreticulin.

Weighted gene coexpression analysis of 51 HCA segments revealed that CDKN2B colocalizes with CALR in (A) local coexpression topology with efferocytosis genes that are downregulated in coronary artery samples with atherosclerotic lesions compared with those without atherosclerotic lesions (**P < 0.001), and (B) global module discovery in weighted gene coexpression analysis of 20,226 transcripts. Node color in network graph corresponds to module assignment. Inset depicts module containing CDKN2B and CALR identified via hierarchical clustering of the topological overlap between all transcript pairs. Node color in inset corresponds to differential expression of module members in coronary artery samples with atherosclerotic lesions versus those without atherosclerotic lesions. (C) CDKN2B is directly correlated with CALR expression in coronary artery sections. In all network diagrams, the edge width corresponds to the topological overlap between linked nodes. (D) A similar pattern was observed in vitro, as CDKN2B-deficient HCAMSCs expressed lower levels of CALR than control-transfected HCASMCs (siControl), both at baseline and during apoptosis. #P < 0.01. (E) Cdkn2b–/–,ApoE–/– mice also expressed less Calr than Cdkn2b+/+,ApoE–/– mice in both the kidney and aorta. (F) Semiquantitative immunostaining confirmed the reduction of Calr expression in atherosclerotic plaque from Cdkn2b–/–,ApoE–/– animals. Original magnification, ×4. IHC, immunohistochemistry. (G) eQTL analysis of 127 human carotid artery atherosclerotic plaque samples revealed that carriers of a representative 9p21 risk allele (“G” in red, relative to ancestral “A” allele in black) have simultaneous reductions in the expression of both CDKN2B (left panel, *P < 0.05) and CALR (right panel, †P < 0.03).
We confirmed these associations in a validation cohort of 127 individuals who had undergone carotid endarterectomy and in whom the representative 9p21 SNP rs1412829 was found to be associated with reduced mRNA expression of both CDKN2B and CALR in atherosclerotic plaque (P < 0.05 and P < 0.03, respectively; Figure 2G). As observed in the human coronary artery samples, CDKN2B was significantly downregulated in atherosclerotic lesions compared with that seen in nonatherosclerotic control samples (log2 expression difference –0.28, P = 0.0041), and CALR and CDKN2B were again found to be positively correlated in carotid artery plaque (r2 = 0.74, P < 0.0001; Supplemental Figure 2G).
Calreticulin expression is regulated by a pathway that includes CDKN2B, retinoblastoma, and E2F4.
To investigate the molecular link between CDKN2B and CALR, we next examined the CALR promoter for putative transcription factor (TF) binding sites that might be related to the CDKN2B pathway (Supplemental Figure 3A). E2F4, an inhibitory TF downstream of TGF-β, CDKN2B, and retinoblastoma (RB), was identified as a candidate transcriptional regulator by several TF prediction algorithms (Table 1 and Supplemental Figure 3B). EMSAs revealed that the top E2F4 binding site within the CALR promoter (–150 bp from the transcription start site [TSS]; Supplemental Figure 3C) bound nuclear proteins from HCASMCs in vitro (Figure 3A, arrow). The binding pattern was similar to that observed in a reaction containing a positive control E2F4 binding site (Supplemental Figure 3D). Specificity of this binding reaction was confirmed in competition with an unlabeled CALR promoter probe included at ×100 excess (Figure 3A, arrowhead). Subsequent ChIP studies confirmed that this sequence specifically bound the E2F4 TF in HCASMCs in vivo, with 3.7-fold enrichment compared with IgG control (4.6 vs. 1.2% of input, P < 0.01; Figure 3B). Next, we used luciferase promoter reporter assays to show that the activity of the CALR promoter was dependent on both CDKN2B and RB, in which HEK cells overexpressing these genes showed increased CALR promoter activity (2.7- to 3.4-fold increase, P < 0.01; Figure 3C, bottom), while HEK cells transfected with siCDKN2B displayed reduced CALR promoter activity (37% reduction, P < 0.01; Figure 3C, top). Finally, we showed that CALR expression could be increased in response to TGF-β treatment in a dose-dependent manner and that this expression was substantially inhibited when either CDKN2B or RB signaling was impaired with siRNA (Figure 3D). Taken together, these data suggest that CALR expression is regulated by a cascade that involves the vascular cytokine TGF-β, the 9p21-related candidate gene CDKN2B, and the RB/E2F4 axis.
Table 1.
TF binding site prediction algorithms identify several putative E2F4 binding sites within the CALR promoter
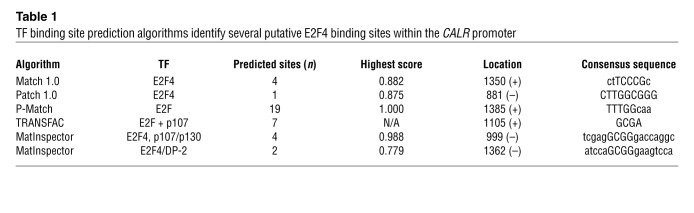
Figure 3. Calreticulin expression is regulated by a cascade that includes CDKN2B and the RB/E2F4 axis.

(A) EMSAs revealed specific binding of a g-32P-ATP-labeled CALR promoter oligonucleotide probe containing the top predicted E2F4 binding site (from Table 1) to nuclear extracts harvested from HCASMCs. Arrow indicates shifted complex (lane 2), which was no longer observed in a competition reaction containing ×100 unlabeled probe (lane 3, arrowhead). (B) ChIP studies revealed significant enrichment of E2F4 protein on the CALR promoter in human HCASMCs in vivo. (C) Overexpression and siRNA knockdown studies with dual-luciferase promoter reporter assays demonstrated that CALR expression is dependent on both CDKN2B and RB. (D) CALR expression was increased by TGF-β in a dose-dependent manner in control-transfected cells (gray bars). CDKN2B-deficient cells (black bars) displayed significantly less CALR reporter activity at baseline, and were unable to initiate CALR transcription in response to TGF-β. A similar pattern was observed in RB-deficient cells (white bars). #P < 0.01; †P < 0.03.
Reduced expression of CDKN2B renders SMCs resistant to efferocytic clearance by both professional and nonprofessional phagocytes, without altering the phagocytic capacity of neighboring SMCs.
To explore the physiological consequences of a loss of CDKN2B, we next performed a series of efferocytosis assays to investigate the impact of this gene on the “edibility” of ABs and the efferocytic capacity of phagocytic cells. In these experiments, control or CDKN2B-deficient cells were fluorescently labeled green, rendered apoptotic, then cocultured with orange-labeled phagocytes prior to flow cytometric analysis. We found that apoptotic siCDKN2B HCASMCs were cleared less efficiently than apoptotic control-transfected (siCont) HCASMCs by both professional and nonprofessional phagocytes (59.8% less efferocytosis by PMA-transformed THP-1 macrophages, P < 0.01, Figure 4A, and 20.0% less efferocytosis by untransfected nonapoptotic neighboring HCASMCs, P < 0.02, Figure 4B, respectively). Phagocytosis competition assays confirmed that siCDKN2B ABs were less likely to be engulfed than siCont ABs in a simultaneous coculture assay (19.1% fewer cleared cells per high-power field [HPF], P < 0.02; Figure 4C). Importantly, knocking down CDKN2B in nonprofessional phagocytes (e.g., HCASMCs) had no effect on their capacity to phagocytose cocultured ABs (P = 0.95; Supplemental Figure 4, A and B). Replication assays with primary Cdkn2b–/–, Cdkn2b+/–, and Cdkn2b+/+ aortic SMCs and thioglycollate-stimulated i.p. macrophages confirmed that knockout cells resisted engulfment (52.4% less efferocytosis, P < 0.01; Supplemental Figure 4C) and that heterozygous cells displayed an intermediate phenotype (Supplemental Figure 4D). Professional phagocytes (e.g., RAW, PMA-transformed THP-1, and primary murine peritoneal macrophages) had undetectable CDKN2B expression in vitro at baseline or after LPS stimulation (data not shown). Qualitative electron microscopic evaluation revealed that atherosclerotic plaques from Cdkn2b–/–,ApoE–/– animals displayed several features of failed efferocytosis, including large numbers of cells that had progressed from apoptotic to necrotic bodies as well as ABs not associated with an adjacent macrophage (Figure 4D and Supplemental Figure 4E). Conversely, plaques from Cdkn2+/+,ApoE–/– mice had less extracellular necrotic debris and displayed substantial numbers of phagocytes that had ingested multiple ABs, suggestive of efficient clearance of dying cells.
Figure 4. Loss of CDKN2B renders apoptotic SMCs “inedible.” (A) Flow cytometry-based phagocytosis assays revealed that apoptotic CDKN2B-deficient SMCs were significantly less likely to be cleared by primary macrophages than control ABs.

(B) Apoptotic CDKN2B-deficient HCASMCs were also resistant to efferocytic clearance by neighboring SMCs, which are known to function as nonprofessional phagocytes in conditions such as atherosclerosis. (C) Efferocytosis competition assays revealed that control-transfected ABs were more likely to be phagocytosed than CDKN2B-deficient ABs when cocultured with phagocytes in equal numbers. Original magnification, ×10. (D) Qualitative electron microscopy images revealed evidence of SMC necrosis in plaques from Cdkn2b–/–,ApoE–/– mice, as indicated by cells with condensed chromatin and disrupted plasma membranes (black arrow) and extracellular lysosomes, suggestive of cellular rupture (black arrowhead). Conversely, plaques from Cdkn2b+/+,ApoE–/– mice harbored little necrotic debris and were populated by phagocytes that had each engulfed numerous ABs, suggesting more robust efferocytic clearance (white arrow). Original magnification, ×1,200. Additional representative images are provided in Supplemental Figure 4. #P < 0.01; †P < 0.03.
Macrophages exposed to CDKN2B-deficient SMCs downregulate the ABCA1-dependent cholesterol efflux pathway, display accelerated rates of foam cell transformation, and secrete proatherogenic cytokines.
Because the loss of efferocytosis ligand expression on an AB has previously been shown to alter the behavior of the neighboring phagocyte (23), we next assessed the juxtacrine effects of CDKN2B-deficient ABs on cocultured macrophages. In particular, we focused on the macrophages’ capacity to regulate lipid handling and inflammation, as these are processes known to be related to efferocytosis (24, 25). RAW macrophages cocultured with apoptosing siCont SMCs increased their expression of the key reverse cholesterol transport molecule Abca1 compared with baseline levels (15.9-fold increase, P < 0.001; Figure 5A, gray bar), as previously described (26). However, those macrophages exposed to apoptosing CDKN2B-deficient SMCs displayed a blunted increase (9.7-fold, P < 0.001; Figure 5A, black bar). We confirmed this assay with primary Cdkn2b–/– and Cdkn2b+/+ aortic SMCs and RAW macrophages and observed a 26.5-fold increase in Abca1 expression for macrophages cocultured with knockout cells, which was blunted in comparison with the 39.5-fold increase we observed for macrophages cocultured with WT cells (P = 0.01; Supplemental Figure 5). In vivo, we found that Abca1 expression was reduced in Cdkn2b–/–,ApoE–/– aortic tissue relative to that detected in control aortae (65% reduction, P < 0.01; Figure 5B). To assess the physiological consequence of this reduction in Abca1, we performed radioactive cholesterol efflux studies and found that RAW cocultured with siCont ABs significantly increased their efflux of [3H]-labeled cholesterol compared with baseline (4.7-fold increase, P < 0.001; Figure 5C, gray bar), but that this change was blunted when RAW cells were cocultured with siCDKN2B ABs (2.9-fold increase, P = 0.02; Figure 5C, black bar). Consequently, we also observed that cholesterol-loaded macrophages exposed to CDKN2B-deficient SMCs were more likely to assume the foam cell phenotype, as quantified by total ORO content compared with that in macrophages cocultured with control ABs (2.9-fold increase in ORO-positive area between conditions, P = 0.03; Figure 5D). Ultimately, the downstream consequence of this failed efferocytosis and accelerated foam cell formation was the assumption of a proatherogenic profile, whereby macrophages cocultured with CDKN2B-deficient SMCs secreted higher levels of TNF-α and lower levels of the antiinflammatory cytokine IL-10 relative to macrophages cocultured with control-transfected SMCs (14.2% increase and 24.4% decrease, respectively, P < 0.01 for each; Figure 5, E and F).
Figure 5. Macrophage biology is perturbed by interactions with apoptotic CDKN2B-deficient SMCs.

(A) Macrophages cocultured with siCont ABs (gray bar) upregulated Abca1, a key reverse cholesterol transport gene, relative to baseline (white bar). This homeostatic pathway was significantly blunted when macrophages were cocultured with siCDKN2B ABs (black bar). (B) Aortic expression of Abca1 was also reduced in Cdkn2b–/–,ApoE–/– mice relative to that in Cdkn2b+/+,ApoE–/– control mice. (C) Similarly, macrophages cocultured with Cdkn2b+/+ ABs (gray bar) displayed the expected increase in tritium-labeled cholesterol efflux relative to baseline (white bar), but a blunted response was observed for macrophages cocultured with Cdkn2b–/– ABs (black bar). (D) As a result, foam cell formation was accelerated when oxidized LDL–loaded (OxLDL-loaded) macrophages (Mf) were cocultured with Cdkn2b–/– ABs (black bar) compared with that seen in Cdkn2b+/+ ABs (gray bar). Original magnification, ×20. (E and F) Macrophages cocultured with siCDKN2B ABs secrete less antiinflammatory IL-10 and more proinflammatory TNF-α (black bars) relative to macrophages cocultured with siCont ABs (gray bars). #P < 0.01; †P < 0.03.
Application of exogenous CALR normalizes the Cdkn2b-dependent defects in efferocytosis and foam cell formation.
Finally, to investigate the reversibility of the defects reported above, we repeated the in vitro phagocytosis assays before and after the application of recombinant CALR peptide. Using this approach, we observed a complete normalization of the baseline difference in engulfment between primary Cdkn2b–/– and Cdkn2b+/+ ABs (baseline difference = 42.8%, after CALR difference = 4.5%, P = 0.85; Figure 6A). Similarly, CALR peptide normalized the baseline difference in Abca1 expression by macrophages exposed to Cdkn2b–/– and Cdkn2b+/+ ABs (baseline difference = 13.0-fold, after CALR difference = 4.4-fold, P = 0.27; Figure 6B), and this in turn was associated with an amelioration in foam cell formation across genotypes (baseline difference = 20.9%, after CALR difference = 1.5%, P = 0.89; Figure 6C).
Figure 6. The Cdkn2b-dependent defect in efferocytosis is reversible.

(A) Application of exogenous CALR peptide abrogates the baseline difference in engulfment rates observed between Cdkn2b–/– ABs and Cdkn2b+/+ ABs. Exogenous CALR peptide also normalizes the baseline differences in Abca1 expression (B) and foam cell formation (C). Original magnification, ×20. #P < 0.01; †P < 0.03.
Discussion
Understanding how the 9p21 cardiovascular risk locus potentiates disease has proven challenging. The present study provides a hypothesis for how CDKN2B, a gene that may be dysregulated in carriers of the 9p21 risk allele, contributes to this risk. These data suggest that CDKN2B regulates the clearance of apoptotic debris and thus may alter the composition and size of the developing plaque.
First, we show that loss of Cdkn2b is associated with advanced atherosclerotic lesions composed of large, lipid-laden necrotic cores. Interestingly, a disease phenotype is observed even in heterozygous animals, which presumably reflect the modest reduction in CDKN2B thought to occur in human carriers of the 9p21 risk allele. Second, we show that CDKN2B-deficient apoptotic SMCs resist phagocytic clearance, providing a potential explanation for the observed acceleration in plaque growth. Third, we show that TGF-β signals through an RB-dependent cascade to initiate a phagocyte recognition signature, but that loss of CDKN2B impairs the expression of the key phagocyte receptor ligand calreticulin. Using an eQTL approach, we confirm the association between 9p21 and this proposed mechanism by documenting a coordinated reduction in the expression of both CDKN2B and CALR in atherosclerotic plaque from carriers of the risk allele. Fourth, we show that these changes contribute to pathological downstream crosstalk with neighboring macrophages, reduce reverse cholesterol transport, and promote inflammation and foam cell generation. Finally, we confirm the reversibility of these defects and show that Cdkn2b-dependent efferocytosis can be normalized by exogenous calreticulin in vitro. Taken together, these findings provide potential mechanistic insights into the heritable component of cardiovascular disease, may explain how the top GWAS hit promotes risk independently of classical risk factors, and may serve as a platform for novel translational therapies directed against atherosclerotic disorders.
It has been estimated that as many as one million cells undergo programmed cell death per second each day in the human body (27). Despite the frequency of this event, apoptotic cells are rarely observed in vivo, even in organs with high basal turnover rates such as the BM or thymus. This observation is attributed to the fact that ABs are rapidly and efficiently cleared by both professional (i.e., macrophage) and nonprofessional (i.e., neighboring cell) phagocytes. Previously considered an obligate homeostatic event, the process of efferocytosis (from the Greek, meaning “to carry the dead to the grave”) (28) is now known to occur as the result of highly orchestrated juxtacrine and paracrine signaling between the AB and its potential phagocyte. During programmed cell death, apoptosing cells secrete chemotactic “find-me” ligands, upregulate cell-surface “eat-me” ligands, and repress inhibitory “don’t-eat-me” signals (27). Remarkably, this process occurs in an immunologically silent manner (28, 29), whereby the successful execution of the engulfment process triggers an antiinflammatory cytokine profile from the phagocyte, presumably as a signal that no further immune activation is required. Conversely, apoptotic cells that evade clearance rapidly become secondarily necrotic and induce an inflammatory danger response (25) as they release toxic and antigenic intracellular content that was previously sequestered. Impaired efferocytosis is now recognized as a major driver of autoimmune, inflammatory, and malignant disorders, in which failed immune surveillance is thought to result from an imbalance in the pro- and antiphagocytosis signatures on target cells.
Atherosclerosis is a condition in which apoptosis is dramatically accelerated (30, 31). Complicating this is the fact that efferocytosis may be reduced by approximately 20-fold as the human atherosclerotic plaque develops (32). The reasons for this defect are not clear, but are likely related in part to competition for phagocyte receptors by oxidized LDL, inflammation-induced degradation of phagocytosis signals, accelerated loss of efferocytes in response to oxidative stress, and/or generation of autoantibodies that mask important cell surface ligands on the AB (23, 25, 30, 33, 34). Currently, it is difficult to explicitly quantify efferocytosis in the blood vessel wall or experimentally separate the engulfment-modifying properties of a given gene from its other plaque-modifying properties during lesion development. Nevertheless, atherosclerosis can be accelerated in murine models by reducing the expression of putative “eat-me” ligands in vivo, and these lesions display advanced necrotic cores replete with apoptotic corpses (23, 35–37). Theoretically, impaired efferocytosis would be predicted to influence the clinical consequences of atherogenesis (38), given that delayed clearance of dying SMCs promotes both vascular inflammation (25) and matrix destabilization (39) and that residual necrotic debris frequently localizes to regions of the lesion most susceptible to rupture (40). The fact that loss of Cdkn2b in mice increases the size of the plaque and its lipid core while reducing the thickness and stability of the fibrous cap may partially explain the simultaneous association in humans between 9p21 and both total CAD burden and acute clinical events, such as MI.
Impaired efferocytosis may also promote atherosclerosis secondarily through the phagocyte. Emerging evidence has revealed that the phenotype of the apoptosing cell can have a dramatic impact on the behavior of the nearby macrophage and its ultimate capacity to maintain lipid homeostasis. Under physiological conditions, macrophages that have successfully engaged an AB upregulate transmembrane export pathways downstream of LRP1 and a variety of nuclear receptors, presumably in preparation for the impending doubling of their intracellular content (24, 27). A key effector molecule in this pathway is ABCA1 (41), which promotes reverse cholesterol efflux and phagocyte survival (42) and limits the local accumulation of cholesterol in the fatty streak. In the current study, macrophages presented with CDKN2B-deficient ABs failed to activate this pathway and could not process oxidized lipids efficiently. Mechanistically, this likely occurred because CDKN2B-deficient cells express low levels of CALR, which is a well-described ligand for the LRP1 receptor (43, 44). As a consequence, we observed that these otherwise healthy macrophages displayed a blunted increase in Abca1 expression and were more likely to differentiate into foam cells — a maladaptive and proatherosclerotic process (45). Thus, while the efferocytic capacity of the phagocyte is not altered by its basal CDKN2B expression (Supplemental Figure 4B), its ultimate participation in the atherogenesis process is highly dependent on whether it encounters a normal AB or one that has been rendered “inedible” due to a lack of CDKN2B (Figure 7).
Figure 7. Proposed mechanism by which loss of CDKN2B impairs efferocytosis and promotes vascular disease.

(A) In subjects with normal levels of CDKN2B, E2F4 remains bound to RB and is not able to repress CALR expression. CALR is therefore expressed on the surface of the AB and activates LRP-1–dependent ABCA1 expression, reverse cholesterol transport, and phagocytosis. Because this efferocytosis pathway is intact, the AB is efficiently cleared, and the macrophage maintains a quiescent antiinflammatory profile. (B) In subjects who have reduced levels of CDKN2B, E2F4 is released from phosphorylated RB and inhibits CALR expression. Because it does not express an “eat-me” signature, the AB is not engaged by a neighboring phagocyte and rapidly undergoes secondary necrosis. As a consequence of this failed efferocytosis, the macrophage assumes an inflammatory foam cell phenotype.
These data suggest that CDKN2B mediates its phagocytic effects through calreticulin. Calreticulin is an evolutionarily conserved 46-kD chaperone protein that regulates a variety of cellular functions including calcium homeostasis, cell adhesion, wound healing, immunity, fibrosis, and the response to stress (28, 46). Additionally, CALR is a major regulator of efferocytosis and a critical engulfment ligand that is absolutely required for phagocytic clearance (28). During apoptosis, CALR colocalizes to the surface of the AB with exposed phosphatidylserine and activates LRP1 on the surface of the adjacent macrophage (28, 46). Interestingly, prior studies have shown that mice deficient in this Calr receptor phenocopy several aspects of the Cdkn2b-deficient mouse, including the propensity to develop large aortic aneurysms and advanced lipid-laden atherosclerotic plaques, with no difference in plasma lipoprotein levels (reviewed in ref. 43). Further, CALR has also been identified as a key regulator of tumor surveillance and the clearance of malignant cells (47, 48). It is therefore tempting to speculate whether CDKN2B, a well-described tumor-suppressor gene, regulates cancer not only by inhibiting the G1-S transition but also by maintaining the appropriate balance of pro- and antiefferocytosis antigens presented by a dysplastic cell.
Future studies are needed to determine whether efferocytosis can be induced as a means to slow plaque growth or potentially stimulate regression of the necrotic core. The fact that the simple application of exogenous CALR peptide is sufficient to normalize Cdkn2b-dependent efferocytosis in vitro suggests that this may be a viable translational target. Several agents, including HMG-CoA reductase inhibitors (statins), have been shown to augment phagocytosis, but likely not to the level required for restoration of physiologic cell processing (39, 49). More potent antibody-based approaches are being actively pursued in the oncology field, with the hopes of triggering the removal of cells that have evaded the reticuloendothelial system (50, 51). Because the 9p21 locus promotes risk independently of all classical risk factors, it is possible that a therapy that promotes efferocytosis could provide incremental benefit beyond antihypertensive, antidiabetic, and lipid-lowering therapies. Additionally, the contribution of other 9p21 locus genes to phagocytic clearance should be queried, given that compensation of apoptosis and atherosclerosis-regulating genes in this locus can occur in response to stress (19, 52). Crosstalk with other efferocytosis pathways should also be investigated, particularly to design therapies that will normalize clearance of dying cells without inducing off-target phagocytosis of healthy cells. Our data suggest that CDKN2B specifically mediates its effect through the LRP1/cholesterol efflux pathway, as loss of Cdkn2b on the ApoE*3Leiden transgenic background (a strain that increases its systemic lipid levels in response to nuclear receptor activation upstream of Abca1; ref. 53) was not associated with advanced atherosclerosis in a previous study (19). Given that first-line antiatherosclerotic therapies such as atorvastatin, simvastatin, and rosuvastatin may suppress the ABCA1 pathway (54), methods to reactivate the expression of this critical antiatherogenic gene might be particularly desirable in carriers of the 9p21 risk allele.
Methods
Murine atherosclerosis studies
Animals used in this is study included 33 male and 15 female Cdkn2b+/+,ApoE–/– control mice (The Jackson Laboratory) as well as 37 male and 14 female Cdkn2b–/–,ApoE–/– knockout mice, and 10 male and 5 female Cdkn2b+/–,ApoE–/– heterozygous mice on a C57BL/6 background, which were bred by our laboratory as previously described (55–57). At 4 weeks of age, the animals were weaned and initiated on a high-fat Western diet (21% anhydrous milk fat, 19% casein, and 0.15% cholesterol) (101511; Dyets Inc.) for the ensuing 4, 8, or 12 weeks. Animals were observed daily, and in the case of premature sudden death, necropsy was performed to determine the cause of death. Lipid analysis was performed in mice after an overnight fast, as previously described (56). In brief, total plasma cholesterol (CHOD-PAP; Roche Diagnostics), HDL (HDL-C-plus second generation; Roche Diagnostics), and LDL concentrations (GPO-PAP; Roche Diagnostics) were measured using enzymatic kits on an automated analyzer (Roche) according to the manufacturer’s instructions. Fasting glucose was measured in venous blood from a tail prick using a Freestyle glucometer and glucose strips (Abbott). At 12 or 16 weeks of age, the mice were euthanized, and the aortae were isolated and processed for analysis. A subset of 10 mice were implanted s.c. with an osmotic minipump (Model 2004; Alzet) after only 4 weeks on a high-fat diet to deliver 1.4 mg/kg/day of angiotensin II for 72 hours prior to sacrifice in order to enhance vascular injury in early atherosclerotic lesions.
Aortic and brachiocephalic tissue preparation, immunohistochemistry, and atherosclerotic lesion quantification
The aortic atherosclerotic lesion area was determined as described previously (58). Briefly, the arterial tree was perfused with PBS (pH 7.3) and then perfusion fixed with phosphate-buffered PFA (3%, pH 7.3). The heart and full length of the aorta-to-iliac bifurcation were exposed and dissected carefully from any surrounding tissues. Aortae were then opened along the ventral midline, dissected free of the animal, and pinned flat, intimal side up, onto black wax. Aortic images were captured with a digital camera mounted on a Nikon stereomicroscope and analyzed using Adobe Photoshop CS5 software. The percentage of lesion area was calculated as the total lesion area divided by the total surface area. The atherosclerotic lesions in the aortic valve area and the proximal brachiocephalic artery were analyzed as described previously (59, 60). The samples were perfused with PBS, fixed with PFA (4%), embedded in OCT, and sectioned at 7-μm thickness. Three sections at 100-μm intervals were collected from each mouse and stained with ORO (O0625; Sigma-Aldrich), Masson trichrome (Sigma-Aldrich), Picrosirius Red (24901; Polysciences), and H&E. The primary antibodies used include SMA (ab5694, 1:300; Abcam), Mac-3 (550292, 1:75; BD Biosciences), CD-3 (ab5690, 1:150; Abcam), and calreticulin (ab2907, 1:300; Abcam). Biotinylated secondary antibodies followed by avidin-biotin-alkaline phosphatase substrate were used as previously described (56). Atherosclerotic burden was quantified from the luminal aspect of the blood vessel through the plaque to the internal elastic lamina (i.e., lipid in the neointima was quantified). Subsequent immunohistochemical studies were quantified from the luminal aspect of the blood vessel through the plaque to the external elastic lamina (to assess changes that also involved the tunica media). In vivo apoptosis was assessed by staining for TUNEL positivity with the Cell Death Detection Kit (Roche) according to the manufacturer’s protocol. Cellular proliferation was measured by staining with PCNA (ab2426, 1:500; Abcam). The cellularity of the vessel was measured by manually counting nuclei of DAPI-stained sections. Negative controls were performed with the omission of the primary antibody. The lesion areas were measured and quantified using Adobe Photoshop. Features of atherosclerotic plaque vulnerability were assessed as previously described (39, 59, 61). Briefly, the size of the necrotic core was measured by calculating the percentage of the lesion that was acellular on H&E staining (62). The cap thickness was measured by placing a 12-point compass in the center of the blood vessel and averaging the thickness of the cap at each point as it crossed the lesion (63). SMC cap coverage was measured by calculating the percentage of the fibrous cap surface that stained positive for SMA (64). Other standard features were assessed as previously described (60). Samples harvested from several tissue beds were also snap-frozen in liquid nitrogen for subsequent gene expression analysis, as described below. Electron microscopy was performed in the Cell Sciences Imaging Facility by the Stanford Electron Microscopy Core using a Jeol TEM1230.
Human coronary artery atherosclerotic plaque harvest and gene coexpression network analysis
Details of sample collection, RNA isolation, and microarray hybridization have been previously described (65). In brief, epicardial coronary arteries were harvested by dissection from explanted hearts of 22 human donors for orthotopic heart transplant. Arterial segments were identified by microscope as containing atherosclerotic lesions (n = 38) or not (n = 13). RNA was isolated from each sample and hybridized to a custom dual-dye gene expression microarray (Agilent) representing 20,226 transcripts identified via sequencing clones from stimulated vascular cells, literature review for genes important to cardiovascular function, and combination with a commercial clone set (Incyte). Arrays were scanned using Agilent’s G2565AA Microarray Scanner System, and Agilent feature extraction software was used to generate log2 ratios and P values for features on the array.
Prior to gene coexpression network analysis, probe set identifiers were mapped to the current NCBI RefSeq gene build (hg19), and median values were taken for probes matching the same transcript ID. The general framework for weighted gene coexpression network analysis is described (66, 67). Pair-wise Pearson’s correlation between gene expression values was calculated for every gene in the dataset for: (a) samples with atherosclerotic lesions; (b) samples without atherosclerotic lesions; and (c) all samples. A soft-thresholding parameter β was chosen to satisfy scale-free topology criterion based on r2 maximization for a linear fit with slope –1 to log(k) versus log(n(k)), effectively “noising down” weak correlations. The topological overlap between genes was calculated according to the method described by Yip and Horvath (68), generating a network adjacency based on shared network neighbors for all gene pairs. We next used average linkage hierarchical clustering and the dynamic tree cut algorithm (69), which iteratively searches for stable clusters, to partition the topological overlap network into modules. Singular value decomposition was used to identify the module eigengene (first principle component) representing the maximum variance in modular gene expression, and the intramodular and global connectivity for each gene was generated by summing edge weights within modules and within the global network, respectively. A summary of gene coexpression module topological properties and gene assignments is provided in Supplemental Tables 1 and 2.
For targeted analysis of the topological relationship between CDKN2B and 28 annotated genes involved in efferocytosis (CALR, MFGE8, CX3CL1, ABCA6, ICAM3, GAS6, APOH, PROS1, C1QB, ANXA1, CD47, LRP1, MBL2, SIRPA, NR1H3, PPARG, LRPAP1, TGFB1, BAI1, TIMD4, CD14, MERTK, CD36, ELMO1, DOCK1, AKT1, PANX1, GULP1), average linkage hierarchical clustering was performed on the reduced topological overlap matrix representing all pair-wise links between these set members and CDKN2B. Module assignment and eigengene calculation was performed as described above. Differential expression analysis according to the presence or absence of atherosclerotic lesions was performed by a Wilcoxon rank sum test between module eigengene expression values. A P value of less than 0.05 was considered statistically significant.
Network visualization was performed using Cytoscape 2.8.3 to calculate the topological overlap matrix.
Human carotid artery atherosclerotic plaque harvest and expression eQTL analysis
Details of sample collection, DNA and RNA isolation, and microarray hybridization have been previously described (70). Briefly, 127 carotid endarterectomy samples from the Biobank of Karolinska Endarterectomies (BIKE) were subjected to global gene expression profiling on Affymetrix HG-U133 Plus 2.0 GeneChip microarrays and high-density genotyping on the Illumina 610W-Quad Bead arrays SNP chip. An additional 10 iliac artery samples from organ donors served as nonatherosclerotic control specimens. For genes with multiple probe sets, probes with the highest sensitivity and specificity according to GeneAnnot were chosen. Accordingly, the grade A (best-coverage, high-confidence probe) Affy ID 207530_s_probe was used to quantify CDKN2B expression; the Affy ID 212953_x_at probe was used to quantify CALR expression; and the representative 9p21.3 SNP rs1412829 (SNAP proxy to rs7865618) was used to identify risk allele status. Robust multiarray average (RMA) normalization was performed, and processed gene expression data were returned in log2 scale. A Student’s t test was used for statistical analyses of significance analysis of microarray (SAM) data. Pearson’s correlations were calculated to determine the association between expression of the gene of interest and other genes from microarrays. Statistical analyses were performed using GraphPad Prism 6 software (GraphPad Inc.), and a P value of less than 0.05 was considered statistically significant.
Cell culture methods
HCASMCs (passages 3–6; Lonza) were propagated in SmGM-2 growth media (Lonza) containing 5% FBS. Human THP-1 monocytic cells, human embryonic kidney cells (HEK-293), and RAW 264.7 macrophages (ATCC) were grown in DMEM growth media containing 10% FBS. Primary vascular SMCs were harvested from the aortae of Cdkn2b+/+ and Cdkn2b–/– mice, as previously described (71). Primary activated macrophages were harvested from mice 72 hours after i.p. injection of 2 ml of 4% thioglycollate, as previously described (72). To induce growth arrest and the expression of differentiation genes, SMCs were serum starved in basal media (SmBM) for 72 hours, according to conventional protocols (73, 74). To induce differentiation of THP-1 monocytes into adherent macrophages, cells were treated with 100 nM PMA for 72 hours, as previously described (75).
For knockdown experiments, SMCs were transfected with 300 nM of anti-CDKN2B (siCDKN2B) or high-GC negative control (siCont) siRNA (Ambion, Silencer Select, catalogs 4390825 and 4390843, respectively; Life Technologies) using the high-efficiency Amaxa Nucleofector system (protocol U-025; Lonza). Successful transfection (>85% of all cells) was confirmed by visual fluorescence microscopy analysis and FACS flow cytometry for the fluorescently labeled positive control pmax GFP (Amaxa). Plates were harvested at 80% confluence for RNA and protein analysis or used for subsequent in vitro analysis. Reproducible knockdown of CDKN2B was confirmed in SMCs by quantitative RT-PCR, which displayed selective silencing of this gene on the order of approximately 85%. No off-target knockdown was observed for any of the other nearby genes, including CDKN2A, ARF, or ANRIL. Apoptosis was induced by treating HCASMCs with 1 μM staurosporine (S5921; Sigma-Aldrich) in serum-free media for 6 hours prior to analysis or harvest and use in coculture experiments.
mRNA isolation and quantitative RT-PCR
RNA was isolated from cell lysates using the miRNeasy Mini Kit (QIAGEN) according to the manufacturer’s protocol. RNA was isolated from the murine organ samples using the TRIzol method (Invitrogen). RNA was quantified with the NanoDrop machine (Agilent Technologies). For quantitation of gene transcription, cDNA was generated with M-MuLV RT, then amplified on the ABI PRISM 7900HT with commercially available TaqMan primers (Applied Biosystems) and normalized to 18S internal controls, as previously described (74). A list of the primers and probes used in these studies is provided in Supplemental Table 3.
In vitro assays and promoter analysis
In silico bioinformatics.
TF binding site (TFBS) prediction was determined using the following on-line bioinformatics tools: TRANSFAC (BIOBASE), TFSearch, PROMO, and MatInspector.
Radioactive EMSAs.
Double-stranded oligonucleotides for the top predicted E2F4 binding sites (–150 to –134) within the CALR promoter were generated by annealing the following single-stranded oligos: forward, 5′-TGGCAGGGGCGGGCCCAAGGGCTG-3′ and reverse, 5′-CAGCCCTTGGGCCCGCCCCTGCCA-3′.
Annealed oligos were then labeled with g-32P-ATP (PerkinElmer) using T4 polynucleotide kinase (NEB) for 30 minutes at room temperature and then purified through Sephadex G-50 Quick Spin columns (Roche). After measuring radioactivity, reactions were assembled with ×1 EMSA binding buffer, 1 μg poly-dIdC, 10 μg nuclear extract harvested from HCASMCs, ×100 unlabeled probe (for competitions), g-32P-ATP labeled probe, and incubated at room temperature for 30 minutes prior to protein separation on a 4% TBE gel. Gels were dried on Whatman paper using a heated vacuum drier, and proteins were detected on radiographic film.
ChIP assays.
ChIP was performed according to the Millipore EZ-ChIP protocol with slight modifications. HCASMCs were cultured in normal growth media until approximately 75% confluent and then cultured for 24 hours in the absence of serum and supplements. Cells were fixed in 1% formaldehyde for 10 minutes to cross-link chromatin, followed by quenching with glycine for 5 minutes at room temperature. Cells (2 × 10⁷ per condition) were collected, and nuclear lysates were prepared as described previously (76). Cross-linked chromatin nuclear extracts were sheared into approximately 500-bp fragments using a Bioruptor (Diagenode) for three cycles of 3 minutes’ duration (30 s ON, 30 s OFF). Sheared chromatin was clarified via centrifugation at 4°C for 15 minutes. Nuclei (1 × 10⁶ per condition) were precleared with 20 μg anti-rabbit IgG preimmune serum (Sigma-Aldrich) and 40 μl Protein G Dynabeads (Invitrogen) for 1 hour on a rotating platform, followed by incubation overnight with 2 μg rabbit IgG or anti-E2F4 antibody (C-20 SC866; Santa Cruz Biotechnology Inc.). ChIP samples were then incubated with 60 μl Protein G Dynabeads for 2 hours at 4°C on a rotating platform to capture the protein-DNA complexes. Complexes were washed in low salt, high salt, LiCl, and TE buffers and then eluted with a buffer containing 100 nM NaHCO3 and 1% SDS. Protein-DNA crosslinks were reversed, samples were treated with RNase A and proteinase K, and free DNA was purified using QIAGEN PCR purification kits. Total enrichment was measured using primers designed based on the sequence of the top E2F4 binding site within the calreticulin promoter: forward (–199 to –181), 5′-AGGTCCAATGGAAAAAGAC-3′ and reverse (+84 to +65), 5′-CAGAAACTGCTCCTTGAAGT-3′, or a known E2F4 regulatory region, with FGFR1 as a positive control (77), or a negative control region using the following primers: forward, 5′-CCGGAAGCACTTCTCCTAGA-3′ and reverse, 5′-AAGAGAGAGCGGAAGTGACG-3′. Semiquantitative PCR was used to verify ChIP products via gel electrophoresis. Quantitative real-time PCR (ViiA 7; Life Technologies) was performed using SYBR Green (Applied Biosystems) assays, and fold-change enrichment was calculated by measuring the delta Ct – delta Ct IgG. Melting curve analysis was also performed for each ChIP primer. Data are representative of at least four independent HCASMC samples with quantitative PCR assays performed in triplicate. Data are presented as the percentage of input DNA and as fold-change enrichment of chromatin precipitated with the E2F4 Ab relative to the control IgG.
Luciferase promoter reporter assays.
Calreticulin LightSwitch Promoter Reporter GoClones (RenSP, S721464), empty vectors (S790005), and Cypridina TK control constructs (pTK-Cluc, SN0322S) were obtained from SwitchGear Genomics and transfected into HEK cells using Lipofectamine 2000 (Invitrogen). For knockdown assays, 5 pmol of anti-CDKN2B or control siRNA was cotransfected. For overexpression, CDKN2B (sc319536), RB expression plasmid (sc119971), and empty vector (pCMV6) were obtained from Origene, and 100 ng of plasmid was cotransfected. Dual luciferase activity was measured with the LightSwitch Dual Assay System after 48 hours using a SpectraMax L luminometer (Molecular Devices), according to the manufacturer’s instructions. In some experiments, media were changed to serum-free media after 24 hours of transfection. Studies were performed at baseline and after the cells had been exposed to escalating doses of recombinant human TGF-β1 (0.5–10 ng/ml; Sigma-Aldrich) for the final 16 hours prior to analysis. Relative luciferase activity (Renilla/Cypridina luciferase ratio) is expressed as the percentage of change relative to the basal values obtained from control-transfected cells not exposed to TGF-β1 treatment.
Efferocytosis assays
Efferocytosis resistance and capacity assays.
Primary aortic SMCs generated from Cdkn2b–/– and Cdkn2b+/+ mice were labeled with 20 μM orange CMTMR CellTracker fluorescent probes (C2927; Life Technologies) for 1 hour, then cultured overnight in serum-free media. Simultaneously, primary i.p. Cdkn2b+/+ macrophages were labeled with 20 μM green CMFDA CellTracker probe (C7025; Life Technologies) for 1 hour, then cultured overnight in standard media with serum supplementation. In the morning, the SMCs were induced to undergo apoptosis for 4 hours, then were harvested and manually counted. Apoptotic cells (1 × 10⁵) were then added to the cultured macrophages and allowed to coculture for an additional 1.5 hours. At that point, all adherent cells were trypsinized and FACS sorted using a BD FACSCaliber (530 nm [FL1] and >575 nm [FL4]), as described in previously published protocols (25). Cells that were dual-positive for green (phagocyte) and orange (SMC) were assumed to represent phagocytosed cells. The efferocytosis rate was then defined as the ratio of dual-positive cells (phagocytosed ABs) to orange-positive/green-negative cells (uneaten ABs). A comparison was made between the rates of clearance for Cdkn2b–/– and Cdkn2b+/+ ABs. This experiment was performed as above with the following permutations: primary murine aortic SMCs versus primary murine i.p. thioglycollate–stimulated macrophages; primary murine aortic SMCs versus murine unstimulated RAW macrophages; transfected HCASMCs versus human PMA–stimulated THP-1 cells. To normalize the differences in calreticulin across experimental conditions, apoptotic SMCs were preincubated with 10 μg/ml of exogenous CALR peptide (Enzo Life Sciences) for 10 minutes prior to coculture with macrophages. Finally, the effect of CDKN2B on the efferocytic capacity (versus efferocytic resistance) was assessed by performing these experiments with CDKN2B-deficient and control-transfected phagocytes exposed to untransfected ABs. In these experiments, the phagocytic capacity was defined as the ratio of dual-positive cells (phagocytes that had eaten an AB) to orange-negative/green-positive cells (phagocytes that had not eaten an AB). All assays were repeated three times with at least three replicates per experiment. Analysis was performed using FlowJo 7.6.3 software (Tree Star Inc.).
Efferocytosis competition assays.
The preceding studies were confirmed by plating equal numbers of green CellTracker–labeled apoptotic siCDKN2B HCASMCs and orange CellTracker–labeled apoptotic siCont HCASMCs onto unlabeled, untransfected, nonapoptotic HCASMCs in 12-well cell culture plates. All three cell types were cocultured for an additional 2 hours, and then the nonadherent, nonphagocytosed cells were washed off. The remaining cells were fixed and stained with DAPI and analyzed under an inverted fluorescence microscope. Eight random HPFs per well were manually counted by a blinded investigator for efferocytosed cells, and the ratio of phagocytosed CDKN2B-deficient ABs to control-transfected ABs was recorded.
Phagocyte-AB coculture assays
Cholesterol efflux culture assays.
Cholesterol efflux assays were performed as described previously (78, 79), with modification. RAW macrophages were plated on 12-well plates in DMEM containing 10% FBS and labeled with [3H]cholesterol (0.5 μCi/well) for 48 hours. After washing with PBS, the cells were cocultured with apoptotic Cdkn2b–/– and Cdkn2b+/+ aortic SMCs for 1.5 hours, then incubated overnight in serum-free DMEM. The cells were washed and incubated for 4 hours in 350 μl of serum-free media containing 10 μg/ml apolipoprotein A-1 (ApoA-1; Sigma-Aldrich) as an acceptor. The media were collected and centrifuged, and the amount of radioactivity was determined by a scintillation counter. Cholesterol efflux was expressed as the percentage of counts in the media versus total [3H]cholesterol counts (media plus cell). Baseline efflux (without ApoA-1) was subtracted.
Foam cell formation assays.
RAW macrophages were seeded on 96-well plates and cultured overnight. In some experiments, macrophages were treated with 100 ng/ml of LPS from E. coli O111:B4 (Sigma-Aldrich). Macrophages were cocultured for 24 hours with apoptotic Cdkn2b–/– and Cdkn2b+/+ aortic SMCs and 100 μg/ml oxidized LDL (Biomedical Technologies, Inc.). The cells were fixed in 4% PFA for 20 minutes, washed with PBS, and stained with 0.5% ORO for 5 minutes. After rinsing in 60% isopropanol and washing, 8 random images per well were taken with an inverted microscope at ×20 magnification. The ORO-positive area was analyzed with Adobe Photoshop CS5 software.
Macrophage-specific cytokine expression assays.
LPS-stimulated (1 μg/ml) RAW macrophages were cocultured with either siCDKN2B or siCont apoptotic HCASMCs in serum-free media. Unattached HCASMCs were removed by washing with PBS after 1.5 hours, then the cells were cultured in serum-free DMEM. After a 24-hour incubation, the supernatant was collected, and the level of secreted IL-10 and TNF-α was assessed with ELISAs (R&D Systems) developed specifically for cytokines of murine origin.
Statistics
Data are presented as the mean ± SEM. Data were subjected to the Kolmogorov-Smirnov test to determine distribution. Groups were compared using the Mann-Whitney U test for nonparametric data or the 2-tailed Student’s t test for parametric data. When comparing multiple groups, data were analyzed by ANOVA with a Bonferroni’s post test. For multiple testing of parametric data, a value of P < 0.05 was considered statistically significant. Experiments were replicated at least in quadruplicate, and all analyses were performed in a blinded fashion by two separate investigators, unless otherwise specified. Statistical analysis was performed with GraphPad Prism v.5 software (GraphPad Software).
Study approval
All animal studies were approved by the Stanford University Administrative Panel on Laboratory Animal Care (protocols 10020 and 10022) and conform to NIH guidelines (Guide for the Care and Use of Laboratory Animals. NIH publication no. 85-23, revised 1996). All human studies were performed with written informed consent and with the approval of the ethics committee of Northern Stockholm.
Supplementary Material
Acknowledgments
The authors would like to acknowledge Josh Knowles for critical appraisal of the manuscript, James Priest for assistance with bioinformatics analyses, Sylvia Nuernberg for technical assistance with the ChIP assays, and John Perrino for technical assistance with the electron microscopy experiments. This project was supported by NIH grant K08 HL103605-01 (to N.J. Leeper) and , AHA grant 10BGIA3290011 (to N.J. Leeper), unrestricted grants from Gilead Pharmaceuticals (to N.J. Leeper), NIH grants R01HL103635 and R01HL109512 (to T. Quertermous), and by a grant from the LeDucq Foundation (to T. Quertermous).
Footnotes
Conflict of interest: The authors have declared that no conflict of interest exists.
Citation for this article: J Clin Invest. 2014;124(3):1083–1097. doi:10.1172/JCI70391.
References
- 1.Lloyd-Jones DM, et al. Parental cardiovascular disease as a risk factor for cardiovascular disease in middle-aged adults: a prospective study of parents and offspring. JAMA. 2004;291(18):2204–2211. doi: 10.1001/jama.291.18.2204. [DOI] [PubMed] [Google Scholar]
- 2.Marenberg ME, Risch N, Berkman LF, Floderus B, de Faire U. Genetic susceptibility to death from coronary heart disease in a study of twins. N Engl J Med. 1994;330(15):1041–1046. doi: 10.1056/NEJM199404143301503. [DOI] [PubMed] [Google Scholar]
- 3.Helgadottir A, et al. A common variant on chromosome 9p21 affects the risk of myocardial infarction. Science. 2007;316(5830):1491–1493. doi: 10.1126/science.1142842. [DOI] [PubMed] [Google Scholar]
- 4.McPherson R, et al. A common allele on chromosome 9 associated with coronary heart disease. Science. 2007;316(5830):1488–1491. doi: 10.1126/science.1142447. [DOI] [PMC free article] [PubMed] [Google Scholar]
- 5.Deloukas P, et al. Large-scale association analysis identifies new risk loci for coronary artery disease. Nat Genet. 2013;45(1):25–33. doi: 10.1038/ng.2480. [DOI] [PMC free article] [PubMed] [Google Scholar]
- 6.Cunnington MS, Keavney B. Genetic mechanisms mediating atherosclerosis susceptibility at the chromosome 9p21 locus. Curr Atheroscler Rep. 2011;13(3):193–201. doi: 10.1007/s11883-011-0178-z. [DOI] [PubMed] [Google Scholar]
- 7.Helgadottir A, et al. The same sequence variant on 9p21 associates with myocardial infarction, abdominal aortic aneurysm and intracranial aneurysm. Nat Genet. 2008;40(2):217–224. doi: 10.1038/ng.72. [DOI] [PubMed] [Google Scholar]
- 8.Liu Y, et al. INK4/ARF transcript expression is associated with chromosome 9p21 variants linked to atherosclerosis. PLoS One. 2009;4(4):e5027. doi: 10.1371/journal.pone.0005027. [DOI] [PMC free article] [PubMed] [Google Scholar]
- 9.Jarinova O, et al. Functional analysis of the chromosome 9p21.3 coronary artery disease risk locus. Arterioscler Thromb Vasc Biol. 2009;29(10):1671–1677. doi: 10.1161/ATVBAHA.109.189522. [DOI] [PubMed] [Google Scholar]
- 10.Holdt LM, et al. ANRIL expression is associated with atherosclerosis risk at chromosome 9p21. Arterioscler Thromb Vasc Biol. 2010;30(3):620–627. doi: 10.1161/ATVBAHA.109.196832. [DOI] [PubMed] [Google Scholar]
- 11.Cunnington MS, Santibanez Koref M, Mayosi BM, Burn J, Keavney B. Chromosome 9p21 SNPs associated with multiple disease phenotypes correlate with ANRIL expression. PLoS Genet. 2010;6(4):e1000899. doi: 10.1371/journal.pgen.1000899. [DOI] [PMC free article] [PubMed] [Google Scholar]
- 12.Holdt LM, Sass K, Gabel G, Bergert H, Thiery J, Teupser D. Expression of Chr9p21 genes CDKN2B (p15(INK4b)), CDKN2A (p16(INK4a), p14(ARF)), and MTAP in human atherosclerotic plaque. Atherosclerosis. 2011;214(2):264–270. doi: 10.1016/j.atherosclerosis.2010.06.029. [DOI] [PubMed] [Google Scholar]
- 13.Schunkert H, et al. Large-scale association analysis identifies 13 new susceptibility loci for coronary artery disease. Nat Genet. 2011;43(4):333–338. doi: 10.1038/ng.784. [DOI] [PMC free article] [PubMed] [Google Scholar]
- 14.Pilbrow AP, et al. The chromosome 9p21.3 coronary heart disease risk allele is associated with altered gene expression in normal heart and vascular tissues. PLoS One. 2012;7(6):e39574. doi: 10.1371/journal.pone.0039574. [DOI] [PMC free article] [PubMed] [Google Scholar]
- 15.Motterle A, et al. Functional analyses of coronary artery disease associated variation on chromosome 9p21 in vascular smooth muscle cells. Hum Mol Genet. 2012;21(18):4021–4029. doi: 10.1093/hmg/dds224. [DOI] [PMC free article] [PubMed] [Google Scholar]
- 16.Leeper NJ, et al. Loss of CDKN2B promotes p53-dependent smooth muscle cell apoptosis and aneurysm formation. Arterioscler Thromb Vasc Biol. 2013;33(1):e1–e10. doi: 10.1161/ATVBAHA.112.300399. [DOI] [PMC free article] [PubMed] [Google Scholar]
- 17.Holdt LM, Teupser D. Recent studies of the human chromosome 9p21 locus, which is associated with atherosclerosis in human populations. Arterioscler Thromb Vasc Biol. 2012;32(2):196–206. doi: 10.1161/ATVBAHA.111.232678. [DOI] [PubMed] [Google Scholar]
- 18.Anderson JL, Horne BD. The 9p21 locus and coronary heart disease: initiator, promoter, or precipitator? J Am Coll Cardiol. 2010;56(6):487–489. doi: 10.1016/j.jacc.2010.02.056. [DOI] [PubMed] [Google Scholar]
- 19.Kim JB, et al. Effect of 9p21.3 coronary artery disease locus neighboring genes on atherosclerosis in mice. Circulation. 2012;126(15):1896–1906. doi: 10.1161/CIRCULATIONAHA.111.064881. [DOI] [PMC free article] [PubMed] [Google Scholar]
- 20.Visel A, et al. Targeted deletion of the 9p21 non-coding coronary artery disease risk interval in mice. Nature. 2010;464(7287):409–412. doi: 10.1038/nature08801. [DOI] [PMC free article] [PubMed] [Google Scholar]
- 21.Gonzalez-Navarro H, et al. p19(ARF) deficiency reduces macrophage and vascular smooth muscle cell apoptosis and aggravates atherosclerosis. J Am Coll Cardiol. 2010;55(20):2258–2268. doi: 10.1016/j.jacc.2010.01.026. [DOI] [PubMed] [Google Scholar]
- 22.Kuo CL, et al. Cdkn2a is an atherosclerosis modifier locus that regulates monocyte/macrophage proliferation. Arterioscler Thromb Vasc Biol. 2011;31(11):2483–2492. doi: 10.1161/ATVBAHA.111.234492. [DOI] [PMC free article] [PubMed] [Google Scholar]
- 23.Thorp E, Tabas I. Mechanisms and consequences of efferocytosis in advanced atherosclerosis. J Leukoc Biol. 2009;86(5):1089–1095. doi: 10.1189/jlb.0209115. [DOI] [PMC free article] [PubMed] [Google Scholar]
- 24.Kiss RS, Elliott MR, Ma Z, Marcel YL, Ravichandran KS. Apoptotic cells induce a phosphatidylserine-dependent homeostatic response from phagocytes. Curr Biol. 2006;16(22):2252–2258. doi: 10.1016/j.cub.2006.09.043. [DOI] [PubMed] [Google Scholar]
- 25.Clarke MC, Talib S, Figg NL, Bennett MR. Vascular smooth muscle cell apoptosis induces interleukin-1-directed inflammation: effects of hyperlipidemia-mediated inhibition of phagocytosis. Circ Res. 2010;106(2):363–372. doi: 10.1161/CIRCRESAHA.109.208389. [DOI] [PubMed] [Google Scholar]
- 26.Gerbod-Giannone MC, et al. TNFalpha induces ABCA1 through NF-κB in macrophages and in phagocytes ingesting apoptotic cells. Proc Natl Acad Sci U S A. 2006;103(9):3112–3117. doi: 10.1073/pnas.0510345103. [DOI] [PMC free article] [PubMed] [Google Scholar]
- 27.Han CZ, Ravichandran KS. Metabolic connections during apoptotic cell engulfment. Cell. 2011;147(7):1442–1445. doi: 10.1016/j.cell.2011.12.006. [DOI] [PMC free article] [PubMed] [Google Scholar]
- 28.Gardai SJ, et al. Cell-surface calreticulin initiates clearance of viable or apoptotic cells through trans-activation of LRP on the phagocyte. Cell. 2005;123(2):321–334. doi: 10.1016/j.cell.2005.08.032. [DOI] [PubMed] [Google Scholar]
- 29.Kinchen JM, Ravichandran KS. Phagocytic signaling: you can touch, but you can’t eat. Curr Biol. 2008;18(12):R521–R524. doi: 10.1016/j.cub.2008.04.058. [DOI] [PMC free article] [PubMed] [Google Scholar]
- 30.Schrijvers DM, De Meyer GR, Herman AG, Martinet W. Phagocytosis in atherosclerosis: Molecular mechanisms and implications for plaque progression and stability. Cardiovasc Res. 2007;73(3):470–480. doi: 10.1016/j.cardiores.2006.09.005. [DOI] [PubMed] [Google Scholar]
- 31.Ravichandran KS. Find-me and eat-me signals in apoptotic cell clearance: progress and conundrums. J Exp Med. 2010;207(9):1807–1817. doi: 10.1084/jem.20101157. [DOI] [PMC free article] [PubMed] [Google Scholar]
- 32.Schrijvers DM, De Meyer GR, Kockx MM, Herman AG, Martinet W. Phagocytosis of apoptotic cells by macrophages is impaired in atherosclerosis. Arterioscler Thromb Vasc Biol. 2005;25(6):1256–1261. doi: 10.1161/01.ATV.0000166517.18801.a7. [DOI] [PubMed] [Google Scholar]
- 33.Khan M, Pelengaris S, Cooper M, Smith C, Evan G, Betteridge J. Oxidised lipoproteins may promote inflammation through the selective delay of engulfment but not binding of apoptotic cells by macrophages. Atherosclerosis. 2003;171(1):21–29. doi: 10.1016/j.atherosclerosis.2003.07.001. [DOI] [PubMed] [Google Scholar]
- 34.Moore KJ, Tabas I. Macrophages in the pathogenesis of atherosclerosis. Cell. 2011;145(3):341–355. doi: 10.1016/j.cell.2011.04.005. [DOI] [PMC free article] [PubMed] [Google Scholar]
- 35.Boisvert WA, et al. Leukocyte transglutaminase 2 expression limits atherosclerotic lesion size. Arterioscler Thromb Vasc Biol. 2006;26(3):563–569. doi: 10.1161/01.ATV.0000203503.82693.c1. [DOI] [PubMed] [Google Scholar]
- 36.Ait-Oufella H, et al. Lactadherin deficiency leads to apoptotic cell accumulation and accelerated atherosclerosis in mice. Circulation. 2007;115(16):2168–2177. doi: 10.1161/CIRCULATIONAHA.106.662080. [DOI] [PubMed] [Google Scholar]
- 37.Ait-Oufella H, et al. Defective mer receptor tyrosine kinase signaling in bone marrow cells promotes apoptotic cell accumulation and accelerates atherosclerosis. Arterioscler Thromb Vasc Biol. 2008;28(8):1429–1431. doi: 10.1161/ATVBAHA.108.169078. [DOI] [PubMed] [Google Scholar]
- 38.Tabas I. Macrophage death and defective inflammation resolution in atherosclerosis. Nat Rev Immunol. 2010;10(1):36–46. doi: 10.1038/nri2675. [DOI] [PMC free article] [PubMed] [Google Scholar]
- 39.Martinet W, Schrijvers DM, De Meyer GR. Necrotic cell death in atherosclerosis. Basic Res Cardiol. 2011;106(5):749–760. doi: 10.1007/s00395-011-0192-x. [DOI] [PubMed] [Google Scholar]
- 40.Virmani R, Burke AP, Kolodgie FD, Farb A. Pathology of the thin-cap fibroatheroma: a type of vulnerable plaque. J Interv Cardiol. 2003;16(3):267–272. doi: 10.1034/j.1600-0854.2003.8042.x. [DOI] [PubMed] [Google Scholar]
- 41.Fitzgerald ML, Mujawar Z, Tamehiro N. ABC transporters, atherosclerosis and inflammation. Atherosclerosis. 2010;211(2):361–370. doi: 10.1016/j.atherosclerosis.2010.01.011. [DOI] [PMC free article] [PubMed] [Google Scholar]
- 42.Yvan-Charvet L, et al. ABCA1 and ABCG1 protect against oxidative stress-induced macrophage apoptosis during efferocytosis. Circ Res. 2010;106(12):1861–1869. doi: 10.1161/CIRCRESAHA.110.217281. [DOI] [PMC free article] [PubMed] [Google Scholar]
- 43.Boucher P, Herz J. Signaling through LRP1: Protection from atherosclerosis and beyond. Biochem Pharmacol. 2011;81(1):1–5. doi: 10.1016/j.bcp.2010.09.018. [DOI] [PMC free article] [PubMed] [Google Scholar]
- 44.Wang WA, Groenendyk J, Michalak M. Calreticulin signaling in health and disease. Int J Biochem Cell Biol. 2012;44(6):842–846. doi: 10.1016/j.biocel.2012.02.009. [DOI] [PubMed] [Google Scholar]
- 45.Tall AR, Yvan-Charvet L, Terasaka N, Pagler T, Wang N. HDL, ABC transporters, and cholesterol efflux: implications for the treatment of atherosclerosis. Cell Metab. 2008;7(5):365–375. doi: 10.1016/j.cmet.2008.03.001. [DOI] [PubMed] [Google Scholar]
- 46.Gold LI, et al. Calreticulin: non-endoplasmic reticulum functions in physiology and disease. FASEB J. 2010;24(3):665–683. doi: 10.1096/fj.09-145482. [DOI] [PMC free article] [PubMed] [Google Scholar]
- 47.Chao MP, et al. Calreticulin is the dominant pro-phagocytic signal on multiple human cancers and is counterbalanced by CD47. Sci Transl Med. 2010;2(63):63ra94. doi: 10.1126/scitranslmed.3001375. [DOI] [PMC free article] [PubMed] [Google Scholar]
- 48.Chaput N, et al. Molecular determinants of immunogenic cell death: surface exposure of calreticulin makes the difference. J Mol Med (Berl). 2007;85(10):1069–1076. doi: 10.1007/s00109-007-0214-1. [DOI] [PubMed] [Google Scholar]
- 49.Morimoto K, et al. Lovastatin enhances clearance of apoptotic cells (efferocytosis) with implications for chronic obstructive pulmonary disease. J Immunol. 2006;176(12):7657–7665. doi: 10.4049/jimmunol.176.12.7657. [DOI] [PubMed] [Google Scholar]
- 50.Chao MP, et al. Therapeutic antibody targeting of CD47 eliminates human acute lymphoblastic leukemia. Cancer Res. 2011;71(4):1374–1384. doi: 10.1158/0008-5472.CAN-10-2238. [DOI] [PMC free article] [PubMed] [Google Scholar]
- 51.Weiskopf K, et al. Engineered SIRPα variants as immunotherapeutic adjuvants to anticancer antibodies. Science. 2013;341(6141):88–91. doi: 10.1126/science.1238856. [DOI] [PMC free article] [PubMed] [Google Scholar]
- 52.Krimpenfort P, et al. p15Ink4b is a critical tumour suppressor in the absence of p16Ink4a. Nature. 2007;448(7156):943–946. doi: 10.1038/nature06084. [DOI] [PubMed] [Google Scholar]
- 53.Zadelaar S, et al. Mouse models for atherosclerosis and pharmaceutical modifiers. Arterioscler Thromb Vasc Biol. 2007;27(8):1706–1721. doi: 10.1161/ATVBAHA.107.142570. [DOI] [PubMed] [Google Scholar]
- 54.Wong J, Quinn CM, Gelissen IC, Jessup W, Brown AJ. The effect of statins on ABCA1 and ABCG1 expression in human macrophages is influenced by cellular cholesterol levels and extent of differentiation. Atherosclerosis. 2008;196(1):180–189. doi: 10.1016/j.atherosclerosis.2007.03.030. [DOI] [PubMed] [Google Scholar]
- 55.Ishida T, et al. Endothelial lipase modulates susceptibility to atherosclerosis in apolipoprotein-E-deficient mice. J Biol Chem. 2004;279(43):45085–45092. doi: 10.1074/jbc.M406360200. [DOI] [PubMed] [Google Scholar]
- 56.Chun HJ, et al. Apelin signaling antagonizes Ang II effects in mouse models of atherosclerosis. J Clin Invest. 2008;118(10):3343–3354. doi: 10.1172/JCI34871. [DOI] [PMC free article] [PubMed] [Google Scholar]
- 57.Wolff L, et al. Hypermethylation of the Ink4b locus in murine myeloid leukemia and increased susceptibility to leukemia in p15(Ink4b)-deficient mice. Oncogene. 2003;22(58):9265–9274. doi: 10.1038/sj.onc.1207092. [DOI] [PubMed] [Google Scholar]
- 58.Ishida T, et al. Endothelial lipase is a major determinant of HDL level. J Clin Invest. 2003;111(3):347–355. doi: 10.1172/JCI16306. [DOI] [PMC free article] [PubMed] [Google Scholar]
- 59.Paigen B, Morrow A, Holmes PA, Mitchell D, Williams RA. Quantitative assessment of atherosclerotic lesions in mice. Atherosclerosis. 1987;68(3):231–240. doi: 10.1016/0021-9150(87)90202-4. [DOI] [PubMed] [Google Scholar]
- 60.Alexander MR, et al. Genetic inactivation of IL-1 signaling enhances atherosclerotic plaque instability and reduces outward vessel remodeling in advanced atherosclerosis in mice. J Clin Invest. 2012;122(1):70–79. doi: 10.1172/JCI43713. [DOI] [PMC free article] [PubMed] [Google Scholar]
- 61.Crisby M, et al. Cell death in human atherosclerotic plaques involves both oncosis and apoptosis. Atherosclerosis. 1997;130(1–2):17–27. doi: 10.1016/S0021-9150(96)06037-6. [DOI] [PubMed] [Google Scholar]
- 62.Jun J, et al. Effect of intermittent hypoxia on atherosclerosis in apolipoprotein E-deficient mice. Atherosclerosis. 2010;209(2):381–386. doi: 10.1016/j.atherosclerosis.2009.10.017. [DOI] [PMC free article] [PubMed] [Google Scholar]
- 63.de Nooijer R, et al. Lesional overexpression of matrix metalloproteinase-9 promotes intraplaque hemorrhage in advanced lesions but not at earlier stages of atherogenesis. Arterioscler Thromb Vasc Biol. 2006;26(2):340–346. doi: 10.1161/01.ATV.0000197795.56960.64. [DOI] [PubMed] [Google Scholar]
- 64.Lyon CA, Johnson JL, Williams H, Sala-Newby GB, George SJ. Soluble N-cadherin overexpression reduces features of atherosclerotic plaque instability. Arterioscler Thromb Vasc Biol. 2009;29(2):195–201. doi: 10.1161/ATVBAHA.108.178087. [DOI] [PMC free article] [PubMed] [Google Scholar]
- 65.King JY, et al. Pathway analysis of coronary atherosclerosis. Physiol Genomics. 2005;23(1):103–118. doi: 10.1152/physiolgenomics.00101.2005. [DOI] [PubMed] [Google Scholar]
- 66.Oldham MC, Horvath S, Geschwind DH. Conservation and evolution of gene coexpression networks in human and chimpanzee brains. Proc Natl Acad Sci U S A. 2006;103(47):17973–17978. doi: 10.1073/pnas.0605938103. [DOI] [PMC free article] [PubMed] [Google Scholar]
- 67.Dong J, Horvath S. Understanding network concepts in modules. BMC Syst Biol. 2007;1:24. doi: 10.1186/1752-0509-1-24. [DOI] [PMC free article] [PubMed] [Google Scholar]
- 68.Yip AM, Horvath S. Gene network interconnectedness and the generalized topological overlap measure. BMC Bioinformatics. 2007;8:22. doi: 10.1186/1471-2105-8-22. [DOI] [PMC free article] [PubMed] [Google Scholar]
- 69.Langfelder P, Zhang B, Horvath S. Defining clusters from a hierarchical cluster tree: the Dynamic Tree Cut package for R. Bioinformatics. 2008;24(5):719–720. doi: 10.1093/bioinformatics/btm563. [DOI] [PubMed] [Google Scholar]
- 70.Perisic L, et al. Profiling of atherosclerotic lesions by gene and tissue microarrays reveals PCSK6 as a novel protease in unstable carotid atherosclerosis. Arterioscler Thromb Vasc Biol. 2013;33(10):2432–2443. doi: 10.1161/ATVBAHA.113.301743. [DOI] [PubMed] [Google Scholar]
- 71.Rong JX, Shapiro M, Trogan E, Fisher EA. Transdifferentiation of mouse aortic smooth muscle cells to a macrophage-like state after cholesterol loading. Proc Natl Acad Sci U S A. 2003;100(23):13531–13536. doi: 10.1073/pnas.1735526100. [DOI] [PMC free article] [PubMed] [Google Scholar]
- 72.Bianco C, Griffin FM, Griffin FM, Jr, Silverstein SC. Studies of the macrophage complement receptor. Alteration of receptor function upon macrophage activation. J Exp Med. 1975;141(6):1278–1290. doi: 10.1084/jem.141.6.1278. [DOI] [PMC free article] [PubMed] [Google Scholar]
- 73.Owens GK, Loeb A, Gordon D, Thompson MM. Expression of smooth muscle-specific α-isoactin in cultured vascular smooth muscle cells: relationship between growth and cytodifferentiation. J Cell Biol. 1986;102(2):343–352. doi: 10.1083/jcb.102.2.343. [DOI] [PMC free article] [PubMed] [Google Scholar]
- 74.Leeper NJ, et al. MicroRNA-26a is a novel regulator of vascular smooth muscle cell function. J Cell Physiol. 2011;226(4):1035–1043. doi: 10.1002/jcp.22422. [DOI] [PMC free article] [PubMed] [Google Scholar]
- 75.Schwende H, Fitzke E, Ambs P, Dieter P. Differences in the state of differentiation of THP-1 cells induced by phorbol ester and 1,25-dihydroxyvitamin D3. J Leukoc Biol. 1996;59(4):555–561. [PubMed] [Google Scholar]
- 76.Nurnberg ST, et al. A GWAS sequence variant for platelet volume marks an alternative DNM3 promoter in megakaryocytes near a MEIS1 binding site. Blood. 2012;120(24):4859–4868. doi: 10.1182/blood-2012-01-401893. [DOI] [PMC free article] [PubMed] [Google Scholar]
- 77.Parakati R, DiMario JX. Dynamic transcriptional regulatory complexes, including E2F4, p107, p130, and Sp1, control fibroblast growth factor receptor 1 gene expression during myogenesis. J Biol Chem. 2005;280(22):21284–21294. doi: 10.1074/jbc.M410744200. [DOI] [PubMed] [Google Scholar]
- 78.Low H, Hoang A, Sviridov D. Cholesterol efflux assay. J Vis Exp. 2012;(61):e3810. doi: 10.3791/3810. [DOI] [PMC free article] [PubMed] [Google Scholar]
- 79.Wang XQ, Panousis CG, Alfaro ML, Evans GF, Zuckerman SH. Interferon-γ-mediated downregulation of cholesterol efflux and ABC1 expression is by the Stat1 pathway. Arterioscler Thromb Vasc Biol. 2002;22(5):e5–e9. doi: 10.1161/01.ATV.0000018287.03856.DD. [DOI] [PubMed] [Google Scholar]
Associated Data
This section collects any data citations, data availability statements, or supplementary materials included in this article.