Abstract
In recent years, the RNA-binding protein quaking 5 (QKI-5) has been recognized as a novel tumor suppressor in many cancers. To date, no studies have examined the role of QKI-5 in prostate cancer. The present study was designed to elucidate the correlation of QKI-5 expression with the clinical pathological features and prognosis of prostate cancer. In an overwhelming majority of the 184 cases of prostate cancer samples analyzed, the QKI-5 expression was significantly decreased, which was largely due to the high promoter methylation levels. Using lentiviral vectors, we established two stable prostate cancer cell lines with altered QKI-5 expression, including a QKI-5 overexpressing PC3 cell line and a DU145 cell line with knocked-down QKI-5 expression. The effects of the lentiviral-mediated QKI-5 knockdown on the PC3 cells and DU145 cells were assessed by cell growth curves, flow cytometry (FCM), and an invasion assay. The PC3 cells were transplanted into nude mice, and then, the tumor growth curves and TUNEL staining were determined. These results demonstrated that QKI-5 was highly expressed in benign prostatic hyperplasia (BPH) tissues but not in carcinomatous tissues and that QKI-5 effectively inhibited prostate cancer cell proliferation in vitro and in vivo. In addition, the decrease in QKI-5 expression was closely correlated with the prostate cancer Gleason score, poor differentiation, degree of invasion, lymph node metastasis, distant metastasis, TNM grading, and poor survival. These results indicate that the QKI-5 expression may be a novel, independent factor in the prognosis of prostate cancer patients.
Keywords: RNA binding protein QKI-5, prostatic carcinoma, lentivirus, methylation, prognosis, inhibition, survival
Introduction
Prostate cancer (PCa) is the most common noncutaneous cancer and is the second and third leading cause of cancer deaths in the men of America and Europe, respectively. Moreover, prostate cancer is becoming more and more common in China.1-4 In 2012, approximately 239 000 individuals were diagnosed with prostate cancer, and 30 000 patients died from prostate cancer.5 With an early diagnosis and timely surgery, many patient deaths could be prevented. However, most patients are diagnosed in the advanced stages of prostate cancer, when surgery is inappropriate. In addition to surgery, one important prostate cancer treatment is endocrine therapy, which unfortunately is not 100% efficacious. Therefore, the identification of prostate cancer related genes is important to increase our knowledge of this disease and to discover new diagnostic and therapeutic targets.6
Currently, it is well established that the RNA-binding proteins and microRNAs are key regulators in cell biology, and they regulate the stability, transcriptional efficiency, translocation and alternative splicing of RNA. Deficient mRNA regulation has been recognized as closely related to many human diseases, including cancer.7 The RNA-binding protein quaking 5 (QKI-5) is a member of the evolutionarily conserved signal transduction and activation of RNA (STAR) protein family and is viewed as a key post-transcriptional regulator.8 Through reorganization and binding to the QKI-5 responsive elements (QRE) in the 3′UTRs of mRNA, which mainly contain NACUAAY-N(1–20)-UAAY sequences, QKI-5 regulates the location, stability, and translational efficiency of target mRNA and thus modulates physiological and pathological processes.9 To the best of our knowledge, many cancer-related genes are targets of QKI-5, including c-fos,10 p27,11-13 and β-catenin.14 Recently, a variety of studies have found that the aberrant expression of QKI-5 was associated with the development and progression of human cancers.14-16 This evidence indicates that QKI-5 plays a tumor suppressive role in a variety of cancers.
No studies have examined the correlation of prostate cancers and QKI-5 expression, which could be meaningful for the diagnosis and prognosis of prostate cancer. For the first time, in the present study, we studied and evaluated the following in the context of QKI-5 and prostate cancer: (1) the role of decreased QKI-5 expression in the development and progression of prostate cancer and (2) the correlation of QKI-5 with the Gleason score, degree of differentiation, degree of invasion, TNM grading, lymphatic and distant metastasis, serum PSA value, and survival rates of prostate cancer. We determined that the decreased QKI-5 expression in prostate cancer may be due to aberrant promoter methylation. Our results showed that QKI-5 inhibited prostate cancer cell proliferation both in vitro and in vivo. In addition, QKI-5 may be an independent factor that influences prostate cancer prognosis and thus a potential diagnostic and therapeutic target.
Results
QKI-5 expression in prostatic hyperplasia and prostate cancer tissues
As shown in Table 1, QKI-5 expression was evident in 81.3% (65/80) of the prostatic hyperplasia tissue samples and was at a significantly higher percentage than the percentage of QKI-5-positive samples of prostate cancer (33.2% [61/184], χ2 = 51.7, P < 0.001). To elucidate the role of QKI-5 in the development of prostate cancer, the QKI-5 mRNA and protein expression in both the prostate cancer and the adjacent normal tissues were examined. For mRNA quantification, the QKI-5 mRNA expression was normalized to the GAPDH mRNA levels. The lowest QKI-5 mRNA expression level in the prostate cancer samples was set as 1. The average QKI-5 mRNA expression levels in the prostate cancer and adjacent normal tissues were 1.49 ± 0.48 and 2.47 ± 0.51, respectively. Moreover, the QKI-5 mRNA expression in 80 cases of benign prostatic hyperplasia was 4.12 ± 1.31. The differences in the mRNA expression levels between the PCa, adjacent normal tissues and BPH were significant (P < 0.001). The results of the western blot and immunohistochemistry analyses were similar compared with the results of the real-time qPCR, and the representative data are shown in Figure 1A and B. These data demonstrated a significant reduction in the QKI-5 mRNA and protein expression in prostate cancer tissue.
Table 1. Expression of QKI-5 in benign prostatic hyperplasia (BPH) and prostate cancer (PCa) tissues.
| Group | QKI-5− | QKI-5+ | χ2 value | P |
|---|---|---|---|---|
| BPH | 15 | 65 | 51.7 | <0.001 |
| PCa | 123 | 61 |
Data are presented as n (number of samples). Statistical significance was evaluated using the Pearson χ2 test.
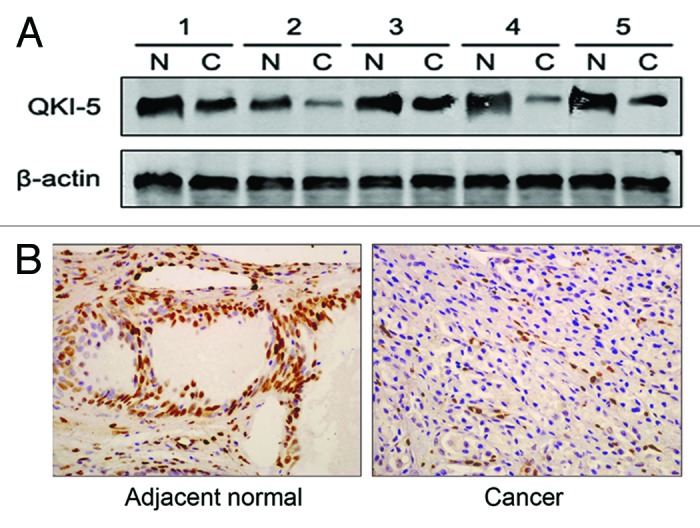
Figure 1. QKI-5 protein expression in PCa samples. (A) Western blot analysis of the QKI-5 expression in fresh clinical samples. The differences in the protein expression levels between the PCa and adjacent normal tissues were significant. Data presented are representative of all samples. (B) The QKI-5 protein expression in prostate tumor tissues detected by immunohistochemistry. The QKI-5 protein expression levels were much lower in most cancerous tissues than in the matched adjacent normal tissues (400×). Data presented are representative of all samples.
QKI-5 promoter hypermethylation correlated with the downregulation of QKI-5 expression
Next, we determined the mechanism of the decreased QKI-5 expression in prostate cancer. According to the promoter region analysis, we found abundant CpG islands in the QKI-5 promoter, especially in the 500 base pairs upstream of the transcription initiation site. This phenomenon led us to examine whether the low expression level of QKI-5 was due to CpG island hypermethylation. As shown in Figure 2B, in QKI-5 low expressing tissue samples, promoter methylation was abundant. In addition, a higher percentage of QKI-5 promoter methylation was observed in the advanced stage prostate cancers (III–IV) compared with the percentage of promoter methylation in the early stage prostate cancers (I–II) (Fig. 2B). These data indicated that low QKI-5 expression levels were due to enhanced promoter methylation.
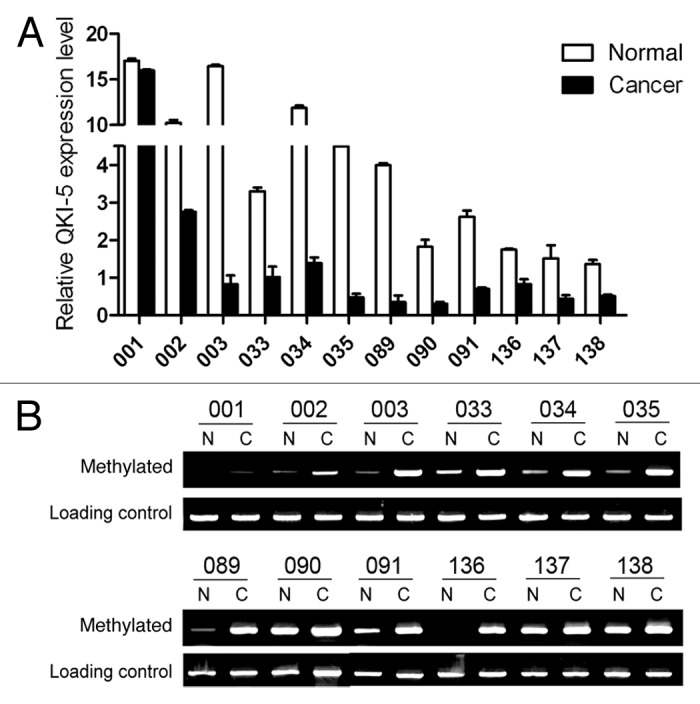
Figure 2. Promoter methylation contributes to the deregulation of QKI-5 in PCa. (A) The relative QKI-5 expression in both matched adjacent normal and cancer samples from selected patients. The QKI-5 expression is expressed as the 2−ΔΔCt. (B) Methylation status of the QKI promoter in both normal and cancerous tissues from 6 representative patients at stages I–II and III–IV. The upper panel represents the early stages (I–II), and the lower panel represents the advanced stages (III–IV). The methylated promoter and the total methylation level (loading control) of each sample were amplified with specific primers.
QKI-5 expression in prostate cancer cell lines
After examining the promoter methylation state, we determined the QKI-5 expression levels in three prostate cancer cell lines. Western blot and RT-PCR results showed that among the three prostate cancer cell lines, the PC3 cells had the lowest and DU145 had the highest expression of QKI-5 (Fig. 3A). Therefore, we overexpressed QKI-5 in the PC3 cells and knocked-down QKI-5 expression in the DU145 cells.
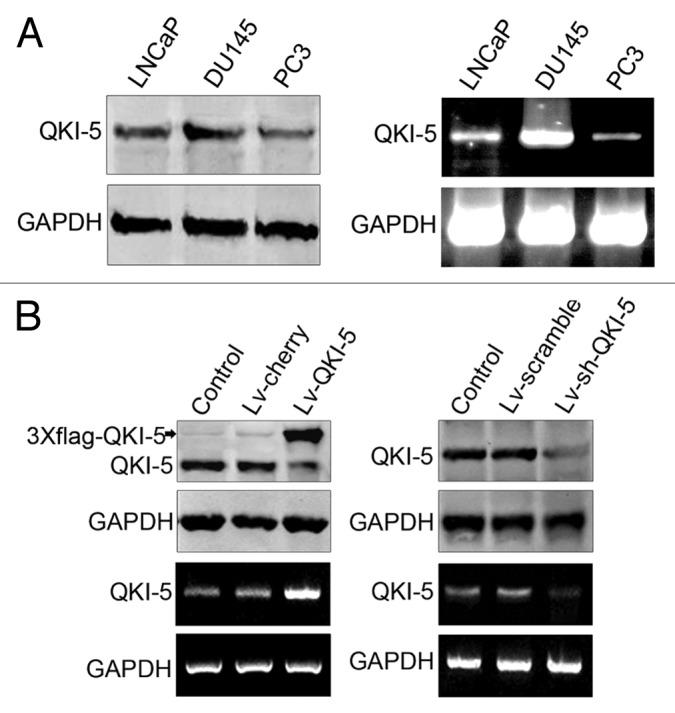
Figure 3. QKI-5 expression in PCa cell lines before and after infection with lentivirus Lv-QKI-5 and Lv-sh-QKI-5. (A) LNCaP, DU145, and PC3 cells were collected for the extraction of protein and mRNA and analyzed for QKI-5 expression using western blot and RT-PCR. Western blot and RT-PCR results showed that among the three prostate cancer cell lines, the PC3 cells had the lowest and DU145 had the highest expression of QKI-5. (B) The QKI-5 low-expressing PC3 prostatic cancer cells were infected with a lentivirus carrying QKI-5 (Lv-QKI-5) or the negative control, (Lv-cherry), and the QKI-5 high-expressing DU145 prostatic cancer cells were infected with a lentivirus carrying QKI-5 shRNA (Lv-sh-QKI-5) or a scrambled negative control (Lv-scramble). Thereafter, the protein and mRNA from these cells were extracted and subjected to western blot and RT-PCR analysis. GAPDH was used as a loading control.
Lentiviral infection and the inhibition of cell proliferation
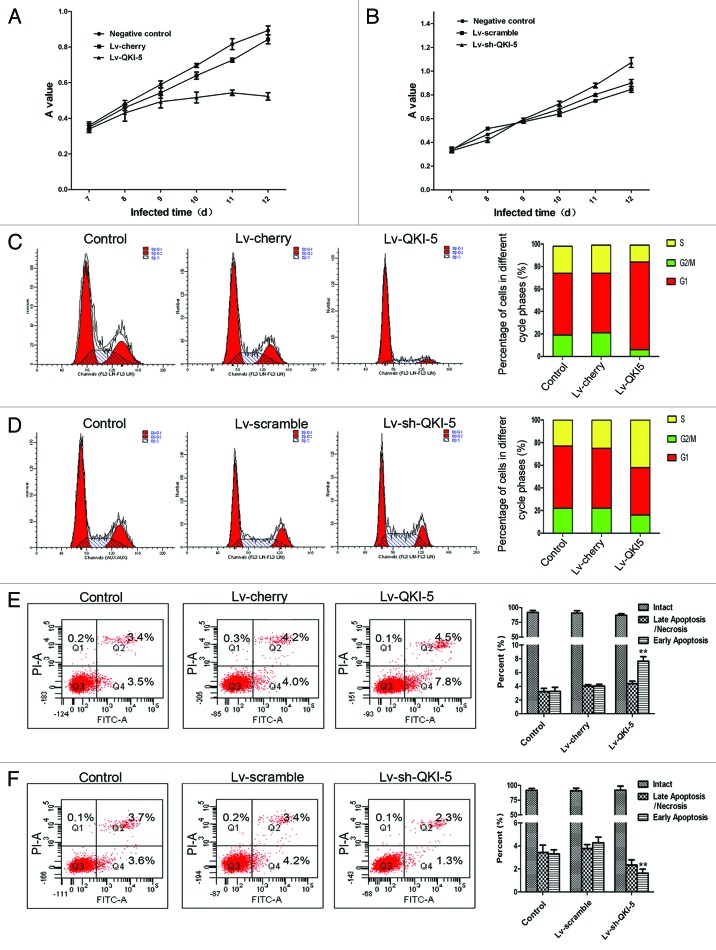
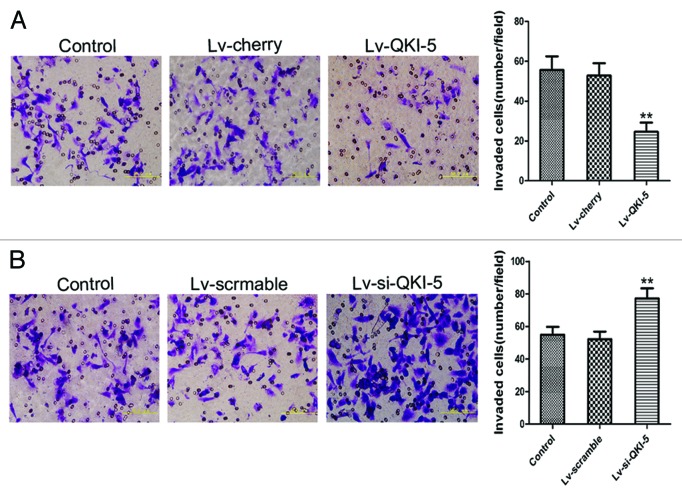
To evaluate the extent of the QKI-5 upregulation or downregulation, we utilized western blot and RT-PCR analysis. As shown in Figure 3B and after lentiviral infection, the QKI-5 expression was upregulated in the PC3 cells and downregulated in the DU145 cells. The cell proliferation curves showed that the overexpression of QKI-5 inhibited PC3 cells proliferation to an increasing degree over time (Fig. 4A). The proliferation of the QKI-5 downregulated DU145 cells was elevated (Fig. 4B). The results of the FCM analysis demonstrated that the overexpression of QKI-5 in PC3 cells created a block in the G0/G1 phase, compared with the other two groups (Fig. 4C). The knocked-down of QKI-5 in DU145 cells more easily entered into the S phase of the cell cycle, compared with the other two groups (Fig. 4D). The percentage of apoptotic cells in the PC3 cells overexpressing QKI-5 was significantly higher than the percentage of apoptotic cells in the cherry and control groups (Fig. 4E), and the percentage of apoptotic cells in the QKI-5 knock-down DU145 cells was significantly lower than scramble and control groups (Fig. 4F). Western blot analysis showed that in the QKI-5 overexpressing PC3 cells, the cyclin D1 and CDK4 expression levels were downregulated and that the P27 and PARP expression level was upregulated (Fig. 5A), and in the QKI-5 knock-down DU145 cells, the cyclin D1 and CDK4 expression levels were upregulated, and that the P27 and PARP expression level was downregulated (Fig. 5B). Moreover, the ability of the QKI-5 overexpressing PC3 cells to invade through Matrigel was notably higher than the ability of the cherry and control groups (Fig. 6A). Meanwhile, the ability of invasion was significantly elevated in the QKI-5 knock-down DU145 cells, compared with other two groups (Fig. 6B).
Figure 4. Effects of QKI-5 on prostate cancer cell growth, cell cycle, and apoptosis. (A) The cell growth curves are based on the average absorbance values (n = 6) detected with an autokinetic enzyme scaling meter using the MTT method. The cell growth curves showed that overexpression of QKI-5 significantly inhibited the growth of PC3 cells. All assays were performed at least three independent times. (B) The cell growth curves showed that knockdown of QKI-5 could promote the growth of PC3 cells more than that of the other two groups. (C) The PC3 cells infected with Lv-QKI-5 were more easily arrested in the G0/G1 phase. (D) The DU145 cells infected with Lv-sh-QKI-5 more easily entered into the S phase of the cell cycle. (E) The percentage of early apoptotic cells in the QKI-5 group was increased compared with the other two groups. (F) The percentage of early apoptotic cells in the QKI-5 group was decreased compared with the other two groups. Statistical significance was evaluated with one-way ANOVA analysis,*P < 0.05, **P < 0.01.
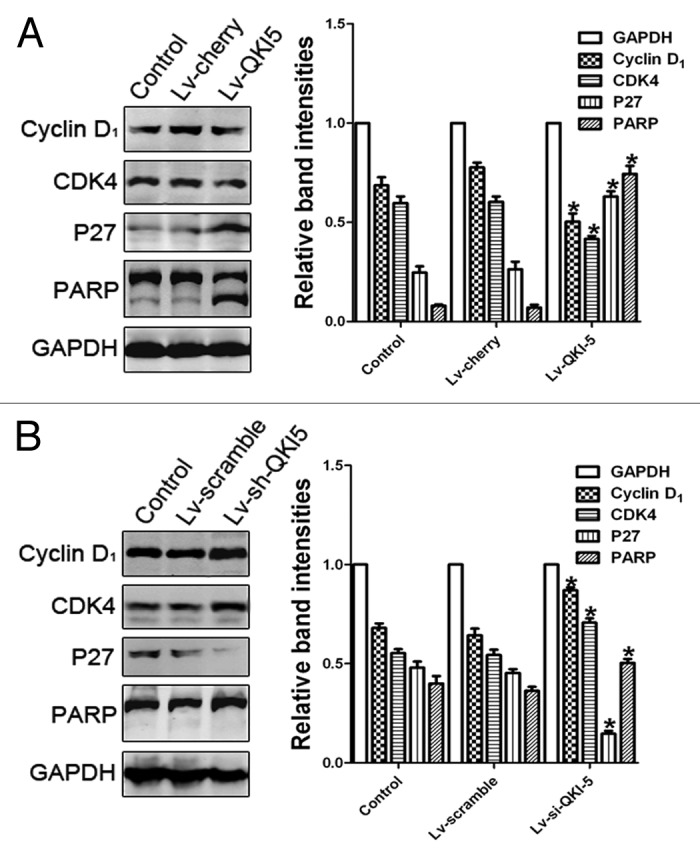
Figure 5. The influence of QKI-5 overexpression or silencing in PC3 cells and DU145 cells. (A) The effect of QKI-5 overexpression on the G1 phase and the apoptosis regulators as analyzed by western blot. Western blot analysis showed that in the QKI-5 overexpressing PC3 cells, the cyclin D1 and CDK4 expression levels were downregulated and that the P27 and PARP expression level was upregulated. (B) The effect of QKI-5 silencing on the G1 phase and the apoptosis regulators as analyzed by western blot. Western blot analysis showed that in the QKI-5 silencing DU145 cells, the cyclin D1, and CDK4 expression levels were upregulated and that the P27 and PARP expression level was downregulated. The relative quantification of QKI-5 and other regulatory protein expression was normalized to the GAPDH protein expression levels. Western blots were analyzed with the ImageJ software. The trend of each group is indicated. The data are presented as the mean ± SD and one-way ANOVA analysis for three independent experiments. *P < 0.05.
Figure 6. The effect of QKI-5 on the invasion of the PC3 and DU145 prostate cancer cell lines. (A) The Matrigel invasion assay of PC3 cells infected with the Lv-QKI-5 or Lv-cherry lentivirus (400×). The ability of the QKI-5 overexpressing PC3 cells to invade through Matrigel was notably higher than the ability of the cherry and control groups. (B) The Matrigel invasion assay of DU145 cells infected with the Lv-sh-QKI-5 or Lv-scramble lentivirus (400×). The ability of the QKI-5 silencing DU145 cells to invade through Matrigel was notably lower than the ability of the scramble and control groups. Statistically significant differences were observed between the QKI-5 interference groups and the other two groups. The error bars represent the mean ± SD and one-way ANOVA analysis of three independent experiments. *P < 0.05, **P < 0.01.
In vivo growth inhibition
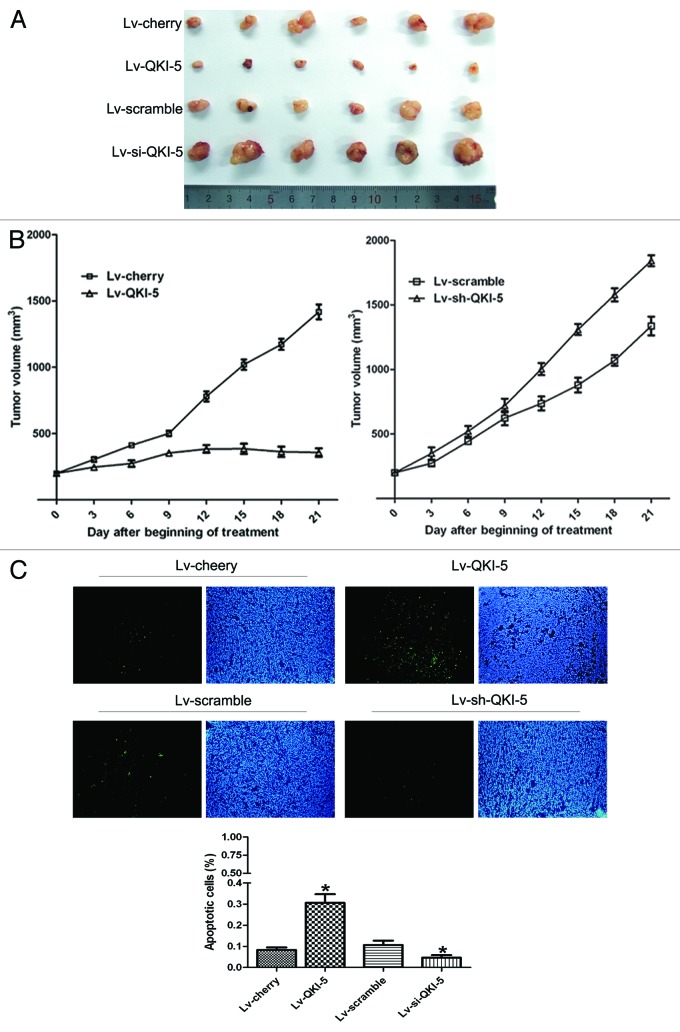
Twenty days after PC3 cell transplantation, tumors were generated with an average volume of 200 mm3 per group. After the injection of the lentivirus, six mice were included in each experimental group. The results showed that QKI-5 inhibited the PC3 cell growth after implantation into nude mice (Fig. 7A and B). A significant difference in growth rate emerged 6 d post-lentivirus injection. The tumor volumes in mice injected with the QKI-5 lentivirus were reduced compared with the tumor volumes of the cherry group. In contrast, when QKI-5 was knocked-down by shRNA, the tumor volumes increased compared with the tumor volumes of the scramble group (Fig. 7A and B). QKI-5 overexpressing and QKI-5 shRNA lentivirus upregulated and downregulated the QKI-5 expression in tumors, respectively. The apoptotic nuclei of the PC3 tumor cells mirrored the results obtained in the in vitro experiments (Fig. 7C).
Figure 7. The in vivo QKI-5 suppression of PC3 xenograft growth. (A) QKI-5 (infected with Lv-QKI-5) suppresses the growth of the tumors compared with the cherry lentivirus, and QKI-5 (infected with Lv-sh-QKI-5) facilitates the growth of the tumors compared with the Lv-scramble. (B) The tumor growth curves were determined by assessing the tumor volumes every 3 d until treatment Day 21 by measuring two perpendicular diameters and calculating the volume in mm3. Statistical analysis was performed with only the Day 21 values using the Student t test, statistically significant differences were compared with the control groups. (C) Apoptotic cells detected with TUNEL staining (200×) and the percentages of apoptotic cells in the different groups. The histogram was determined based on the average percentage of apoptotic cells in ten random visual fields of every group. The results shown are presented as the mean ± SD and Student t test, *P < 0.05.
Correlation of QKI-5 mRNA expression with the clinical pathological features of prostate cancer
We next analyzed the correlation of the QKI-5 mRNA expression with different clinical factors. Because of the quantitative limitations of western blot and immunohistochemistry analysis, we conducted real-time qPCR experiments. The average relative quantitation (RQ) value of paired adjacent normal tissues was 2.47 ± 0.51, and based on this value, we divided the tissue samples into three QKI-5 expression groups: increased (>2.98), normal (1.96–2.98), and decreased (<1.96). Because of the limited number of tissues samples, however, the two normal and increased QKI-5 expression groups were combined into one group, defined as the non-decreasing group. The correlation of QKI-5 mRNA levels in PCa samples with different clinicopathologic factors was shown in Table 2. We found that the QKI-5 mRNA expression level was closely related with the Gleason score, differentiation condition, degree of infiltration, distant metastasis, and TNM grading. Statistically significant correlations could be found between QKI-5 and Gleason score (P < 0.001), differentiation status (P < 0.001), depth of invasion (P < 0.05), lymph node metastasis (P < 0.01), pTNM stage (P < 0.001), and distant metastasis (P < 0.001) (Table 3). The correlation coefficients between QKI-5 and clinicopathologic characteristics were shown in Table 3.
Table 2. Correlation of QKI-5 with clinicopathologic characteristics of patients with PCa.
| Variable | N | QKI mRNA expression | P | |||
|---|---|---|---|---|---|---|
| Reduced | % | Unreduced | % | |||
| Age at diagnosis | 0.954a | |||||
| ≥60 | 120 | 83 | 69.20% | 37 | 30.80% | |
| <60 | 64 | 44 | 68.80% | 20 | 31.20% | |
| Gleason score | <0.001b | |||||
| 2:4 | 27 | 11 | 40.70% | 16 | 59.30% | |
| 5:7 | 63 | 39 | 61.90% | 24 | 38.10% | |
| 8:10 | 94 | 77 | 81.90% | 17 | 18.10% | |
| PSA in serum | 0.457a | |||||
| >20 ng/ml | 156 | 106 | 67.90% | 50 | 32.10% | |
| ≤20 ng/ml | 28 | 21 | 75.00% | 7 | 25.00% | |
| Differentiation status | <0.001a | |||||
| Well | 25 | 9 | 36.00% | 16 | 64.00% | |
| Moderately | 66 | 43 | 65.20% | 23 | 34.80% | |
| Poor and undifferentiatedly | 93 | 75 | 80.60% | 18 | 19.40% | |
| Depth of invasion | 0.050a | |||||
| pT1+pT2 | 52 | 28 | 53.80% | 24 | 46.20% | |
| pT3+pT4 | 132 | 99 | 75.00% | 33 | 25.00% | |
| Lymph node metastasis | 0.001a | |||||
| Absent (N0) | 81 | 46 | 56.80% | 35 | 43.20% | |
| Present (N1:3) | 103 | 81 | 78.60% | 22 | 21.40% | |
| Distant metastasis | 0.001a | |||||
| Absent (M0) | 142 | 87 | 62.30% | 55 | 37.70% | |
| Present (M1) | 42 | 40 | 95.20% | 2 | 4.80% | |
| pTNM stage | <0.001b | |||||
| I | 21 | 5 | 23.80% | 16 | 76.20% | |
| II | 27 | 16 | 59.30% | 9 | 40.70% | |
| III | 79 | 59 | 74.70% | 18 | 25.30% | |
| IV | 57 | 47 | 82.50% | 10 | 17.50% | |
aP value when expression levels were compared using the Pearson χ2 test. bP value when expression levels were compared using Mann–Whitney U test.
Table 3. Correlation coefficients of QKI-5 with clinicopathological characteristics patients with PCa.
| Variable | Correlation coefficient (r) | P |
|---|---|---|
| Age at diagnosis | −0.300 | 0.964 |
| Gleason score | −0.316 | <0.001 |
| PSA in serum | −0.220 | 0.766 |
| Differentiation status | −0.301 | <0.001 |
| Depth of invasion | −0.206 | 0.050 |
| Lymph node metastasis | −0.235 | 0.010 |
| Distant metastasis | −0.308 | <0.001 |
| pTNM stage | −0.260 | <0.001 |
Statistical significance was evaluated by correlation coefficient analysis.
Correlation of QKI-5 mRNA expression with prostate cancer patient survival
The correlation of QKI-5 mRNA expression with the survival of prostate cancer patients was determined by the Kaplan–Meier test (Fig. 8). These results showed that decreased QKI-5 expression was significantly correlated with poor survival. In the QKI-5 mRNA non-decreasing group, the median survival time of prostate cancer patients was 39.9 mo. However, in the QKI-5 mRNA decreased group, the median life survival time was only 25.1 mo. In addition, the Gleason score, differentiation status, degree of invasion, lymph node metastasis, distant metastasis, and TNM grading were closely correlated with the survival time. The age at diagnosis and serum PSA values were not correlated with the survival time.
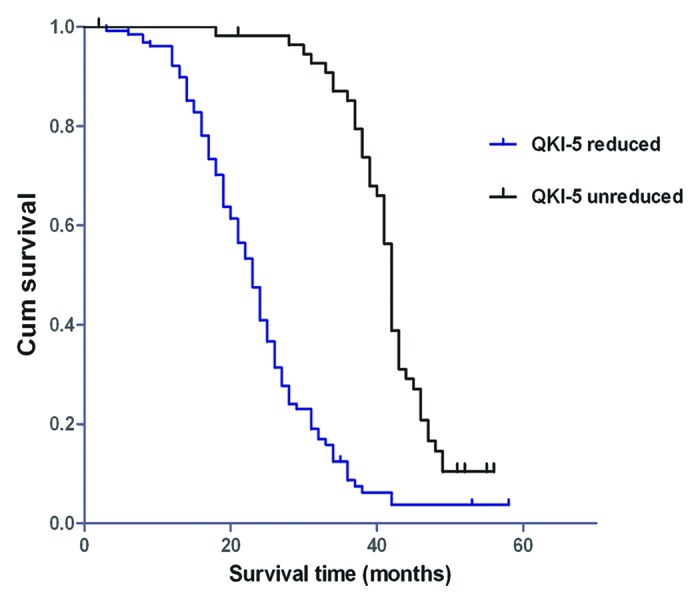
Figure 8. Kaplan–Meier postoperative survival curves for PCa patients with different QKI-5 expression levels.
The results of the multivariate Cox proportional hazards model showed that the Gleason score, distant metastasis, and TNM grading were important risk factors. After the adjustment for the factors of PSA serum levels, age at diagnosis, Gleason score, differentiation status, degree of invasion, lymph node metastasis, distant metastasis, and TNM grading, the QKI-5 mRNA expression level was still an independent variable for survival (Table 4). These results demonstrated that the decrease of the QKI-5 mRNA expression level was closely correlated with poor survival in prostate cancer patients.
Table 4. Univariate and multivariate analysis of survival time in patients with prostate cancer according to clinicopathologic factors and QKI-5 mRNA expression.
| Unadjusted HRa (95% CI) | P | Adjusted HRb (95% CI) | P |
|---|---|---|---|
| 0.903 (0.644–1.265) | 0.552 | 0.659 (0.308–1.409) | 0.282 |
| 1.344 (1.072–1.685) | 0.010 | 0.663 (0.172–2.552) | 0.550 |
| 0.966 (0.608–1.536) | 0.884 | 1.441 (0.844–2.461) | 0.180 |
| 1.330 (1.060–1.669) | 0.014 | 1.415 (0.368–5.441) | 0.614 |
| 1.692 (1.169–2.450) | 0.050 | 1.229 (0.536–2.820) | 0.626 |
| 1.875 (1.352–2.598) | <0.001 | 1.839 (0.885–3.818) | 0.102 |
| 1.905 (1.315–2.760) | 0.010 | 0.976 (0.529–1.803) | 0.939 |
| 1.222 (1.044–1.430) | 0.013 | 0.956 (0.532–1.716) | 0.879 |
| 0.244 (0.168–0.354) | <0.001 | 0.257 (0.163–0.406) | <0.001 |
a Hazard ratios in univariate models. bHazard ratios in multivariable models.
Discussion
The clinical therapy for advanced prostate cancer is still a worldwide medical challenge. The median survival time of hormone independent prostate cancer (HRPC) patients is less than two years,17 and the benefit of conventional chemotherapy for HRPC is quite limited. Although great improvements in imaging techniques have occurred, the conventional therapies of surgery and chemoradiotherapy still result in a poor survival rate for advanced prostate cancer patients. Therefore, an early diagnosis and the discovery of new therapies are at the center of prostate cancer research.
The RNA-binding protein QKI-5 is an important gene that should not be neglected as a variety of studies have shown that QKI-5 plays a key role in cell proliferation and differentiation. Some significant results have been confirmed by our previous studies.14,18 It would be interesting to investigate if QKI-5 plays similar roles in prostate cancer as in other malignant tumors. The data in the present study showed that the percentage of QKI-5-positive prostate cancer samples is significantly lower than the percentage of BPH samples. In addition, the decrease in QKI-5 expression is closely correlated with the Gleason score, differentiation status, degree of invasion, lymph node metastasis, distant metastasis, and TNM grading. The results of Kaplan–Meier test revealed a notable correlation of decreased QKI-5 mRNA expression with a low survival rate. The results of multivariate Cox proportional hazards models indicated that the QKI-5 mRNA expression was an independent factor for survival. All of these data demonstrated that QKI-5 plays a key role in the development of prostate cancer.
It is well-known that aberrant DNA methylation is associated with multiple human diseases, particularly cancers.19 Our study has found that the low expression of QKI-5 in prostate cancer is mainly due to promoter hypermethylation, which is a different mechanism than found in gliomas,16,20 but is consistent with the mechanism of colon cancer.14 Moreover, we have verified that the degree of QKI-5 promoter methylation increases with the TNM grade, consistent with the positive correlation of the decrease in QKI-5 expression and tumor progression. Our data indicated that the level of QKI-5 promoter methylation is a marker of prostate cancer progression, and therefore, the detection of the QKI-5 promoter methylation levels could be a valuable tool for distinguishing the different subtypes of prostate cancer.
To test the inhibitory role of QKI-5 in prostate cancer, we conducted MTT, Transwell, TUNEL, and FACS assays. Both in vitro and in vivo, the overexpression of QKI-5 inhibited the PC3 cell proliferation, blocked the cell’s entry into the S phase, decreased the PC3 cells’ invasion ability and promoted PC3 cell apoptosis. Using lentiviral shRNA, we confirmed the role of QKI-5 in prostate cancer. These data demonstrated that QKI-5 plays a tumor suppressive role in prostate cancer.
In conclusion, we have shown that QKI-5 inhibits prostate cancer cell proliferation, cell cycle progression and invasion and promotes prostate cancer cell apoptosis. Elucidating the molecular mechanism of QKI-5 regulation may provide a new prostate cancer therapy. Furthermore, the decrease in QKI-5 expression is closely correlated with the Gleason score, advanced TNM grading, poor differentiation, high degree of infiltration, lymph node metastasis, distant metastasis, and poor survival. All of this evidence suggests that QKI-5 represents a new diagnostic index and a novel molecular target for prostate cancer therapies.
Materials and Methods
Human subjects
This study was approved by the Ethics Committee of the Fourth Military Medical University (Xi’an, PR China), and all patients involved provided written informed consent. The human study cohort consisted of 264 patients, including 80 BPH and 184 prostate cancer patients. Samples of prostate cancer were randomly selected from prostate cancer patients at the Xijing Hospital that were diagnosed from January 2005 to December 2007. The individuals who received chemotherapy before or after surgery were excluded from the analysis. The participant information was updated by mail or telephone follow-up every three months. All samples were stored at –80 °C after flash freezing in liquid nitrogen. Each prostate cancer sample and matched adjacent normal tissue were evaluated and confirmed by the Department of Pathology, Xijing Hospital. The pathological data were obtained from a clinical database, and the sample evaluation and information recording were conducted in a double-blinded manner.
Total survival time
The final follow-up was completed in December 2012, with more than 5 y of monitoring for each patient. The follow-up was conducted from the date of surgery until death or the December 2012 deadline. The doctor responsible for recording the follow-up information was blind to the clinical pathological database and the QKI-5 mRNA results.
Immunohistochemistry
The QKI-5 antibody was purchased from Santa Cruz Biotechnology, and the assay was conducted according to the manufacturer’s instruction. Tissue sections (4 μm) were prepared for H&E staining and also for immunohistochemical examination. For immunohistochemical analysis, the endogenous peroxidases were blocked using 0.75% H2O2 in phosphate-buffered saline (PBS) for 45 min, followed by incubation in 5% bovine serum albumin blocking buffer. The tissue sections were incubated with the primary anti-QKI-5 antibody (1:200) for 12 h at 4 °C. Immunodetection was performed using a 3-step protocol, with a streptavidin-horseradish peroxidase complex and visualization by 3, 3-diaminobenzidine.
Cell culture
The PC3, LNCaP, and DU145 cell lines were used to model prostate cancer. The cells were cultured in DMEM medium supplemented with 10% FBS, seeded in 25 cm2 plastic cell culture flasks and grown in a 37 °C incubator with 5% CO2.
Western blot
Total cellular protein was extracted with RIPA buffer (Cell Signaling) from three prostate cancer cell lines, prostate cancer tissues and adjacent normal tissues. A BCA assay was conducted to quantify the amount of protein, and 40 μg of protein for each sample was subjected to SDS-PAGE using 10% polyacrylamide gels and transferred to nitrocellulose membranes. The membranes were incubated with a primary antibody raised against QKI-5 (1:500) and other regulatory proteins overnight at 4 °C. After the membranes were washed with TBST, they were incubated in an IgG-IRDyeTM800CW fluorescent secondary antibody solution (diluted 1:5000 in TBS) for 1 h at 37 °C. The protein bands were visualized using an Odyssey Infrared Imaging Laser scanning imaging system.
Real-time qPCR
The total RNA was extracted with the Trizol reagent (Invitrogen) according to the manufacturer’s instructions, and the RNA concentration was determined with an UV spectrophotometer. Two micrograms of RNA were used as a template for reverse transcription according to the instructions of the M-MLV assay kit (Invitrogen). The primer sequences utilized in the study were as follows: QKI-5 forward primer, TAGCAGAGTA CGGAAAGACA T; QKI-5 reverse primer, GGGTATTCTT TTACAGGCAC AT; GAPDH forward primer, GACCTGACCT GCCGTCTA; and GAPDH reverse primer, AGGAGTGGGT GTCGCTGT. The PCR reaction (10 μl) was performed in a Bio-Rad PCR amplifier. The real-time qPCR reaction system included the following: 5 μl of SYBR Premix Ex Taq, 0.5 μl of forward primer (10 pmol/μl), 0.5 μl of reverse primer (10 pmol/μl), 1 μl of cDNA template, and 3 μl of H2O. The amplification conditions were 40 cycles of 95 °C for 5 s and 60 °C for 30 s. The results were analyzed by the Bio-Rad CFX Manager software.
Genomic DNA extraction and detection of methylation
Genomic DNA was extracted from prostate cancer tissues and adjacent normal tissues using a DNA extraction kit (Tiangen). After nucleotide quantitation, 2 μg of genomic DNA was treated with bisulfate as previously reported.14 The methylation state of the bisulfite-modified DNA was detected by methylation-specific nested PCR. The primer sequences were as follows: methylated external nested PCR forward and reverse primers, GATTTAGTTT TTGTGTTTAG GTT and AAAATCTCTC TAAACTAATC CC, respectively; methylated internal nested PCR forward and reverse primers, GCGTCGGCGG TTGTTTCGGT CGCG and CGCCGCGCTC CGACTACGCT CCTC, respectively; and non-methylated internal nested PCR forward and reverse primers, GGGGAGGTAG GGAGGAGGGG G and AAATTCACCT CAATTCAAAC, respectively, which served as a loading control.
Lentiviral transfection
Based on the western blot results, we infected the PC3 cell line with a QKI-5 lentiviral overexpression system because the QKI-5 expression was the lowest among the three prostate cancer cell lines examined. In contrast, the DU145 cell line, which expressed the highest levels of QKI-5, was infected with QKI-5 lentiviral shRNA to reduce the QKI-5 expression level. In brief, 1 × 10⁵ PC3 and DU145 cells were seeded in 6-well plates. The culture medium was removed when the cells were 80% confluent. One milliliter of lentiviral particles targeting QKI-5 was added. Cherry and scramble lentiviral particles were added as controls for the PC3 and DU145 cells, respectively; a blank control was administered containing no lentiviral particles. Afterwards, the cells were cultured in an incubator at 37 °C with 5% CO2. Twelve hours post-infection, the lentiviral particles were removed, and DMEM medium with 15 μg/ml Blasticidin was used to culture cells for 24 h. After 3 d, lentiviral-positive cells were selected. Western blot analysis was used to evaluate the efficiency of the infection. Seven days after the selection of the positive clones, an analysis of the cell cycle and apoptosis was performed.
In vitro growth inhibition assay
MTT, FCM, and invasion assays were conducted to evaluate the in vitro growth inhibition. For each experiment, the groups were as follows: blank control (no lentivirus administration), negative control (cherry or scramble lentivirus), and the samples with upregulated or downregulated QKI-5. For the MTT assay, the PC3 and DU145 cells were seeded in 96-well plates (3000 cells/well, 6 samples), and 20 μl/well (5 mg/ml) MTT solution was added 7, 8, 9, 10, 11, and 12 d after the lentiviral infection. Then, the cells were incubated at 37 °C for 4 h. Next, the culture medium was removed, and 150 μL of DMSO was added. After 10 min of gentle shaking, the absorption values were measured at 492 nm on a multi-well plate reader. Cell growth curves were determined according to the average absorption values. In the FCM assay, the PC3 and DU145 cells were seeded in 6-well plates (5 × 10⁵ cells/well). The lentiviral infections were conducted as described above. Seven days post-infection, the cells were harvested and fixed in 70% ethanol at 4 °C overnight. The DNA was stained with 50 μg/ml PI (with RNase A) and 0.1% Triton X-100. The cell populations were detected by FCM, and each experiment was repeated at least 4 times. For the invasion assay, a 24-well chamber system (BD Biosciences) was used. In serum-free medium, 2.5 × 10⁶ cells in suspension were seeded in the upper chamber of a well (8 μm), and the lower chamber of the corresponding well was filled with medium supplemented with 10% FBS to induce cell invasion through Matrigel. The cells were cultured at 37 °C with 5% CO2 for 24 h, and afterwards, the invasive cells were fixed and stained with Giemsa (BD Biosciences). The invading cells were counted using a microscope (400×), and the average number of invading cells from five random visual fields was calculated.
Animal experiments
Male nude mice (4 weeks old) were purchased from the Experimental Animal Center of the Fourth Military Medical University. All animal experiments were performed in accordance with the Animal Care and Use Committee of the Fourth Military Medical University (Xi’an, PR China). The PC3 cells were suspended in sterile PBS, and 1 × 10⁷ PC3 cells (0.2 ml) were subcutaneously injected into the right thigh of the nude mice. When the average tumor volume reached 200 mm3 (formula: volume [mm3] = ab2/2), the mice were randomly divided into different treatment groups of 6 mice each. Some mice received an intratumoral injection of 1 × 10⁹ PFU of lentivirus either overexpressing QKI-5 or QKI-5 shRNA. The control groups were injected with a cherry or scramble lentiviral construct. The injections were conducted once every 3 d for 21 d. At the end of the experiment, the mice were sacrificed by cervical dislocation, and the tumors were harvested, measured, and weighed. A TUNEL stain was conducted to determine the number of apoptotic tumor nuclei.
Statistical analysis
Statistical analysis was performed using SPSS 16.0 software. Pearson chi-square (χ2) tests were used for QKI-5 expression measurements. Kaplan–Meier tests were performed for survival rates. Multivariate Cox proportional hazards models were used for correlation assessments between QKI-5 expression levels and clinical parameters. Statistical significances were evaluated by mean ± SD, Student t test, one-way ANOVA, or Mann–Whitney U-tests. P < 0.05 was considered statistically significant.
Disclosure of Potential Conflicts of Interest
No potential conflicts of interest were disclosed.
Acknowledgments
This study was funded by National Natural Foundation of China, NSFC81101926/H1619; 81030046; 31270843.
Glossary
Abbreviations:
- QKI-5
quaking 5
- FCM
flow cytometry
- BPH
benign prostatic hyperplasia
- PCa
prostate cancer
- STAR
signal transduction and activation of RNA
- QRE
QKI-5 responsive elements
- PSA
prostate-specific antigen
- GAPDH
glyceraldehyde phosphate dehydrogenase
- MTT
methyl thiazolyl tetrazolium
- DMSO
dimethyl sulphoxide
- TUNEL
TdT-mediated dUTP nick end labeling
Footnotes
Previously published online: www.landesbioscience.com/journals/cbt/article/26722
References
- 1.Siegel R, Naishadham D, Jemal A. Cancer statistics, 2013. CA Cancer J Clin. 2013;63:11–30. doi: 10.3322/caac.21166. [DOI] [PubMed] [Google Scholar]
- 2.Jemal A, Center MM, DeSantis C, Ward EM. Global patterns of cancer incidence and mortality rates and trends. Cancer Epidemiol Biomarkers Prev. 2010;19:1893–907. doi: 10.1158/1055-9965.EPI-10-0437. [DOI] [PubMed] [Google Scholar]
- 3.Ferlay J, Autier P, Boniol M, Heanue M, Colombet M, Boyle P. Estimates of the cancer incidence and mortality in Europe in 2006. Ann Oncol. 2007;18:581–92. doi: 10.1093/annonc/mdl498. [DOI] [PubMed] [Google Scholar]
- 4.Boyle P, Ferlay J. Cancer incidence and mortality in Europe, 2004. Ann Oncol. 2005;16:481–8. doi: 10.1093/annonc/mdi098. [DOI] [PubMed] [Google Scholar]
- 5.Siegel R, DeSantis C, Virgo K, Stein K, Mariotto A, Smith T, Cooper D, Gansler T, Lerro C, Fedewa S, et al. Cancer treatment and survivorship statistics, 2012. CA Cancer J Clin. 2012;62:220–41. doi: 10.3322/caac.21149. [DOI] [PubMed] [Google Scholar]
- 6.Rubin MA. Targeted therapy of cancer: new roles for pathologists--prostate cancer. Mod Pathol. 2008;21(Suppl 2):S44–55. doi: 10.1038/modpathol.2008.11. [DOI] [PubMed] [Google Scholar]
- 7.Biedermann B, Hotz HR, Ciosk R. The Quaking family of RNA-binding proteins: coordinators of the cell cycle and differentiation. Cell Cycle. 2010;9:1929–33. doi: 10.4161/cc.9.10.11533. [DOI] [PubMed] [Google Scholar]
- 8.Kondo T, Furuta T, Mitsunaga K, Ebersole TA, Shichiri M, Wu J, Artzt K, Yamamura K, Abe K. Genomic organization and expression analysis of the mouse qkI locus. Mamm Genome. 1999;10:662–9. doi: 10.1007/s003359901068. [DOI] [PubMed] [Google Scholar]
- 9.Galarneau A, Richard S. Target RNA motif and target mRNAs of the Quaking STAR protein. Nat Struct Mol Biol. 2005;12:691–8. doi: 10.1038/nsmb963. [DOI] [PubMed] [Google Scholar]
- 10.Yang G, Lu X, Wang L, Bian Y, Fu H, Wei M, Pu J, Jin L, Yao L, Lu Z. E2F1 and RNA binding protein QKI comprise a negative feedback in the cell cycle regulation. Cell Cycle. 2011;10:2703–13. doi: 10.4161/cc.10.16.15928. [DOI] [PubMed] [Google Scholar]
- 11.Yamamoto H, Soh JW, Shirin H, Xing WQ, Lim JT, Yao Y, Slosberg E, Tomita N, Schieren I, Weinstein IB. Comparative effects of overexpression of p27Kip1 and p21Cip1/Waf1 on growth and differentiation in human colon carcinoma cells. Oncogene. 1999;18:103–15. doi: 10.1038/sj.onc.1202269. [DOI] [PubMed] [Google Scholar]
- 12.Quaroni A, Tian JQ, Seth P, Ap Rhys C. p27(Kip1) is an inducer of intestinal epithelial cell differentiation. Am J Physiol Cell Physiol. 2000;279:C1045–57. doi: 10.1152/ajpcell.2000.279.4.C1045. [DOI] [PubMed] [Google Scholar]
- 13.Deschênes C, Vézina A, Beaulieu JF, Rivard N. Role of p27(Kip1) in human intestinal cell differentiation. Gastroenterology. 2001;120:423–38. doi: 10.1053/gast.2001.21199. [DOI] [PubMed] [Google Scholar]
- 14.Yang G, Fu H, Zhang J, Lu X, Yu F, Jin L, Bai L, Huang B, Shen L, Feng Y, et al. RNA-binding protein quaking, a critical regulator of colon epithelial differentiation and a suppressor of colon cancer. Gastroenterology. 2010;138:231–, e1-5. doi: 10.1053/j.gastro.2009.08.001. [DOI] [PMC free article] [PubMed] [Google Scholar]
- 15.Mulholland PJ, Fiegler H, Mazzanti C, Gorman P, Sasieni P, Adams J, Jones TA, Babbage JW, Vatcheva R, Ichimura K, et al. Genomic profiling identifies discrete deletions associated with translocations in glioblastoma multiforme. Cell Cycle. 2006;5:783–91. doi: 10.4161/cc.5.7.2631. [DOI] [PubMed] [Google Scholar]
- 16.Ichimura K, Mungall AJ, Fiegler H, Pearson DM, Dunham I, Carter NP, Collins VP. Small regions of overlapping deletions on 6q26 in human astrocytic tumours identified using chromosome 6 tile path array-CGH. Oncogene. 2006;25:1261–71. doi: 10.1038/sj.onc.1209156. [DOI] [PMC free article] [PubMed] [Google Scholar]
- 17.Yu C, Wu G, Dang N, Zhang W, Zhang R, Yan W, Zhao Y, Gao L, Wang Y, Beckwith N, et al. Inhibition of N-myc downstream-regulated gene 2 in prostatic carcinoma. Cancer Biol Ther. 2011;12:304–13. doi: 10.4161/cbt.12.4.16382. [DOI] [PubMed] [Google Scholar]
- 18.Bian Y, Wang L, Lu H, Yang G, Zhang Z, Fu H, Lu X, Wei M, Sun J, Zhao Q, et al. Downregulation of tumor suppressor QKI in gastric cancer and its implication in cancer prognosis. Biochem Biophys Res Commun. 2012;422:187–93. doi: 10.1016/j.bbrc.2012.04.138. [DOI] [PubMed] [Google Scholar]
- 19.Cheung HH, Lee TL, Rennert OM, Chan WY. DNA methylation of cancer genome. Birth Defects Res C Embryo Today. 2009;87:335–50. doi: 10.1002/bdrc.20163. [DOI] [PMC free article] [PubMed] [Google Scholar]
- 20.Li ZZ, Kondo T, Murata T, Ebersole TA, Nishi T, Tada K, Ushio Y, Yamamura K, Abe K. Expression of Hqk encoding a KH RNA binding protein is altered in human glioma. Jpn J Cancer Res. 2002;93:167–77. doi: 10.1111/j.1349-7006.2002.tb01255.x. [DOI] [PMC free article] [PubMed] [Google Scholar]


