Abstract
Steroid receptor coactivator 1 (SRC-1) drives diverse gene expression programs necessary for the dynamic regulation of cancer metastasis, inflammation and gluconeogenesis, pointing to its overlapping roles as an oncoprotein and integrator of cell metabolic programs. Nutrient utilization has been intensely studied with regard to cellular adaptation in both cancer and noncancerous cells. Nonproliferating cells consume glucose through the citric acid cycle to generate NADH to fuel ATP generation via mitochondrial oxidative phosphorylation. In contrast, cancer cells undergo metabolic reprogramming to support rapid proliferation. To generate lipids, nucleotides, and proteins necessary for cell division, most tumors switch from oxidative phosphorylation to glycolysis, a phenomenon known as the Warburg Effect. Because SRC-1 is a key coactivator responsible for driving a hepatic gluconeogenic program under fasting conditions, we asked whether SRC-1 responds to alterations in nutrient availability to allow for adaptive metabolism. Here we show SRC-1 is stabilized by the 26S proteasome in the absence of glucose. RNA profiling was used to examine the effects of SRC-1 perturbation on gene expression in the absence or presence of glucose, revealing that SRC-1 affects the expression of complex I of the mitochondrial electron transport chain, a set of enzymes responsible for the conversion of NADH to NAD+. NAD+ and NADH were subsequently identified as metabolites that underlie SRC-1's response to glucose deprivation. Knockdown of SRC-1 in glycolytic cancer cells abrogated their ability to grow in the absence of glucose consistent with SRC-1's role in promoting cellular adaptation to reduced glucose availability.
Cells respond to the availability of different metabolites through the dynamic regulation of distinct metabolic pathways. For example, normal cells use modest levels of glycolysis to fuel oxidative phosphorylation for efficient ATP generation but are capable of utilizing other energy sources (eg, acetyl-coenzyme A) should glucose become unavailable (1). Metabolic flexibility and decision making extends to cancer cells but is more constrained due to the anabolic requirements needed for rapid cellular proliferation (2). To support this rapid growth, cancer cells maintain high levels of glycolysis to provide substrates for lipid, nucleotide, and protein synthesis (3).
The steroid receptor coactivators (SRCs) function as transcriptional integrators linking signals from growth factors, the cellular microenvironment, and nutrient availability to transcriptional gene expression programs driven by nuclear receptors and transcription factors (4). Because of their roles as growth factor-signaling integrators, cancer cells frequently co-opt SRCs as oncoproteins (5). Animal studies of the SRC family have demonstrated they serve unique roles in metabolism, an observation recently reinforced through metabolic analyses of SRC knockout animals (6). Initial characterization of SRC-1 and SRC-2 knockout mice revealed that they are hypoglycemic. Subsequent studies have shown that SRC-1 gene ablation leads to a liver metabolic profile characterized by reduced amino acid turnover (6) whereas SRC-3−/− mice possess increased levels of acyl-carnitines (7). SRC-1 and SRC-2 also can mediate energy balance by competing for PPARγ to generate opposing metabolic transcriptional programs; SRC-2−/− mice are protected from obesity whereas SRC-1−/− mice are prone to obesity (8). Also, upon fasting, SRC-1 expression is up-regulated, leading to increased interaction with CCAAT enhancer-binding protein-α to control the gluconeogenic program, although the upstream effectors of this action have not yet been elucidated (9). Finally, consistent with a significant role for SRC-1 in metabolism, the SRC-1 mRNA is the most correlated transcript with mitochondrial DNA (mtDNA) abundance (10).
As cancer cell proliferation increases during tumor development, a “Warburg” metabolism emerges to support the increased cellular division (1). This metabolic shift leads to tumor reliance on glucose metabolism as a primary energy source to compensate for reduced energy availability in the tumor microenvironment. Consistent with the role of SRC-1 in controlling energy balance, it is an important coactivator responsible for supporting tumor cell metastasis. Indeed, SRC-1 is known to drive metastasis by activating the matrix metalloproteinase and Twist1 genes (11, 12).
Here, we show that SRC-1 responds to cellular energy stress in tumor cells to promote the expression of genes responsible for oxidative phosphorylation by modulating the expression of components of complex I of the mitochondrial electron transport chain. We find that the cellular concentration of SRC-1 protein is elevated in the absence of glucose or NAD+ due to reduced proteasomal degradation. Importantly, disruption of SRC-1 leads to cell death in the absence of glucose. These findings show that SRC-1 is a transcriptional integrator that enables cells to respond and adapt to disruptions in glucose availability and to attendant changes in cellular NAD+/NADH levels.
Materials and Methods
Materials
MG132, nicotinamide (NAM), 2-deoxyglucose, N-acetylcysteine, and carbonyl cyanide 3-chlorophenylhydrazone were obtained from Sigma. FK866 was purchased from SelleckChem. Antibodies to SRC-1, SRC-3, and HSP90 were purchased from Cell Signaling Technology. Antibody to SRC-1 used for immunofluorescence was obtained from BD Bioscience. Compound C was purchased from Calbiochem. Pyruvate was obtained from Gibco. Antibody to SRC-2 was obtained from Bethyl Laboratories. Antibodies to α-tubulin and β-actin were obtained from Sigma. Nontargeting small interfering RNA (siRNA) or siRNA SMARTpools to SRC-1, AMP-activated protein kinase (AMPK)α1 and AMPKα2 were purchased from Dharmacon. A second siRNA pool against SRC-1 was utilized and obtained from QIAGEN consisting of SI00055342, SI02631783, SI02631797, and SI03077669 siRNAs.
Cell culture
Human cancer cell lines were obtained from the American Type Culture Collection (Manassas, VA). Cell lines were cultured in DMEM supplemented with 10% fetal calf serum (FCS), penicillin, and streptomycin (100 U/mL). Administration of chemical compounds were in high-glucose DMEM or no-glucose DMEM supplemented with 10% dialyzed FCS and penicillin and streptomycin (100 U/mL) for 24 hours, unless indicated otherwise. All cells were cultured at 37°C under 5% CO2.
siRNA transfection
Twenty-four hours prior to transfection, A549 cells were plated in 6-well plates. Cells were transfected with the indicated siRNA using DharmaFECT 1 according to the manufacturer's protocol. Transfected cells were changed to medium supplemented with 10% dialyzed FCS and incubated for 36 hours before the indicated treatment.
Cell lysates
For Western blotting, cells were harvested and lysed in lysis buffer (50 mM Tris [pH 7.5], 150 mM NaCl, 0.5% Triton-X 100, and 5% glycerol) and then centrifuged for 10 minutes at 20 000 × g at 4°C. Protein lysates were separated by SDS-PAGE and transferred onto nitrocellulose membranes (Bio-Rad Laboratories). Membranes were blocked and incubated with indicated antibodies. All experiments were repeated at least 2 times. Intensities of the bands of the film were quantitated by Image J (http://rsb.info.nih.gov/ij/).
Quantitative PCR analysis
RNAs was isolated using the RNeasy mini Kit (QIAGEN). mRNA levels of SRC-1, SRC-2, SRC-3, ND6, and 18s were measured by Taqman-based RT-PCR using the ABI Prism 7700 sequence detection system (Applied Biosystems,). The following primers were used with Universal Roche Probes as indicated. SRC-1 primers tctcaaaacagaagcagatgga and gacgtcagcaaacacctgaa with probe 62. SRC-2 primers aggcaacctgttcccaaac and gcttcagcagtgtcagcaat with probe 27. SRC-3 primers ggtgatgaggcctatgatgc and gttgggcgaccatttgag with probe 3. ND6 primers ggtgctgtgggtgaaagagt and cctgacccctctccttcatag with probe 77. 18s with primers gattgatagctctttctcgattcc and gacaaatcgctccaccaact with probe 77. All mRNAs were normalized to 18s RNA. Experiments were repeated at least 2 times.
Microarray profiling
After RNA isolation, the microarray was performed and analyzed as previously described (13).
Immunofluorescence
Immunofluorescence was performed as described previously (14).
Cellular fractionation
A549 cells were grown under high-glucose DMEM or no-glucose DMEM supplemented with 10% dialyzed FCS and penicillin and streptomycin (100 U/mL) for 10 or 24 hours. Cells were then isolated and lysed via passage through a 22-gauge needle in 10 mM HEPES (pH 7.6), 1.5 mM MgCl2, 10 mM KCl buffer containing protease and phosphatase inhibitors. Homogenates were spun at 1000 × g at 4°C for 5 minutes. Supernatant corresponded to the cytoplasmic fraction. The isolated pellet was resuspended in 20 mM HEPES (pH 7.6), 1.5 mM MgCl2, 420 mM NaCl buffer and incubated for 30 minutes. The resulting mixture was spun at 15 000 × g for 30 minutes. The subsequent supernatant corresponded to the nuclear fraction. Western blotting samples were prepared by boiling the relevant fractions in 4× Laemmli buffer for 10 minutes.
mtDNA Measurement
A549 cells were grown under high-glucose DMEM, with or without 10 mM NAM or no-glucose DMEM supplemented with 10% dialyzed FCS and penicillin and streptomycin (100 U/mL) for 24 hours. Cells were then harvested and cellular DNA was isolated via the QIAGEN DNA Mini Kit (QIAGEN 13323). The isolated DNA was then quantified by probing for ND6 (as described for quantitative PCR [qPCR] analysis) and normalized to the 18s DNA.
NADH measurement
A549 cells were grown under high-glucose DMEM or no-glucose DMEM supplemented with 10% dialyzed FCS and penicillin and streptomycin (100 U/mL) for 24 hours. Cells were then harvested and NADH was quantified with a BioVision assay (K337–100).
Results
Nutrient deprivation increases SRC-1 expression
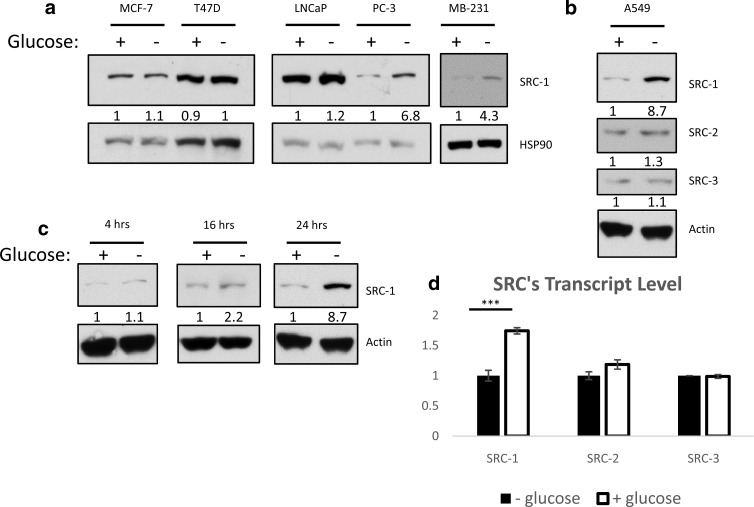
Our previous studies established SRC-1 promotes gluconeogenesis and glycemia (8, 9). Therefore, we sought to investigate the impact of changes in cellular nutrient levels on SRC-1 expression. Initially, we compared SRC-1 protein changes in response to 24-hour glucose deprivation across a panel of human cancer cell lines (Figure 1, a and b). Three cell lines representing aggressive metastatic cancers (PC-3, MDA-MB-231, and A549) expressed a low level of SRC-1 protein in glucose-containing media with a greater than 4-fold increase in SRC-1 protein level in glucose-free media (15–17). In less aggressive cancer cell lines (MCF-7, T47-D, and LNCaP), SRC-1 protein expression was unaffected by perturbation of glucose levels. Because they experience limited cytotoxicity to glucose deprivation, A549 cells were chosen for further analyses (18, 19). SRC-2 and SRC-3 did not show altered protein expression in response to glucose deprivation, suggesting a unique role for SRC-1 in glucose metabolism (Figure 1b).
Figure 1.
SRC-1 is responsive to nutrient status in more invasive cells. a and b, Different cancer cell lines were grown in the absence or presence of glucose. Whole-cell lysates were then subjected to immunoblot analysis for the indicated proteins. c, A549 cells were grown in the absence or presence of glucose for the indicated time. Whole-cell lysates were then subjected to immunoblot analysis for the indicated proteins. d, A549 cells were grown in the absence or presence of glucose. The mRNA expression of p160 family members was measured by qPCR.
Increased expression of SRC-1 protein in A549 cells occurred only after prolonged glucose withdrawal (Figure 1c). We subsequently considered the possibility that glucose deprivation was increasing SRC-1 protein levels as a result of increased transcription, a scenario consistent with the previously reported elevation of the SRC-1 transcript in the liver of fasted mice that promotes gluconeogenesis (9). qPCR analysis indicated that SRC-1 mRNA was higher when cells were treated with glucose, a condition in which SRC-1 protein levels are lower, demonstrating an unexpected inverse relationship between SRC-1 mRNA and protein expression. The differential regulation of the SRC-1 transcript upon nutrient withdrawal in liver and cancer cells could possibly be explained by the liver functioning to produce glucose upon starvation, whereas a cancer cell, instead, is primarily consuming nutrients. This finding suggested that a post-transcriptional control mechanism accounts for the increased SRC-1 protein expression observed during glucose deprivation (Figure 1d). SRC-2 and SRC-3 mRNA expression was not altered in A549 cells undergoing glucose deprivation, consistent with Western blotting results (Figure 1d).
The stabilization of SRC-1 under glucose deprivation is affected by changes in metabolite levels
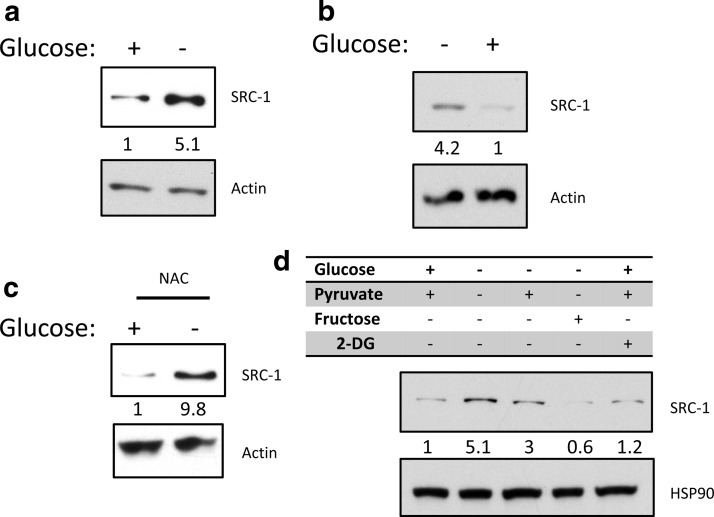
Glucose deprivation leads to a variety of cellular effects not exclusively connected to energy metabolism, including phenomena such as apoptosis, alterations in cellular reactive oxygen species (ROS) (20), or reduced cellular proliferation (21). To ensure that observed changes in SRC-1 protein expression were not an artifact stemming from cell death, we cultured A549 cells through 4 passages with or without glucose addition to the culture media. Increases in SRC-1 protein expression were sustained throughout the course of this experiment (Figure 2a) and SRC-1 expression again declined after refeeding cells with glucose (Figure 2b).
Figure 2.
The glucose responsiveness of SRC-1 is reversible and is not dependent on ROS but is dependent on nutrient availability. a, A549 cells were grown in the absence or presence of glucose. These cells were then split and grown for 4 passages in the corresponding medium. b, A549 cells passaged without glucose were subsequently changed into medium in the absence or presence of glucose. c, A549 cells were grown in the absence or presence of glucose, with a ROS inhibitor N-acetylcysteine (NAC) or a vehicle control. d, A549 cells were grown under the indicated metabolite treatment. Where indicated, cells were treated with 4.5 g/L glucose, 110 mg/L pyruvate, 4.5 g/L fructose, or 50 mM 2-DG (2-deoxyglucose) for 24 hours. Following all treatments whole-cell lysates were then subjected to immunoblot analysis for the indicated proteins.
To test whether elevated SRC-1 expression was due to generation of ROS after glucose deprivation, we tested whether N-acetylcysteine, a ROS scavenger, would affect SRC-1 protein levels. Although N-acetylcysteine greatly decreased ROS, it did not alter SRC-1 protein stability after glucose deprivation, indicating that ROS signaling is not responsible for changes in SRC-1 expression (Figure 2c). Finally, we examined the effect of metabolites downstream of glucose on SRC-1 stabilization (Figure 2d). Addition of fructose to glucose-deprived media completely abolished SRC-1 stabilization, and addition of pyruvate partially repressed SRC-1 protein stability. These data are consistent with SRC-1 expression change in response to a metabolite downstream of glycolysis, because pyruvate is at the junction of glycolysis and mitochondrial metabolism.
Increased SRC-1 expression during glucose deprivation is the result of reduced proteasomal degradation of the SRC-1 protein
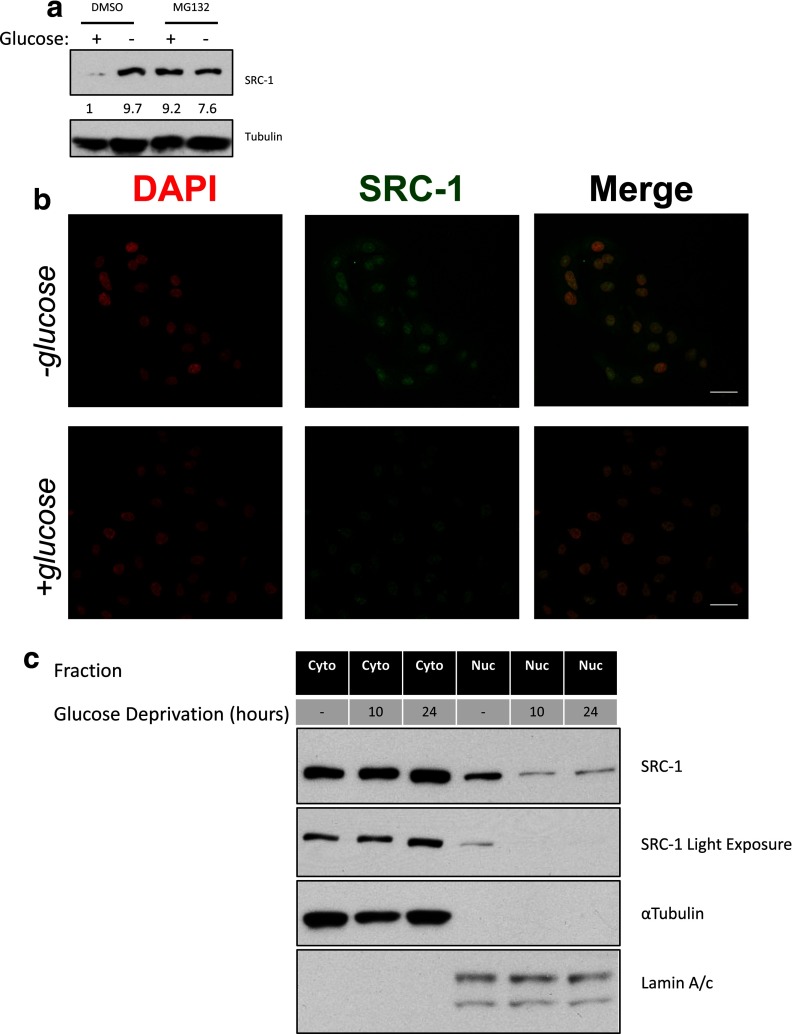
We next explored the inverse relationship between the level of the SRC-1 transcript and protein. Initially, we tested whether SRC-1 was modulated by protein turnover. Treatment with the proteasome inhibitor MG132 stabilized SRC-1 protein levels in glucose containing medium to a similar level observed in the absence of glucose (Figure 3a), suggesting that increased SRC-1 expression may stem from decreased protein turnover. Previous reports indicate that nuclear localization of SRC protein family members is responsible for their turnover by the proteasome (22). Therefore, we used immunofluorescence to analyze SRC-1 localization. We observed a marked increase in SRC-1 protein in the absence of glucose, with protein accumulation primarily in the cytoplasm (Figure 3b). To better understand the localization of SRC-1 after nutrient deprivation, we isolated nuclear and cytoplasmic fractions after 10 and 24 hours, time points at which SRC-1 expression either has (24 hours) or has not had (10 hours) adequate time to be detectably altered. We observed significantly less SRC-1 in the nucleus under these conditions, with a significant increase in cytoplasmic SRC-1 at the 24-hour time point (Figure 3c). These findings suggest that more SRC-1 resides in the cytoplasm during glucose deprivation, rendering it inaccessible to degradation. The cellular localization of SRC-1 may result from a posttranslation modification, because SRC family members have been shown to undergo extensive posttranslational modifications to promote their diverse functionality (23).
Figure 3.
SRC-1 protein accumulation is related to cellular localization and thereby protein degradation. a, A549 cells were grown in the absence or presence of glucose. For each nutrient condition, the cells were subjected to dimethylsulfoxide (DMSO) or MG132 treatment (10 μM). Whole-cell lysates were then subjected to immunoblot analysis for the indicated proteins. b, A549 cells were grown in the absence or presence of glucose for 24 hours. For each nutrient condition, the cells were subjected to immunofluorescence. Scale bars, 10 μm. c, A549 cells were grown in the presence or absence of glucose for 10 or 24 hours. Cells were subsequently fractioned for the cytoplasmic and nuclear fractions and then subjected to immunoblot analysis for the indicated proteins. DAPI, 4′,6-diamidino-2-phenylindole.
SRC-1 regulates the expression of complex I of the electron transport chain, the complex responsible for converting NADH to NAD+
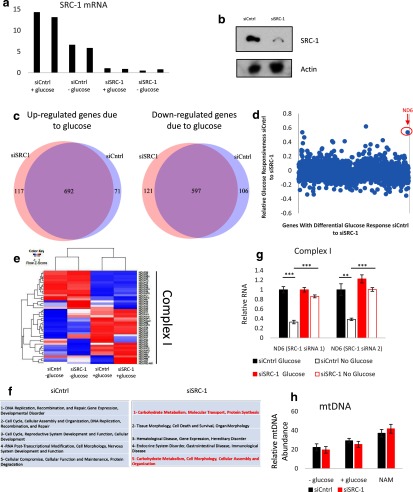
We next sought to examine the metabolites implicated in SRC-1 protein stabilization during glucose deprivation. Because SRC-1 is a coactivator, we hypothesized SRC-1 stabilization under glucose deprivation may serve an adaptive purpose and that a SRC-1-directed differential metabolic gene signature may provide insight into the specific metabolites affecting SRC-1 stability. To broadly interrogate the effects of glucose deprivation coupled to the SRC-1 target gene program, gene expression profiling was performed to compare glucose-fed vs glucose-deprived cells transfected with an SRC-1 or control siRNA (siCntrl). An Affymetrix microarray platform was used to profile A549 cells in the absence or presence of SRC-1, with or without glucose. SRC-1 knockdown was confirmed by qPCR and Western blotting (Figure 4, a and b). We considered changed genes as significant with P < .05 and fold-change greater than or equal to 1.5-fold in either direction. Glucose-responsive genes for siCntrl-treated cells were compared to the glucose-responsive genes for siSRC-1-treated cells (Figure 4c). This analysis shows that there is no global perturbation in glucose responsiveness when SRC-1 expression is knocked down by siRNA. Closer inspection of the affected genes revealed that the mitochondrial ND6 gene showed strong down-regulation upon glucose deprivation in siCntrl-treated cells, compared with siSRC-1-treated cells (Figure 4d). ND6 is an essential subunit of complex I in the mitochondrial electron transport chain that consumes NADH derived from glucose catabolism (24). To validate our results, the expression of all known subunits of complex I were compared, revealing that perturbation of SRC-1 leads to altered expression of complex I as a “whole” (Figure 4e). Ingenuity Pathway Analysis was then performed for the glucose deprivation gene signature in both the siCntrl and the siSRC-1 treated cells (Figure 4f). Interestingly, the top 5 pathways enriched under glucose deprivation were completely changed in response to silencing of SRC-1. Specifically, carbohydrate metabolism was the most enriched pathway associated with silencing of SRC-1 under glucose-deprived conditions. Using qPCR analyses, we then validated that repression of ND6 induced by glucose deprivation was blunted by silencing of SRC-1 using 2 different siRNAs (Figure 4g). Further, this effect is not associated with mitochondrial biogenesis, which is the case for PGC-1α (25), because mtDNA content under various nutrient conditions was not significantly different between control and SRC-1-silenced cells (Figure 4h). The microarray analysis, as a whole, supports a link between glucose deprivation, mitochondrial metabolism, and SRC-1.
Figure 4.
Microarray analysis and validation of SRC-1's role in reacting to glucose deprivation in A549 cells. Fourteen hours after glucose deprivation, (a) RNA was harvested for qPCR quantification of SRC-1 mRNA levels and (b) whole-cell lysates were then subjected to immunoblot analysis for the indicated proteins. c, Microarray analysis of glucose-responsive genes in response to nontargeting siRNA (siCntrl) or siSRC-1. A549 cells with siCntrl or siSRC-1 were grown in the absence or presence of glucose, RNA was harvested for microarray analysis 14 hours after glucose deprivation. d, Comparison of differential glucose-responsive genes from the microarray analysis with siCntrl or siSRC-1. Values used for the scatter plot were generated by the following equation: value = (RNA levels of siCntrl with glucose − RNA levels of siCntrl without glucose) − (RNA levels siSRC-1 with glucose − RNA levels siSRC-1 without glucose) / (RNA levels siCntrl with glucose − RNA levels siCntrl without glucose). e, Comparison of mitochondrial electron transport chain complex I genes from the microarray analysis. f, Ingenuity Pathway Analysis under glucose deprivation of nontargeting siRNA and siSRC-1. g, A549 cells with siCntrl or siSRC-1 were grown in the absence or presence of glucose. RNA was harvested for qPCR quantification of ND6 mRNA expression 14 hours after glucose deprivation. h, A549 cells were grown under high-glucose DMEM, with or without 10 mM NAM or no-glucose DMEM for 24 hours. DNA was harvested and mtDNA was quantified. *, P < .05; **, P < .01; and ***, P < .005.
The stabilization of SRC-1 protein after nutrient deprivation is mediated by altered cellular NAD+/NADH levels
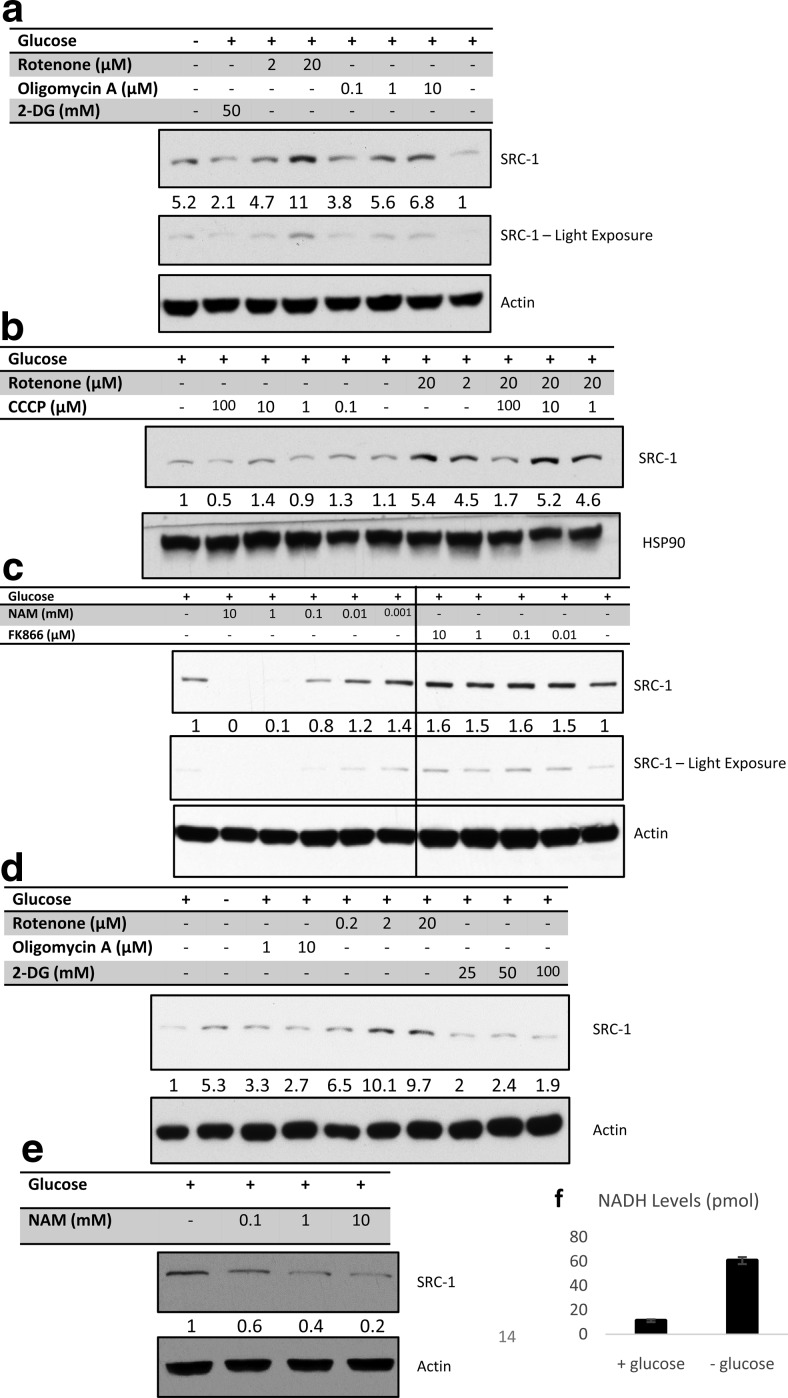
With complex I identified as a primary gene set regulated by SRC-1 perturbation under differential glucose conditions, we used a series of mitochondrial metabolic inhibitors to isolate the specific component(s) of glucose deprivation responsible for the regulation of SRC-1 protein levels. As expected, using 2-deoxyglucose, we observed changes in SRC-1 protein levels, further suggesting that increased SRC-1 protein expression in response to glucose deprivation is downstream of the glycolytic pathway (Figure 5a). Furthermore, when cells were treated with rotenone or oligomycin A, a complex I and complex V inhibitor, respectively, SRC-1 protein levels were robustly induced (Figure 5a).
Figure 5.
Effect of metabolic inhibitors on SRC-1 protein levels. a, A549 cells were grown in the absence or presence of glucose. Cells grown under glucose-containing medium were then treated with rotenone, oligomycin A, or 2-deoxyglucose (2-DG) at different concentrations. b, A549 cells grown in glucose-containing medium were treated with rotenone, carbonyl cyanide 3-chlorophenylhydrazone (CCCP), or combinations of both compounds as indicated. c, A549 cells grown in glucose-containing medium were treated with NAM or FK866 at the indicated concentration. d, PC-3 cells were grown in glucose-containing medium and treated with rotenone, oligomycin A, or 2-DG at the indicated. e, PC-3 cells grown in glucose-containing medium were treated with NAM at the indicated concentrations. For all treatments described, whole-cell lysates were then subjected to immunoblot analysis for the indicated proteins. f, NADH measurement of A549 cells grown in the absence or presence of glucose.
Next, we considered whether the effects of rotenone and oligomycin were due to direct blockage of the electron transport chain or whether it was the result of hindered ATP production. To test this, we utilized carbonyl cyanide 3-chlorophenylhydrazone, an ionophore, which causes uncoupling of the proton gradient from ATP production within the mitochondria. Interestingly, carbonyl cyanide 3-chlorophenylhydrazone lowered SRC-1 levels and could even reverse the ability of rotenone to promote an increase in SRC-1 protein levels (Figure 5b). Collectively, these results indicate that neither ATP, nor the proton gradient are specific factors that influence SRC-1 protein levels. Moreover, our results suggest the accumulation of metabolites from blockage of complex I promotes stabilization of SRC-1.
Because complex I converts NADH to NAD+, we focused on modulation of NAD+ and NADH metabolite levels as a possible mechanism of SRC-1 stabilization. Therefore, we treated cells with the NAD+ precursor NAM, and observed reduced SRC-1 levels. Alternatively, inhibition of NAM conversion to NAD+ by FK866 increased SRC-1 levels (Figure 5c). These experiments demonstrate that SRC-1 levels are sensitive to the levels and/or ratio of NAD+/NADH. To confirm that NAD+ is key for glucose deprivation-dependent stabilization of SRC-1 in another cell line, PC-3 prostate cancer cells were subjected to similar experiments and similar trends were observed (Figure 5, d and e) indicating that the relationship between SRC-1, complex I, and carbohydrate metabolism is not specific to A549 lung cancer cells. Consistent with the observation that SRC-1 is modulated by NAD+/NADH, glucose deprivation enhanced cellular NADH levels (Figure 5f).
With NAD+ identified as the metabolite that controls SRC-1 protein levels, we considered the possible upstream signaling pathways relevant to glucose withdrawal. AMPK has been shown to respond to mitochondrial dysfunction in addition to its role as an AMP-sensing kinase (26, 27). Consequently, we tested an AMPK inhibitor, compound C, and found that it can reverse NAM-dependent repression of SRC-1 levels in a dose-dependent fashion (Supplemental Figure 1a published on The Endocrine Society's Journals Online web site at http://mend.endojournals.org). To further confirm the role of AMPK in SRC-1 protein down-regulation, we silenced AMPK via an siRNA and no longer observed NAM-dependent repression of SRC-1 protein levels (Supplemental Figure 1b). This indicates that the cellular functionality of SRC-1 upon adjustments in nutrient homeostasis is modulated by AMPK.
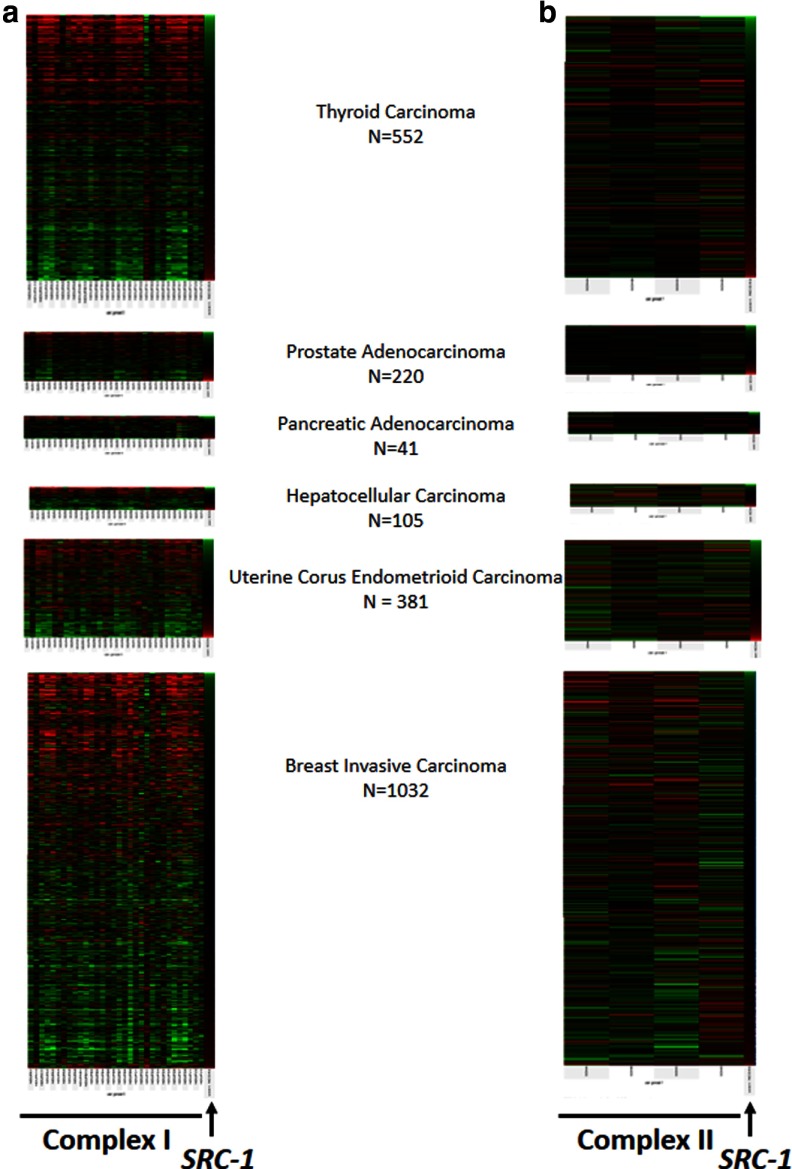
Clustering of complex I to SRC-1 expression across an array of cancer types profiled in TCGA datasets reveals an inverse correlation between their mRNA expressions (Figure 6a). Importantly, this inverse relationship is restricted to complex I, because complex II does not show a distinct correlation with SRC-1 expression levels (Figure 6b). This observation substantiates that SRC-1 specifically controls complex I function.
Figure 6.
SRC-1 expression levels are strongly correlated to complex I subunit mRNAs but not complex II subunits mRNAs. a, The mRNA expression profile of SRC-1 and complex I in a number of cancer types. Samples were clustered from low to high SRC-1 levels (top to bottom). b, The mRNA expression profile of SRC-1 and complex II in a number of cancer types. Samples were clustered from low to high SRC-1 levels (top to bottom). Green represents low expression, and red represents high expression.
The stabilization of SRC-1 with nutrient deprivation is key for cancer cell survival
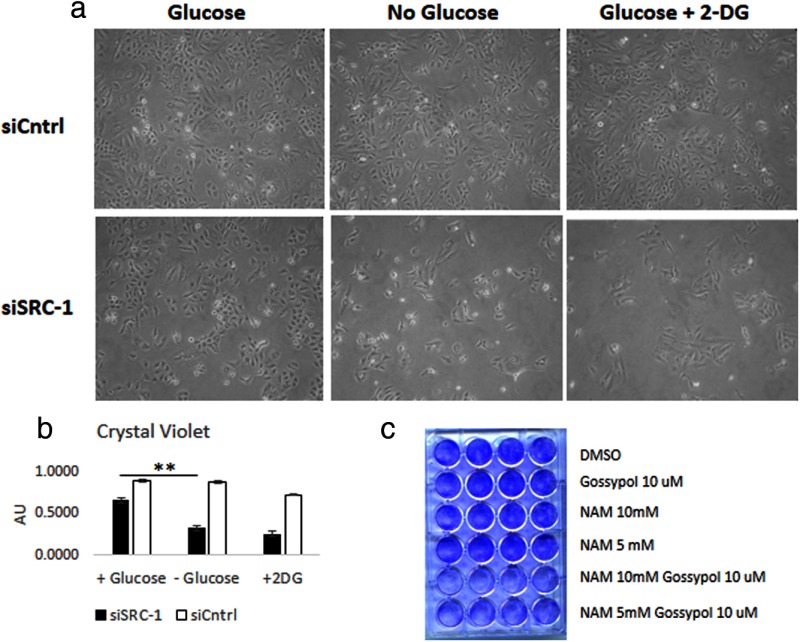
With the NAD+ level identified as a component of SRC-1 protein stability, we next sought to understand the functional significance of attenuation of SRC-1 levels under metabolic stress. Because A549 cells can survive in the absence of glucose, we tested the functional effects of glucose deprivation and of 2-deoxyglucose treatment on A549 cells in the presence or absence of SRC-1. Upon loss of SRC-1, the cells became sensitive to the loss of glucose, resulting in reduced cell proliferation as shown by bright field microscopy (Figure 7a) and crystal violet staining (Figure 7b). To further test the role of SRC-1 as a regulator responsible for metabolic adaptability, we tested the impact of combining NAM, which elevates the cellular NAD+ pool, with the SRC inhibitor, gossypol (28). These combined treatments resulted in a strong cytotoxic effect, indicating that at low levels of SRC-1, cells are not able to adjust to perturbations in their NAD+/NADH pool, resulting in cell death (Figure 7c).
Figure 7.
SRC-1 is essential for survival or growth in response to glucose deprivation. a, A549 cells, treated with siControl or siSRC-1, were grown in the absence or presence of glucose. Images of cells were obtained 24 hours after treatment. b, Cells from Figure 1a were stained using crystal violet, resuspended with sodium dodecyl sulfate, and quantified. **, P < .01. c, A549 cells were grown in the presence of glucose, with gossypol and/or NAM as indicated. The attached cells were stained with crystal violet 24 hours after treatment. DMSO, dimethylsulfoxide; 2-DG, 2-deoxyglucose.
Discussion
The SRCs are master regulators that can broadly direct transcriptional programs in response to cellular signals. The 3 members of the SRC family have been intensely studied with regard to their oncogenic function, but it also is well recognized that they also possess important roles in regulating energy metabolism, reproduction, and other physiological processes (29). Because the SRC proteins have numerous and diverse functions, they are not restricted to a single set of signaling afferents. Instead, they widely integrate diverse stimuli from the cellular environment into the regulation of appropriate genetic programs.
Given its role in the regulation of hepatic carbohydrate metabolism (9), we sought to study the relationship between SRC-1 and cellular glucose accessibility under culture conditions in which we could control the availability of glucose and of other carbon sources. Initially, we found that the loss of glucose led to an increase in the level of the SRC-1 protein, but knowing that glucose deprivation leads to cellular changes in cellular ATP levels, in cellular NAD+/NADH ratio, and in modulation of the mitochondrial electron transport chain, the specific metabolic features responsible for eliciting the change in SRC-1 protein levels required further investigation. Thus, cells were cultured in media with fructose, pyruvate, and a panel of metabolic inhibitors to interrogate specific components of the cellular energy metabolic machinery, ultimately pointing to NAD+ as the key metabolite controlling SRC-1 protein stability. The role of SRC-1 in responding to glucose availability is consistent with the phenotype of SRC-1−/− mice because SRC-1 possesses a liver-specific role in the regulation of gluconeogenesis in response to fasting in order to preserve circulating normoglycemia (9). We now show that SRC-1 drives a metabolic program in cancer cells as well. Importantly, although it is known that cancers are more reliant on glucose, under conditions in which glucose availability is limited they can reactivate oxidative phosphorylation (30, 31). Here, we show that SRC-1 can play a critical role in surviving such glucose deprivation by altering the expression of complex I. This implicates SRC-1 in promoting a survival gene expression program upon depletion of glucose, consistent with the role of SRC-1 in promoting cell survival by promoting the expression of Bcl-2 (32).
Although this work is focused on the role of SRC-1 in cancer cell energy metabolism, interesting correlates with normal physiology also exist. For instance, the strong link between SRC-1, complex I, and NAD+/NADH levels is supported by the observation that the SRC-1 mRNA is the most strongly correlated transcript to mitochondrial DNA content from an expression-profiling analysis in a large cohort of human lymphocyte donors (10). Another example is the observation that SRC-1−/− mice possess lower core body temperatures under cold shock and that this observation may be linked to hindered complex I function necessary for uncoupling proteins (8). Finally, from an evolutionary perspective, it is possible that SRC-1 is linked to the challenges early humans faced in acquiring carbohydrates and niacin. For instance, a bioinformatic search for genes suspected to be under strong selective pressure during evolution identified the SRC-1 gene as one of the strongest candidates (33).
In conclusion, our study identifies SRC-1 as responsive to the cellular NAD+/NADH ratio and thereby, controlling complex I, that is the prime consumer of NADH. Such work, focused on identifying the cues to which coactivators are responsive, provides a more comprehensive understanding of the dynamic genomic occupancy and functions of these molecules in physiology and disease.
Acknowledgments
We thank Erin L. Reineke for review of the manuscript.
This project was supported in part by the Genomic and RNA Profiling Core at Baylor College of Medicine with funding from the National Institutes of Health National Cancer Institute grant (P30CA125123) and the expert assistance of Dr. Lisa D. White, PhD. This work was performed with funding from the National Institutes of Health (HD07857, HD08188, and DK59820) (to B.W.O.) and the Alkek Foundation (to C.C.). S.M.H. is supported by NIH 1K01DK096093 with additional funding provided by the Diabetes and Endocrinology Research Center (P30-DK079638) at Baylor College of Medicine.
Disclosure Summary: The authors have nothing to disclose.
Footnotes
- AMPK
- AMP-activated protein kinase
- FCS
- fetal calf serum
- mtDNA
- mitochondrial DNA
- NAD
- nicotinamide adenine dinucleotide
- NADH
- reduced NAD
- NAM
- nicotinamide
- qPCR
- quantitative PCR
- ROS
- reactive oxygen species
- siCntrl
- control siRNA
- siRNA
- small interfering RNA
- SRC
- steroid receptor coactivator.
References
- 1. Cairns RA, Harris IS, Mak TW. Regulation of cancer cell metabolism. Nat Rev Cancer. 2011;11(2):85–95 [DOI] [PubMed] [Google Scholar]
- 2. Cairns RA, Harris I, McCracken S, Mak TW. Cancer cell metabolism. Cold Spring Harb Symp Quant Biol. 2011;76:299–311 [DOI] [PubMed] [Google Scholar]
- 3. Vander Heiden MG, Cantley LC, Thompson CB. Understanding the Warburg effect: the metabolic requirements of cell proliferation. Science. 2009;324(5930):1029–33 [DOI] [PMC free article] [PubMed] [Google Scholar]
- 4. O'Malley BW. Masters of the genome. Nat Rev Mol Cell Biol. 2010;11(5):311. [DOI] [PubMed] [Google Scholar]
- 5. Xu J, Wu RC, O'Malley BW. Normal and cancer-related functions of the p160 steroid receptor co-activator (SRC) family. Nat Rev Cancer. 2009; 9(9):615–30 [DOI] [PMC free article] [PubMed] [Google Scholar]
- 6. York B, Sagen JV, Tsimelzon A, Louet JF, Chopra AR, Reineke EL, et al. Research resource: tissue- and pathway-specific metabolomic profiles of the steroid receptor coactivator (SRC) family. Mol Endocrinol. 2013;27(2):366–80 [DOI] [PMC free article] [PubMed] [Google Scholar]
- 7. York B, Reineke EL, Sagen JV, Nikolai BC, Zhou S, Louet JF, et al. Ablation of steroid receptor coactivator-3 resembles the human CACT metabolic myopathy. Cell Metab. 2012;15(5):752–63 [DOI] [PMC free article] [PubMed] [Google Scholar]
- 8. Picard F, Géhin M, Annicotte J, Rocchi S, Champy MF, O'Malley BW, et al. SRC-1 and TIF2 control energy balance between white and brown adipose tissues. Cell. 2002;111(7):931–41 [DOI] [PubMed] [Google Scholar]
- 9. Louet JF, Chopra AR, Sagen JV, An J, York B, Tannour-Louet M, et al. The coactivator SRC-1 is an essential coordinator of hepatic glucose production. Cell Metab. 2010;12(6):606–18 [DOI] [PMC free article] [PubMed] [Google Scholar]
- 10. Curran JE, Johnson MP, Dyer TD, Göring HH, Kent JW, Charlesworth JC, et al. Genetic determinants of mitochondrial content. Hum Mol Genet. 2007;16(12):1504–1415 [DOI] [PubMed] [Google Scholar]
- 11. Qin L, Chen X, Wu Y, Feng Z, He T, Wang L, et al. Steroid receptor coactivator-1 upregulates integrin α(5) expression to promote breast cancer cell adhesion and migration. Cancer Res. 2011;71(5):1742–1751 [DOI] [PMC free article] [PubMed] [Google Scholar]
- 12. Qin L, Liu Z, Chen H, Xu J. The steroid receptor coactivator-1 regulates twist expression and promotes breast cancer metastasis. Cancer Res. 2009;69(9):3819–3827 [DOI] [PMC free article] [PubMed] [Google Scholar]
- 13. Reineke EL, York B, Stashi E, Chen X, Tsimelzon A, Xu J, et al. SRC-2 coactivator deficiency decreases functional reserve in response to pressure overload of mouse heart. PLoS One. 2012;7(12):e53395. [DOI] [PMC free article] [PubMed] [Google Scholar]
- 14. Hartig SM, He B, Long W, Buehrer BM, Mancini MA. Homeostatic levels of SRC-2 and SRC-3 promote early human adipogenesis. J Cell Biol. 2011;192(1):55–67 [DOI] [PMC free article] [PubMed] [Google Scholar]
- 15. Koshida K, Endo Y, Kobayashi T, Imao T, Konaka H, Kadono Y, et al. Enhanced tumorigenic and metastatic potential of an androgen-sensitive human prostate cancer cell line, LNCaP, by intratesticular inoculation in SCID mice. Int J Oncol. 1997; 11(3):513–9 [DOI] [PubMed] [Google Scholar]
- 16. Rao JS, Gondi C, Chetty C, Chittivelu S, Joseph PA, Lakka SS. Inhibition of invasion, angiogenesis, tumor growth, and metastasis by adenovirus-mediated transfer of antisense uPAR and MMP-9 in non-small cell lung cancer cells. Mol Cancer Ther. 2005;4(9):1399–1408 [DOI] [PMC free article] [PubMed] [Google Scholar]
- 17. Sarnataro D, Pisanti S, Santoro A, Gazzerro P, Malfitano AM, Laezza C, et al. The cannabinoid CB1 receptor antagonist rimonabant (SR141716) inhibits human breast cancer cell proliferation through a lipid raft-mediated mechanism. Mol Pharmacol. 2006;70(4):1298–1306 [DOI] [PubMed] [Google Scholar]
- 18. de Candia P, Minopoli G, Verga V, Gargiulo A, Vanoni M, Alberghina L. Nutritional limitation sensitizes mammalian cells to GSK-3β inhibitors and leads to growth impairment. Am J Pathol. 2011;178(4):1814–1823 [DOI] [PMC free article] [PubMed] [Google Scholar]
- 19. Kang JG, Park SY, Ji S, Jang I, Park S, Kim HS, et al. O-GlcNAc protein modification in cancer cells increases in response to glucose deprivation through glycogen degradation. J Biol Chem. 2009;284(50):34777–34784 [DOI] [PMC free article] [PubMed] [Google Scholar]
- 20. Marambio P, Toro B, Sanhueza C, Troncoso R, Parra V, Verdejo H, et al. Glucose deprivation causes oxidative stress and stimulates aggresome formation and autophagy in cultured cardiac myocytes. Biochim Biophys Acta. 2010;1802(6):509–518 [DOI] [PubMed] [Google Scholar]
- 21. Graham NA, Tahmasian M, Kohli B, Komisopoulou E, Zhu M, Vivanco I, et al. Glucose deprivation activates a metabolic and signaling amplification loop leading to cell death. Mol Syst Biol. 2012;8:589. [DOI] [PMC free article] [PubMed] [Google Scholar]
- 22. Li C, Wu RC, Amazit L, Tsai SY, Tsai MJ, O'Malley BW. Specific amino acid residues in the basic helix-loop-helix domain of SRC-3 are essential for its nuclear localization and proteasome-dependent turnover. Mol Cell Biol. 2007;27(4):1296–1308 [DOI] [PMC free article] [PubMed] [Google Scholar]
- 23. Li S, Shang Y. Regulation of SRC family coactivators by post-translational modifications. Cell Signal. 2007;19(6):1101–1112 [DOI] [PubMed] [Google Scholar]
- 24. Verkhovskaya M, Bloch DA. Energy-converting respiratory Complex I: on the way to the molecular mechanism of the proton pump. Int J Biochem Cell Biol. 2013;45(2):491–511 [DOI] [PubMed] [Google Scholar]
- 25. Austin S, St-Pierre J. PGC1α and mitochondrial metabolism–emerging concepts and relevance in ageing and neurodegenerative disorders. J Cell Sci. 2012;125(Pt 21):4963–4971 [DOI] [PubMed] [Google Scholar]
- 26. Andreux PA, Houtkooper RH, Auwerx J. Pharmacological approaches to restore mitochondrial function. Nat Rev Drug Discov. 2013;12(6):465–483 [DOI] [PMC free article] [PubMed] [Google Scholar]
- 27. Cantó C, Gerhart-Hines Z, Feige JN, Lagouge M, Noriega L, Milne JC, et al. AMPK regulates energy expenditure by modulating NAD+ metabolism and SIRT1 activity. Nature. 2009;458(7241):1056–1060 [DOI] [PMC free article] [PubMed] [Google Scholar]
- 28. Wang Y, Lonard DM, Yu Y, Chow DC, Palzkill TG, O'Malley BW. Small molecule inhibition of the steroid receptor coactivators, SRC-3 and SRC-1. Mol Endocrinol. 2011;25(12):2041–2053 [DOI] [PMC free article] [PubMed] [Google Scholar]
- 29. Johnson AB, O'Malley BW. Steroid receptor coactivators 1, 2, and 3: critical regulators of nuclear receptor activity and steroid receptor modulator (SRM)-based cancer therapy. Mol Cell Endocrinol. 2012;348(2):430–439 [DOI] [PMC free article] [PubMed] [Google Scholar]
- 30. Jose C, Hebert-Chatelain E, Bellance N, Larendra A, Su M, Nouette-Gaulain K, et al. AICAR inhibits cancer cell growth and triggers cell-type distinct effects on OXPHOS biogenesis, oxidative stress and Akt activation. Biochim Biophys Acta. 2011;1807(6):707–718 [DOI] [PubMed] [Google Scholar]
- 31. Schulze A, Downward J. Flicking the Warburg switch-tyrosine phosphorylation of pyruvate dehydrogenase kinase regulates mitochondrial activity in cancer cells. Mol Cell. 2011:44(6):846–848 [DOI] [PubMed] [Google Scholar]
- 32. Karmakar S, Foster EA, Smith CL. Unique roles of p160 coactivators for regulation of breast cancer cell proliferation and estrogen receptor-α transcriptional activity. Endocrinology. 2009;150(4):1588–1596 [DOI] [PMC free article] [PubMed] [Google Scholar]
- 33. Voight BF, Kudaravalli S, Wen X, Pritchard JK. A map of recent positive selection in the human genome. PLoS Biol. 2006;4(3):e72. [DOI] [PMC free article] [PubMed] [Google Scholar]


