

Abstract
The smooth muscle layer of the uterus (ie, myometrium) is critical for a successful pregnancy and labor. We have shown that the conditional deletion of TGFβ type 1 receptor (TGFBR1) in the female reproductive tract leads to remarkable smooth muscle defects. This study was aimed at defining the cellular and molecular basis of the myometrial defects. We found that TGFBR1 is required for myometrial configuration and formation during early postnatal uterine development. Despite the well-established role of TGFβ signaling in vascular smooth muscle cell differentiation, the majority of smooth muscle genes were expressed in Tgfbr1 conditional knockout (cKO) uteri at similar levels as controls during postnatal uterine development, coinciding with the presence but abnormal distribution of proteins for select smooth muscle markers. Importantly, the uteri of these mice had impaired synthesis of key extracellular matrix proteins and dysregulated expression of platelet-derived growth factors. Furthermore, platelet-derived growth factors induced the migration of uterine stromal cells from both control and Tgfbr1 cKO mice in vitro. Our results suggest that the myometrial defects in Tgfbr1 cKO mice may not directly arise from an intrinsic deficiency in uterine smooth muscle cell differentiation but are linked to the impaired production of key extracellular matrix components and abnormal uterine cell migration during a critical time window of postnatal uterine development. These findings will potentially aid in the design of novel therapies for reproductive disorders associated with myometrial defects.
The uterus serves as an incubator of a new life in mammals. It develops from the Müllerian duct, a tube formed via invagination of the coelomic epithelium during embryogenesis (1, 2). Myometrium is composed primarily of smooth muscle cells or myocytes, which contain contractile machinery that is tightly regulated during pregnancy and parturition. The role of the myometrium in pregnancy-associated events has been well established. During pregnancy, the myometrial cells transform from a quiescent to a contractile phenotype. Myometrial contractility is regulated/influenced by hormonal, cellular, and molecular signals (3–10). Structural and functional abnormalities of the myometrium may lead to reproductive disorders, resulting in neonatal mortality and morbidity.
In mice, myometrial development occurs after birth, and the uterus acquires all basic structures and configuration by postnatal day (P) 15 (11, 12). Myometrial maturation continues into adulthood. Notably, mechanisms that control myometrial development are not well understood. Estrogen seems to play a role in regulating the development of circular myometrium (13). Tamoxifen-treated neonatal mice demonstrate disorganized circular myometrium with reduced laminin expression and develop a uterine pathology reminiscent of adenomyosis, which is defined as the presence of endometrium and uterine glands within myometrium (13). However, mice treated with estradiol develop intact but hypertrophied muscle layers (13). Additionally, wingless/integrase-1/β-catenin signaling pathway is known to regulate mouse uterine development (14–17). Wnt-7a mutant female mice develop abnormal oviduct and uterus, and smooth muscle defects were observed in the uterus (14, 17). Despite this knowledge, mechanisms that control the development of morphologically and functionally normal myometrium remain to be elucidated.
TGFβ superfamily signaling regulates essential cellular functions and developmental processes (18). In an early study, we generated a conditional knockout (cKO) of the TGFβ type 1 receptor (Tgfbr1) using Cre recombinase driven by the promoter of anti-Müllerian hormone receptor type 2 (Amhr2), which is expressed in the mesenchymal cells of the oviduct and uterus (19). The Tgfbr1 cKO females are infertile and develop smooth muscle defects in the reproductive tract. Disorganized myometrium is a striking phenotype of the uterus (19). However, the timing of myometrial defects during postnatal uterine development and the underlying mechanisms are not clear.
TGFβ ligands are regulators of smooth muscle cell differentiation in vitro (20, 21). However, little is known about the role of TGFβ signaling in uterine smooth muscle cell differentiation in vivo. Because uterine smooth muscle cell differentiation is a critical step of myometrial development, it is essential to define smooth muscle differentiation in the Tgfbr1 cKO model. Notably, postnatal uterine development involves extensive remodeling of extracellular matrix (ECM) (22, 23), which regulates cellular behavior/properties such as proliferation, differentiation, and migration (24, 25). TGFβ signaling regulates ECM production (26, 27). Of note, basement membranes enclosing smooth muscle cells play key roles in regulating the phenotype and function of these cells (28, 29). It has been shown that basement membranes surrounding mouse uterine smooth muscle cells contain collagen IV (30).
Therefore, in this study, we tested whether differentiation of uterine smooth muscle cells and production of key proteins associated with basement membrane were altered in Tgfbr1 cKO uteri during postnatal uterine development. Our studies focused on a critical time window of postnatal uterine development (ie, P0–15), during which the uterus acquires essential configuration. We herein identified an important role of the TGFBR1 in regulating myometrial configuration and basement membrane component synthesis during postnatal uterine development and provided further mechanistic insights into the myometrial defects in Tgfbr1 conditionally ablated uterus.
Materials and Methods
Ethics statement
Procedures of the mouse manipulation were approved by the Institutional Animal Care and Use Committee at Texas A&M University. Mice were maintained on a C57BL/6/129S6/SvEv genetic background and housed in standard cages under a 12-hour light, 12-hour dark cycle with access to food and water ad libitum. All necessary procedures were taken to minimize the discomfort, distress, and pain of the mice during experiment.
Construction of Tgfbr1 cKO mice
Generation of Tgfbr1 cKO mice using a Cre-loxP strategy was described previously (19). The Amhr2cre allele was kindly provided by Dr Richard Behringer (Department of Genetics, University of Texas MD Anderson Cancer Center, Houston, Texas) (31). A bacterial lacZ gene was inserted into the Tgfbr1 gene to generate a loss of function (ie, a Tgfbr1 null allele). In the Tgfbr1 conditional allele, exon 3 of the Tgfbr1 gene was flanked by two loxP sites as described (32). Genotyping was performed using tail DNAs and PCR (19).
Sample collection and processing
Uterine samples from control and Tgfbr1 cKO mice were collected at P0 (birth), P3, P5, P10, and P15. Adult uterine samples were collected from 3-month-old control and Tgfbr1 cKO mice. The samples were processed for histological analysis, RNA isolation, 5-bromo-4-chloro-3-indolyl-β-D-galactopyranoside (X-gal) staining and immunofluorescence. For periodic acid-Schiff (PAS)-hematoxylin staining and immunofluorescence, uterine samples were fixed in 10% neutral buffered formalin (Sigma) immediately after collection. Samples were then washed with 70% ethanol before being processed for paraffin embedding. For RNA preparation, samples were homogenized in RNA lysis tissue buffer (QIAGEN) and stored at −80°C until isolation. Sample processing for X-gal staining was described below.
Histological assays
All samples were processed and embedded using the Histology Laboratory of Veterinary Integrative Biosciences at Texas A&M University. Uterine tissues were serially sectioned at 5 μm and processed for PAS-hematoxylin staining (33).
RNA isolation, reverse transcription, and quantitative real-time PCR
Total RNA was isolated from uterine samples using an RNeasy minikit (QIAGEN) according to the manufacturer's instructions. On-column deoxyribonuclease (QIAGEN) digestion was incorporated into an RNA isolation procedure to remove potential genomic DNA contamination. RNA concentration and the ratio of the absorbance at 260 and 280 nm were measured using a NanoDrop Spectrophotometer ND 1000 (NanoDrop Technologies). Reverse transcription was carried out using 200 ng total RNA and superscript III (Invitrogen) reverse transcriptase to synthesize the first DNA strand.
Quantitative real-time PCR (qPCR) was performed using a CFX384/CFX Connect real-time PCR detection system (Bio-Rad Laboratories). The PCR program consisted of 95°C for 30 seconds, 40 cycles of 95°C for 5 seconds, and 60°C for 30 seconds. All assays were performed in duplicate using iTaq Universal SYBR Green supermix (Bio-Rad Laboratories) and gene-specific primers (Table 1). Specificity of the amplification was verified by dissociation curve and gel electrophoretic analyses. Ribosomal protein L19 (Rpl19) was used as an internal control. Relative levels of gene expression were calculated using the δδ-cycle threshold method as described (34).
Table 1.
Primers for qPCR
| Name | Sequence (5′-3′) | Reference | |
|---|---|---|---|
| Col4a1 | Forward | CTGGCACAAAAGGGACGAG | PrimerBank ID 33859528a1 |
| Reverse | ACGTGGCCGAGAATTTCACC | ||
| Col4a2 | Forward | GACCGAGTGCGGTTCAAAG | PrimerBank ID 556299a1 |
| Reverse | CGCAGGGCACATCCAACTT | ||
| Col4a3 | Forward | CAAAGGCATCAGGGGAATAACT | PrimerBank ID 145699100c1 |
| Reverse | ACCCTTAGATCCGTTGCATCC | ||
| Col4a4 | Forward | ATGAGGTGCTTTTTCAGATGGAC | PrimerBank ID 34328045a1 |
| Reverse | GGGGCCGCCATACTTCTTG | ||
| Col4a5 | Forward | AGGCGAAATGGGTATGATGGG | PrimerBank ID 26348681a1 |
| Reverse | CTCCCTTACCGCCCTTTTCTC | ||
| Col4a6 | Forward | ATCGGATACTCCTTCCTCATGC | PrimerBank ID 13435918a1 |
| Reverse | CCAGGGGAGACTAGGGACTG | ||
| Fn1 | Forward | GATGTCCGAACAGCTATTTACCA | PrimerBank ID 29835174a1 |
| Reverse | CCTTGCGACTTCAGCCACT | ||
| Lama1 | Forward | CGGGTCTGTGACGGTAACAGT | (70) |
| Reverse | GCCATCGATTGCGTGTGAT | ||
| Lama2 | Forward | GGAAAAAGGACCCGAGATGTACT | (70) |
| Reverse | TGAGGGTTCCTCACAGGCTG | ||
| Lama3 | Forward | TCTTGTAGGGTCTGCCCCTG | (70) |
| Reverse | AGCTCCACCATCCACAGCAC | ||
| Lama4 | Forward | CAGCTGGACGACTACAACGC | (70) |
| Reverse | ATGGTCGAGGGCCTGGTTA | ||
| Lama5 | Forward | CGGATGGGACCTGTGAAGA | (70) |
| Reverse | GCTCTCCTGTGAAGTTCGGC | ||
| Lamb1 | Forward | CCACTGGCGACCTTCTCATC | (70) |
| Reverse | CTGGTTTGTGCAGTCCACATG | ||
| Lamb2 | Forward | GAACTTCGCTTGGGCCTACTT | PrimerBank ID 31982223a1 |
| Reverse | GGTGGCTGGATAGCAGCTT | ||
| Lamb3 | Forward | GGCTGCCTCGAAATTACAACA | PrimerBank ID 6678660a1 |
| Reverse | ACCCTCCATGTCTTGCCAAAG | ||
| Lamc1 | Forward | AAGTCCTGTCACCTGTGCGAC | (70) |
| Reverse | CATAGTCTGGCTTTGCCACCA | ||
| Lamc2 | Forward | CAGACACGGGAGATTGCTACT | PrimerBank ID 19115956a1 |
| Reverse | CCACGTTCCCCAAAGGGAT | ||
| Lamc3 | Forward | CGGAGCCCTGCATCACAAA | PrimerBank ID 6453719a1 |
| Reverse | AGCAAGGTCGTCCTCAAAGC | ||
| Tagln | Forward | CGATGGAAACTACCGTGGAGA | (71) |
| Reverse | TGAAGGCCAATGACGTGCT | ||
| Acta2 | Forward | GTCCCAGACATCAGGGAGTAA | PrimerBank ID 6671507a1 |
| Reverse | TCGGATACTTCAGCGTCAGGA | ||
| Actg2 | Forward | CCGCCCTAGACATCAGGGT | PrimerBank ID 6752952a1 |
| Reverse | TCTTCTGGTGCTACTCGAAGC | ||
| Cnn1 | Forward | GGTGAAACCCCACGACATCTT | (71) |
| Reverse | TTTGTCTTGGCCATGCTGG | ||
| Myh11 | Forward | CATCCTGACCCCACGTATCAA | (71) |
| Reverse | ATCGGAAAAGGCGCTCATAGG | ||
| Des | Forward | TACACCTGCGAGATTGATGCC | (71) |
| Reverse | GCGCAATGTTGTCCTGATAGC | ||
| Smtn | Forward | TCACTACCTTCAGCCATGCCT | (71) |
| Reverse | GCCATTAGCTGCTTCCACTGT | ||
| Myocd | Forward | CCAACACCTTGCCCAGTTATC | (19) |
| Reverse | GGAGCTTGTGCTGCCAAAG | ||
| Tgfb1 | Forward | CTCCCGTGGCTTCTAGTGC | PrimerBank ID 6755775a1 |
| Reverse | GCCTTAGTTTGGACAGGATCTG | ||
| Tgfb2 | Forward | TCGACATGGATCAGTTTATGCG | PrimerBank ID 6678317a1 |
| Reverse | CCCTGGTACTGTTGTAGATGGA | ||
| Tgfb3 | Forward | CAGGCCAGGGTAGTCAGAG | (72) |
| Reverse | ATTTCCAGCCTAGATCCTGCC | ||
| Pdgfa | Forward | GAGGAAGCCGAGATACCCC | PrimerBank ID 6715566a1 |
| Reverse | TGCTGTGGATCTGACTTCGAG | ||
| Pdgfb | Forward | AAGTGTGAGACAATAGTGACCCC | PrimerBank ID 6755010a1 |
| Reverse | CATGGGTGTGCTTAAACTTTCG | ||
| Pdgfc | Forward | GCCAAAGAACGGGGACTCG | PrimerBank ID 10242385a1 |
| Reverse | AGTGACAACTCTCTCATGCCG | ||
| Pdgfd | Forward | TACAGTTGCACTCCCAGGAAT | PrimerBank ID 27229137a1 |
| Reverse | CTTCCAGTTGACAGTTCCGCA | ||
| Rpl19 | Forward | ATGAGTATGCTCAGGCTACAGA | PrimerBank ID 6677773a1 |
| Reverse | GCATTGGCGATTTCATTGGTC | ||
Abbreviation: ID, identification.
X-gal staining
X-gal staining was conducted as described (19). Briefly, mouse uterine samples were fixed in fixation buffer (2% paraformaldehyde; 0.2% glutaraldehyde; and 0.1 M phosphate, pH 7.4) and then rinsed with rinse buffer (0.01% sodium deoxycholate; 0.02% Nonidet P-40; 2 mM MgCl2; and 0.1 M phosphate, pH 7.4). The samples were stained for 16 hours at room temperature in staining buffer (5 mM potassium ferricyanide, 5 mM potassium ferrocyanide, and 1 mg/mL X-gal dissolved in rinse buffer). After staining, the samples were washed with PBS, fixed in 10% neutral buffered formalin, and further processed for paraffin embedding and sectioning. At the final step, the sections were deparaffinized, rehydrated, and counterstained with fast red (Vector Laboratories).
Immunofluorescence, immunohistochemistry, and immunocytochemistry
Paraffin-embedded samples were cut into serial sections (5 μm), which were subsequently deparaffinized in xylene and rehydrated in graded alcohol. The sections were boiled in 10 mM citrate buffer (pH 6.0) for 20 minutes to expose the antigens. After antigen retrieval, sections were briefly washed with Tris-buffered saline and blocked with 3% BSA for 1 hour at room temperature. Primary antibodies (Table 2) were then added and incubated at 4°C overnight. After primary antibody incubation, the sections were washed and incubated with Alexa Fluor 488 or 594 conjugated antirabbit/rat/mouse IgG (Invitrogen). The sections were thoroughly washed before being mounted with ProLong Gold antifade reagent with 4′,6′-diamino-2-phenylindole (Invitrogen). Omission of primary antibodies and replacement of primary antibodies by normal IgGs were used as negative controls. The immunoreactive signals were examined and images were captured using IX47 fluorescence microscope with a digital camera (Olympus). For immunohistochemistry, an Avidin-Biotin-Peroxidase complex method was used after the primary antibody incubation as described (19). The signals were developed and visualized using a diaminobenzidine substrate kit (Vector Laboratories). Then immunostained sections were counterstained with hematoxylin and mounted with Permount (Fisher).
Table 2.
Primary Antibodies for Immunofluorescence
| Name | Manufacturer | Catalog Number | Host | Dilution |
|---|---|---|---|---|
| ACTA2 | Abcam | ab5694 | Rabbit | 1:1000 |
| ACTA2 | Abcam | ab76549 | Mouse | 1:1600 |
| CNN1 | Millipore | 04-589 | Rabbit | 1:500 |
| Vimentin | Cell Signaling | 5741 | Rabbit | 1:200 |
| Collagen IV | Abcam | ab19808 | Rabbit | 1:200 |
| Laminin | Abcam | ab11575 | Rabbit | 1:200 |
| FN1 | Abcam | ab23750 | Rabbit | 1:400 |
| CD31 | Abcam | ab28364 | Rabbit | 1:200 |
| ACTG2 | Abcam | ab155308 | Rabbit | 1:1000 |
| TAGLN | Abcam | ab14106 | Rabbit | 1:1500 |
| KRT8 | DSHB | TROMA-I | Rat | 1:100 |
| FOXA2 | Abcam | ab108422 | Rabbit | 1:250 |
| PR | Thermo Scientific | RB-9017 | Rabbit | 1:500 |
| PDGFRA | Cell Signaling | 3174 | Rabbit | 1:200 |
| PDGFRB | Cell Signaling | 3169 | Rabbit | 1:200 |
Abbreviation: DSHB, Developmental Studies Hybridoma Bank.
Immunocytochemistry was performed using a standard protocol. Briefly, the cells were fixed with 4% paraformaldehyde in PBS for 15 minutes at room temperature and then permeabilized with 0.1% Triton X-100 for 15 minutes. The cells were then washed with PBS, blocked with 10% normal goat serum, and incubated with rabbit anti-calponin 1 antibody (Millipore) overnight. After washing, the cells were incubated with Alexa Fluor 594-conjugated antirabbit IgG (Invitrogen) for 1 hour. The filamentous actin (F-actin) was stained with phalloidin conjugated to Alexa-488 (Invitrogen). The nucleus was labeled with 4′,6′-diamino-2-phenylindole using the ProLong Gold antifade reagent (Invitrogen).
Western blot
Western blot was performed as described (33). Briefly, protein lysates (25 μg) were resolved on 10% Tris gel (Bio-Rad Laboratories) and electroblotted to the polyvinyl difluoride membranes (Bio-Rad Laboratories). The membrane was incubated with rabbit anti-platelet-derived growth factor (PDGF)-AA antibody (1:500; Millipore) and rabbit anti-glyceraldehyde-3-phosphate dehydrogenase (GAPDH) (1:1000; Cell Signaling) in 5% BSA. The secondary antibody was horseradish peroxidase-conjugated donkey antirabbit (1:10 000 in 5% milk; Jackson ImmunoResearch). SuperSignal West Dura chemiluminescent substrate (Pierce) was used to detect the signals according to the manufacturer's instruction. Signals were developed using Kodak Image Station 4000 mm PRO (Kodak). The band intensity for PDGFAA and GAPDH was quantified using ImageJ software (National Institutes of Health, Bethesda, Maryland; 1.47 version) and expressed as a ratio of the intensity of PDGFAA to that of GAPDH to normalize the variation in sample loading.
Mouse uterine smooth muscle cell isolation and culture
Uterine smooth muscle cell isolation was performed according to previously published protocols with slight modifications (10, 35). Uteri from 2- to 3-month-old adult virgin mice were collected and kept in Hanks' buffered salt solution (HBSS) (buffer A; pH 7.4) containing penicillin and streptomycin (Gibco; 100 U/mL) and amphotericin B (Sigma; 2.5 μg/mL). The uterine horns were washed with buffer A without calcium and magnesium (buffer B) and cut into 2- to 3-mm pieces and subject to enzymatic digestion at 37°C with agitation using buffer B containing 1 mg/mL collagenase type II (Sigma), 0.15 mg/mL deoxyribonuclease I (Roche), 1 mg/mL BSA (Sigma), 0.1 mg/mL soybean trypsin inhibitor (Sigma), and 10% fetal bovine serum (FBS; Gibco). After 30 minutes incubation, the digestion mixture was triturated for 3 minutes. Equal volume of buffer C (buffer B plus 10% FBS) was added to the digestion mixture before passing through a cell strainer. The first digestion mixture was discarded to minimize cell debris and damaged cells. The remaining tissues were subject to the above incubation-aspiration procedure five times. The cell suspension from each digestion was kept on ice and combined after the digestion procedure was completed. The combined mixture was centrifuged at 200 × g for 15 minutes, and the cell pellet was collected and resuspended in phenol red-free DMEM (Thermo Scientific) containing 10% FBS, 100 U/mL penicillin/streptomycin, 2.5 μg/mL amphotericin B (Sigma), and 25 mM HEPES (Gibco). The cells were allowed to undergo an additional attachment step to improve the purity of uterine smooth muscle cells as described (10, 35). The cells were cultured at 37°C with 5% CO2.
Mouse uterine stromal cell isolation and culture
Isolation and culture of uterine stromal cells were carried out based on a protocol described elsewhere with slight modifications (36, 37). In brief, uterine horns of adult virgin mice were cleaned of fat, opened longitudinally, cut into 3- to 5-mm pieces, and washed with HBSS without calcium and magnesium containing 100 U/mL penicillin/streptomycin (Gibco). The tissues were then incubated in HBSS without calcium and magnesium that contained 0.5% trypsin (AMRESCO; 100 U/mL) for 1 hour at 4°C, followed by two further incubations for 1 hour at room temperature and 10 minutes at 37°C. The supernatant was discarded and the tissues were washed with HBSS before further digestion using 0.05% collagenase (Sigma) for 45 minutes at 37°C. To disperse the stromal cells, the digestion mixture was vortexed until the supernatant was turbid. The mixture was then passed through a 70-μm cell strainer (Becton, Dickinson, and Company). Cells were collected by centrifugation at 400 × g for 10 minutes and cultured in DMEM-F12 (Lonza) supplemented with 10% FBS and 100 U/mL penicillin/streptomycin. The cells were then seeded in culture dishes and incubated at 37°C with 5% CO2. After 90 minutes incubation, cells were washed with HBSS without calcium and magnesium and cultured in DMEM-F12 supplemented with 10% FBS and 100 U/mL penicillin/streptomycin.
Cell migration assay
Cell migration analysis was performed using a Boyden chamber assay with slight modifications (38). Selection of the dosage of PDGFAA (20 ng/mL) and PDGFBB (20 ng/mL) was based on a preliminary dose-response experiment. Briefly, uterine stromal cells were trypsinized and resuspended in serum-free DMEM medium. DMEM with or without PDGFAA/PDGFBB was loaded onto the lower well of a 48-well chemotaxis chamber (Neuro Probes, Inc). The chamber was fitted with a polycarbonate membrane (8 μm pore size) that was coated with 30 μg/mL of collagen I (R&D Systems). Fifty microliters of uterine stromal cells (∼5 × 10⁴ cells) were added to the upper assay chamber and incubated for 5 hours at 37°C with 5% CO2. The membrane was then immersed in 3% glutaraldehyde solution (Sigma) for 20 minutes before being stained with 0.1% Amido Black (Sigma) for 20 minutes. After staining, the cells that adhered to the top layer of the membrane were removed using a cotton swab. The membrane was then mounted on a glass slide, imaged, and analyzed by densitometry using Quantity One software (Bio-Rad Laboratories). The mean value of the control mice without PDGFs was set to 100%, and the results were expressed as the percentage of the control for PDGF treatment.
Statistical analyses
A one-way ANOVA was conducted to determine the difference among groups. When a significant difference was detected by ANOVA, the difference between means was further defined by a post hoc Dunnett test. Comparison of means between two groups was assessed using Student t test. Data represent mean ± SEM. Statistical significance was defined at P < .05. All statistical analyses were performed using SPSS software (Statistical Package for the Social Sciences; version 21).
Results
TGFBR1 is required for normal myometrial development
Our previous studies demonstrated that TGFBR1 is essential for female reproductive tract integrity and function (19). Conditional knockout of Tgfbr1 in the female reproductive tract using Amhr2-Cre leads to prominent smooth muscle defects in the oviduct and uterus with full penetrance (19). To define a time line of the myometrial defects during postnatal uterine development, we first performed PAS staining to compare myometrial development in Tgfbr1 cKO and control mice at P0, P3, P5, P10, and P15 (Supplemental Figure 1). At P3, three layers of the uterus (ie, inner, middle, and outer layers) were evident by PAS-hematoxylin staining in the controls (Supplemental Figure 1C) (11). Highly organized smooth muscle layers were developmentally formed in the controls (Supplemental Figure 1, A, C, E, G, and I) but not the Tgfbr1 cKO mice (Supplemental Figure 1, B, D, F, H, and J).
To better visualize the myometrial compartment and monitor its development, we performed immunofluorescence using an antibody directed against calponin 1 (CNN1) (Figure 1). At birth (P0), the CNN1 signal intensity was low in the uteri of control and Tgfbr1 cKO mice (Figure 1, A and B). At P3, the prospective circular myometrial layer in the control mice was clearly identified using anti-CNN1 antibodies (Figure 1C). In contrast, CNN1-positive cells were dispersed, and an intact circular myometrial layer was not found in the Tgfbr1 cKO mice (Figure 1D). At P5, a pronounced disruption of the circular myometrial layer was evident in the Tgfbr1 cKO mice compared with the control mice (Figure 1, E and F). Further development of the longitudinal myometrium characterized by smooth muscle bundles was visualized at P10 and P15 in the wild-type uterus (Figure 1, G and I), which is in contrast to the age-matched Tgfbr1 cKO mice whose longitudinal layers were thinner and not well organized into bundles in certain regions at these time points (Figure 1, H and J). Immunofluorescence using additional smooth muscle markers including smooth muscle α-actin (ACTA2), smooth muscle γ-actin (ACTG2), and transgelin (TAGLN) confirmed these findings (data not shown). These data indicate that TGFBR1 is indispensable for proper myometrial development in mice.
Figure 1.

Myometrial defects in Tgfbr1 cKO mice during early uterine development. Localization of CNN1 (green) at P0 (A and B), P3 (C and D), P5 (E and F), P10 (G and H), and P15 (I and J) in control and Tgfbr1 cKO mice. Representative images are shown for each time point (n = 3). Note that at birth (P0), the CNN1 signal intensity was low in the uteri of control and Tgfbr1 cKO mice. CNN1-positive cells emerged at P3, and defects in uterine smooth muscle cell formation occurred as early as P3 examined. CM, circular smooth muscle layer; LM, longitudinal smooth muscle layer. Scale bar, 20 μm.
Uterine glands develop in the Tgfbr1 Amhr2-Cre conditional knockout mice
In contrast to the marked disruption of myometrial development in the Tgfbr1 cKO mice, development of uterine glands seemed to be initiated and progressed similarly as controls during early postnatal development (Figure 2). Immunofluorescence analysis of cytokeratin 8 (KRT8), an epithelial marker, revealed that KRT8 was restricted to uterine luminal epithelium and surface epithelium in both control and Tgfbr1 cKO mice at P5 before uterine gland formation (Figure 2, A and B). At P15, uterine adenogenesis occurred in both control and Tgfbr1 cKO mice (Figure 2, C and D). Forkhead box A2 (FOXA2), a regulator of uterine adenogenesis, was expressed in the glandular epithelium of both Tgfbr1 cKO and controls (Figure 2, E and F). Because progesterone signaling is a key determinant of uterine adenogenesis (39), we examined progesterone receptor (PR) expression and found that the distribution pattern of PR was comparable between control and Tgfbr1 cKO uteri during early uterine development (Figure 2, G and H), which is in agreement with the uterine gland formation in these mice at the early developmental period. However, in contrast to controls in which no uterine glands were found within myometrium (Figure 2C), KRT8-positive uterine glands were detected within the myometrial lesions in Tgfbr1 cKO mice (Figure 2D). Thus, despite the fact that adenogenesis was normally initiated in the Tgfbr1 cKO uteri, further development of uterine glands seemed to be hampered, at least partially due to the incorrect spatial distribution predisposed by the failure of myometrial formation. Collectively, these findings lend support to a cellular basis for the adenomyosis observed in adult Tgfbr1 cKO uteri, where morphologically normal/abnormal uterine glands were intermingled with the myometrium (Supplemental Figure 2).
Figure 2.

Adenogenesis in Tgfbr1 cKO mice. A–D, Localization of KRT8 (green) and ACTA2 (red) in the uteri of control and Tgfbr1 cKO mice at P5 (A and B) and P15 (C and D). Note that KRT8 was restricted to uterine luminal epithelium and surface epithelium before uterine gland formation at P5 and the presence of KRT8-positive uterine glands in the disrupted myometrial layers of Tgfbr1 cKO mice at P15. E and F, Localization of FOXA2 (red) and KRT8 (green) in the uteri of control and Tgfbr1 cKO mice at P15. G and H, Localization of PR (red) and ACTA2 (green) in the uteri of control and Tgfbr1 cKO mice at P15. Representative images are shown for each group (n = 3). LE, luminal epithelium; GE, glandular epithelium; CM, circular smooth muscle layer. Scale bar, 20 μm (A, B, E, and F) and 50 μm (C, D, G, and H).
TGFβ ligand/receptor machinery is expressed during postnatal uterine development
To examine the potential involvement of TGFβ isoforms (TGFB1–3)/receptor signaling, we analyzed their expression during postnatal uterine development. Tgfb1 and Tgfb3 transcript levels were increased after birth and reached a plateau at P5 (Figure 3, A and C). In contrast, Tgfb2 mRNA levels were not elevated but remained constant from P0 to P5 and declined at P15 (Figure 3B). To determine the localization of TGFBR1, the type 1 receptor for TGFB1-3, in the mouse uterus during early myometrial development, we performed X-gal staining of uterine samples containing a Tgfbr1 LacZ allele (ie, Tgfbr1lacZ) in which expression of β-galactosidase is driven by Tgfbr1 promoter (Figure 3, D–H). Although control uterine horns showed no discernible staining, the uteri from Tgfbr1flox/lacZ mice demonstrated strong blue staining (Figure 3E). Histological analysis further revealed that the X-gal staining was more strongly localized to the myometrial cells, with increasing staining intensity from P3 to P15 in this compartment (Figure 3, F–H). Taken together, these results provide evidence that TGFβ signaling may regulate myometrial development through paracrine and/or autocrine actions.
Figure 3.

TGFβ isoforms and TGFBR1 are expressed in the mouse uterus during early uterine development. A–C, Transcript levels of Tgfb1 (A), Tgfb2 (B), and Tgfb3 (C) during postnatal uterine development at P0 (n = 5), P3 (n = 4), P5 (n = 3), P10 (n = 4), and P15 (n = 4). Data are mean ± SEM. *, P < .05 vs P0. D, Schematic representation of Tgfbr1lacZ allele and X-gal staining. E, Gross uteri of control (Ctrl) and Tgfbr1flox/lacZ mice after X-gal staining. Note the dark blue staining in the Tgfbr1flox/lacZ uterus and no discernible staining in controls. F–H, X-gal staining of uterine sections from P3 (F), P5 (G), and P15 (H) mice harboring a Tgfbr1lacZ allele (n = 3–5 for each time point). Dotted red lines indicate myometrium. Dotted yellow line marks the boundary between circular and longitudinal smooth muscle layers. Note that the signals for X-gal staining were increased with the progression of uterine smooth muscle cell differentiation. Ep, epithelium; M, myometrium; LM, longitudinal smooth muscle; CM, circular smooth muscle. Scale bar (20 μm) is representatively shown in panel F. Sections in panels F–H were counterstained with nuclear fast red.
Uterine smooth muscle cells express lineage markers in Tgfbr1 cKO mice
In vitro studies suggest that TGFβ signaling regulates smooth muscle gene expression (40–42). However, it is not clear whether TGFβ signaling is required for uterine smooth muscle cell differentiation in vivo. Therefore, we sought to determine whether deletion of Tgfbr1 in uterine mesenchymal cells affects differentiation of smooth muscle cells during early uterine development. As a first step, we analyzed the expression of a variety of well-established smooth muscle marker genes including Acta2, Actg2, Cnn1, Tagln, desmin (Des), smoothelin (Smtn), and smooth-muscle myosin heavy chain (Myh11) as well as a critical regulator of smooth muscle gene expression, myocardin (Myocd) (43) during postnatal development in wild-type mice using qPCR (Figure 4). Consistent with the initiation and progression of smooth muscle cell differentiation during postnatal uterine development, mRNA levels for all the examined smooth muscle marker genes were increased and reached the highest levels at P10 or P15 (Figure 4, A–G). Interestingly, the transcript abundance for Myocd was increased approximately 2-fold and reached a plateau at P3 (Figure 4H).
Figure 4.

Developmental dynamics of mRNA abundance for smooth muscle markers/regulator during postnatal uterine development and the effect of conditional ablation of Tgfbr1 on smooth muscle gene expression and F-actin cytoskeleton of uterine smooth muscle cells. Transcript levels of Acta2 (A), Actg2 (B), Cnn1 (C), Tagln (D), Des (E), Smtn (F), Myh11 (G), and Myocd (H) in the wild-type uterus during postnatal uterine development at P0 (n = 5), P3 (n = 4), P5 (n = 3), P10 (n = 4), and P15 (n = 4). I, Relative levels of mRNA for smooth muscle genes/regulator in the uteri of control (n = 5) and Tgfbr1 cKO mice (n = 5) at P5. Note that mRNA levels for smooth muscle marker genes reached the highest levels at P10 or P15, and no significant difference was detected between control and Tgfbr1 cKO mice except Tagln, which showed an approximately 30% reduction. Data are mean ± SEM. *, P < .05 vs P0 (A–H) or corresponding controls (I). J–M, F-actin (green) and CNN1 staining (red) of control (J and K) and Tgfbr1 cKO (L and M) smooth muscle cells. The dotted yellow line markers smooth muscle cells. Scale bar, 20 μm.
Next, we examined whether conditional deletion of Tgfbr1 altered the expression of the aforementioned smooth muscle genes. In line with the protein expression of CNN1 (Figure 1), the transcript levels of Cnn1 were not distinguishable between control and Tgfbr1 cKO uteri at P5 (Figure 4I). Except for a decline in Tagln transcript levels, the mRNA abundance of Acta2, Des, Smtn, Myh11, Actg2, and Myocd remained comparable between Tgfbr1 cKO and control mice (Figure 4I). Similar changes of the examined genes were also found at P10 when the expression of majority of the smooth muscle markers reached the highest abundance (data not shown). These results suggest that myometrial defects in Tgfbr1 cKO mice may not directly arise from an intrinsic deficiency in uterine smooth muscle cell differentiation.
To further characterize the cellular property of the uterine smooth muscle cells in vitro, we isolated and cultured mouse uterine myocytes. We were able to enrich uterine smooth muscle cells from wild-type control mice (Figure 4, J and K). In the controls, F-actin was clearly stained and distributed in an organized pattern (Figure 4J), and the identity of smooth muscle cells were confirmed using immunofluorescence staining of CNN1 (Figure 4K) as well as ACTA2 (data not shown). However, the same smooth muscle cell isolation protocol did not efficiently enrich myocytes from Tgfbr1 cKO mice (Figure 4, L and M), potentially due to the disruption of the myometrium within the uterus (ie, myometrial cells were intermingled with endometrium). The myocytes from Tgfbr1 cKO mice seemed to have clearly stained F-actin fibers when cultured in vitro (Figure 4L).
Production of ECM proteins associated with basement membrane is impaired in Tgfbr1 conditionally ablated uterus
The ECM components undergo constant remodeling (ie, synthesis, deposition, and degradation), which is implicated in normal development and diseases (44, 45). To determine the expression pattern of ECM components associated with basement membrane zone, we analyzed the gene expression of type IV collagen (Col4a1, Col4a2, Col4a3, Col4a4, Col4a5, and Col4a6), laminin (Lama1, Lama2, Lama3, Lama4, Lama5, Lamb1, Lamb2, Lamb3, Lamc1, Lamc2, and Lamc3), and fibronectin (Fn1). We found that expression of collagen IV genes in the mouse uterus was developmentally up-regulated after birth and plateaued at P5 (Col4a1 and Col4a2; Figure 5, A and B), P10 (Col4a4, Col4a5, and Col4a6; Figure 5, D–F), or P15 (Col4a3; Figure 5C). The laminin genes were also regulated during development and the transcript levels of most laminin genes (Lama3, Lama4, Lama5, Lamb2, Lamb3, Lamc1, and Lamc2) peaked at P10 (Figure 5, H–J and L–O) and P15 (Lama2 and Lamc3; Figure 5, G and P). Lama1 mRNA levels were close to the detection limit, and thus, Lama1 was excluded from this analysis. In contrast, no significant changes in Lamb1 and Fn1 were found at the examined time points (Figure 5K and Supplemental Figure 3A).
Figure 5.

Temporal changes of collagen IV and laminin mRNA abundance during early postnatal uterine development. Transcript levels of Col4a1 (A), Col4a2 (B), Col4a3 (C), Col4a4 (D), Col4a5 (E), Col4a6 (F), Lama2 (G), Lama3 (H), Lama4 (I), Lama5 (J), Lamb1 (K), Lamb2 (L), Lamb3 (M), Lamc1 (N), Lamc2 (O), and Lamc3 (P) in wild-type uterus during postnatal uterine development at P0 (n = 5), P3 (n = 4), P5 (n = 3), P10 (n = 4), and P15 (n = 4). Note that collagen IV genes were developmentally regulated and plateaued at P5 (Col4a1 and Col4a2), P10 (Col4a4, Col4a5, and Col4a6), or P15 (Col4a3), whereas mRNA expression of majority of laminin genes peaked at P10 and P15. Data are mean ± SEM. *, P < .05 vs P0.
Based on the fact that postnatal uterine development involves extensive ECM remodeling and the role of TGFβ in this process (46, 47), we hypothesized that the production of type IV collagen chains and other ECM components associated with basement membrane is impaired in the Tgfbr1 cKO uteri. To test this hypothesis, we performed qPCR to compare the transcript levels of genes encoding collagen IV, laminin, and fibronectin between control and Tgfbr1 cKO mice at P5 and P10, two critical time points of myometrial formation. Our results showed a reduction of Col4a1, Col4a4, and Col4a5 in the Tgfbr1 cKO mice compared with controls at P5 (Table 3). Analysis of P10 samples revealed the down-regulation of Col4a3, Col4a4, and Col4a5 transcripts in mice with conditionally deleted Tgfbr1 (Table 3). To further examine the subcellular localization and potential alterations of collagen IV protein in Tgfbr1 cKO mice, we performed immunofluorescence and found that collagen IV was strongly associated with microvessels (Figure 6, A, B, E, F, G, H, K, and L). A signal for collagen IV was also detected in the newly formed circular smooth muscle layers in the control mice at P5 (Figure 6, A–F). However, immunofluorescence signals for collagen IV in the disrupted uterine smooth muscle layers of the Tgfbr1 cKO mice were diminished (Figure 6, G–L). Meanwhile, we observed a change in the distribution of endometrial vessels in the Tgfbr1 cKO uteri compared with controls using CD31/platelet endothelial cell adhesion molecule-1 to label endothelial cells within the endometrium (Supplemental Figure 4).
Table 3.
Relative mRNA Levels for Collagen IV Genes in the Uteri of Control and Tgfbr1 cKO Mice at P5 and P10
| Gene | P5 Ctrl (n = 5) Mean ± SEM | P5 cKO (n = 5) Mean ± SEM | P10 Ctrl (n = 5) Mean ± SEM | P10 cKO (n = 3) Mean ± SEM |
|---|---|---|---|---|
| Col4a1 | 1.00 ± 0.03 | 0.81 ± 0.04a | 1.03 ± 0.13 | 0.98 ± 0.16 |
| Col4a2 | 1.12 ± 0.30 | 1.22 ± 0.17 | 1.00 ± 0.05 | 0.73 ± 0.19 |
| Col4a3 | 1.01 ± 0.06 | 0.90 ± 0.13 | 1.01 ± 0.06 | 0.64 ± 0.13a |
| Col4a4 | 1.01 ± 0.08 | 0.82 ± 0.03a | 1.00 ± 0.03 | 0.70 ± 0.03a |
| Col4a5 | 1.01 ± 0.05 | 0.74 ± 0.07a | 1.01 ± 0.08 | 0.66 ± 0.05a |
| Col4a6 | 1.01 ± 0.05 | 1.03 ± 0.04 | 1.01 ± 0.06 | 0.85 ± 0.02 |
Abbreviation: Ctrl, control.
P < .05 vs age-matched controls.
Figure 6.

Conditional ablation of Tgfbr1 reduces expression of collagen IV in the mouse uterus during early uterine development. A–F, Subcellular localization of collagen IV (green; A and B), ACTA2 (red; C and D), and collagen IV and ACTA2 (E and F) in the uteri of control mice at P5. G–L, Subcellular localization of collagen IV (green; G and H), ACTA2 (red; I and J), and collagen IV and ACTA2 (K and L) in the uteri of Tgfbr1 cKO mice at P5. Note the diminished collagen IV immunofluorescence signals in the smooth muscle cells of Tgfbr1 cKO mice (G–L) compared with controls (A–F). Representative images are shown for each group (n = 3). The yellow dotted lines indicate the circular smooth muscle layers developed at P5. CM, circular smooth muscle layer; COL4, collagen IV. Scale bar, 20 μm.
Significant reduction of transcript levels for laminin genes was not detected in the Tgfbr1 cKO mice at P5 or P10 with the exception of Lama2 and Lamc2, the mRNA levels of which were reduced at P10 (data not shown). Because the qPCR was performed using whole uterine tissues that could potentially mask the cell-specific changes of laminin, we further examined laminin protein localization in the uterine tissue sections. Immunofluorescence analyses demonstrated that the predominant sites of laminin expression were microvessels and uterine smooth muscle layers (Supplemental Figure 5, A, B, E, F, G, H, K, and L). Well-organized circular myometrial layers with abundant laminin expression were found in control mice (Supplemental Figure 5A–F). However, disruption of uterine smooth muscle layer formation was accompanied by a reduction of laminin signals in the uterine smooth muscle cells of Tgfbr1 cKO mice (Supplemental Figure 5, G–L). In contrast to the dysregulation of collagen IV and laminin, the expression of FN1 was not distinguishable between control and Tgfbr1 cKO uteri (Supplemental Figure 3, B–F). These data suggest that the compromised synthesis of basement membrane components resulting from conditional deletion of Tgfbr1 may disrupt basement membrane deposition and interfere with myometrial organization/formation.
Altered PDGF expression in Tgfbr1 cKO uteri and the role in uterine stromal cell migration
PDGFs are well-established migratory factors (48, 49). In the Tgfbr1 cKO uteri, we found that the expression of mRNA for Pdgfa and Pdgfb was elevated at the early uterine developmental stage (Figure 7A). Western blot demonstrated the increased expression of PDGFAA in the Tgfbr1 cKO uteri (Figure 7B). To explore the implication of the increased PDGFs in the uterus of Tgfbr1 cKO mice, we first analyzed the PDGF receptor (PDGFRA and PDGFRB) localization during postnatal uterine development. We found that PDGFRA (Figure 7, C–F) and PDGFRB (Figure 7, G–J) were predominantly localized to uterine stromal cells, with no expression in the epithelium. In the myometrial compartment, PDGFRA signals were close to background level, whereas PDGFRB signals were low but detectable (Figure 7, C–J).
Figure 7.
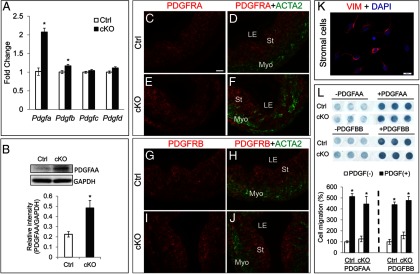
Altered PDGF expression in Tgfbr1 cKO uteri and the role in uterine stromal cell migration. A, Relative mRNA levels for Pdgfa, Pdgfb, Pdgfc, and Pdgfd in the uteri of control and Tgfbr1 cKO mice at P5 (n = 5 per group). Ctrl, control. B, Western blot analysis of PDGFAA protein expression in control and Tgfbr1 cKO mice. Representative images are depicted in the upper panel, and the lower panel shows the relative intensity of PDGFAA, which is expressed as a ratio of the density of PDGFAA to that of GAPDH (n =3 per group). C–F, Subcellular localization of PDGFRA in the uteri of control (C and D) and Tgfbr1 cKO mice (E and F) at P5. G–J, Subcellular localization of PDGFRB in the uteri of control (G and H) and Tgfbr1 cKO mice (I and J) at P5. Representative images of panels C–J are shown for each group (n =3). Note the PDGFRA and PDGFRB signals were strongly present in the stromal cells but absent from the uterine epithelium. LE, luminal epithelium; St, stroma; Myo, myometrium. Scale bar (20 μm) is representatively denoted in panel C. K, Primary uterine stromal cells express vimentin (VIM). Isolated uterine stromal cells were cultured for 24 hours and stained with anti-vimentin antibody. Scale bar, 20 μm. DAPI, 4′,6′-diamino-2-phenylindole. L, PDGFAA and PDGFBB induce uterine stromal cell migration in control and Tgfbr1 cKO mice. Representative images of the Boyden chamber assay are depicted in the upper panel, and the lower panel shows the quantification data from three independent assays. Data are mean ± SEM. *, P < .05 vs corresponding controls.
Based on the cellular distribution of PDGF receptors in the uterus, we postulated that PDGFs regulate/control cell migration during postnatal uterine development. To test this hypothesis, we isolated mouse primary uterine stromal cells, which are positive for vimentin (Figure 7K). Using a Boyden chamber assay, we found that PDGFAA and PDGFBB (20 ng/mL) induced uterine stromal cell migration (P < .05) in both control and Tgfbr1 cKO mice to similar levels, and the migration ability of stromal cells was not altered in the Tgfbr1 cKO mice (Figure 7L). Hence, elevated PDGFs could potentially enhance uterine stromal cell migration via paracrine action in the Tgfbr1 cKO mice during postnatal uterine development.
Discussion
Role of TGFBR1 in myometrial development and pathology
Accumulating evidence demonstrates an obligatory role for TGFβ superfamily signaling in female reproduction (50, 51). TGFβ superfamily members and signaling components including TGFβs (52, 53), activin (54), myostatin (55), and TGFβ receptors and mothers against decapentaplegic (SMADs) (52, 56) are present in the myometrium. TGFβs modulate the rate of DNA synthesis of human myometrial smooth muscle cells (52), whereas activin and myostatin inhibit human myometrial cell growth/proliferation (54, 55). These studies provide circumstantial evidence that TGFβ superfamily signaling is involved in the development and/or function of the myometrium. However, the in vivo function of TGFβ ligands/receptors and their associated signaling cascades in the myometrium are poorly defined.
The essential role of TGFβ signaling in the female reproductive tract was demonstrated by the Tgfbr1 cKO mouse model (19). Conditional deletion of Tgfbr1 in the mesenchymal compartments of female reproductive tract using Amhr2-Cre renders the mice infertile (19). The Tgfbr1 cKO mice are viable and the infertility is not attributed to ovarian dysfunction but caused by the development of oviductal diverticulum (19). Remarkably these mice develop smooth muscle defects in the oviduct and uterus (19). By focusing on a critical time window of postnatal uterine development, we revealed that uterine smooth muscle defects in Tgfbr1 cKO mice occurred during early development. The developmental expression of TGFβ isoforms and the localization of TGFBR1 in the myometrial cells provided further evidence supporting the involvement of TGFβ signaling in the myometrium. Although we believe that the myometrial defects and alteration of basement membrane components were primarily caused by loss of TGFBR1 in uterine smooth muscle cells, our results did not rule out the potential contribution of the Amhr2-Cre expression in endometrial stromal cells to the observed phenotype/molecular alterations.
In contrast to the myometrial disruption, the development of uterine glands seemed to be initiated and progressed normally during early uterine development in the Tgfbr1 cKO mice. However, adult Tgfbr1 cKO myometrium showed reduced continuity and the presence of endometrium and uterine glands within the myometrium, resembling the adenomyosis observed in mice exposed to tamoxifen, an estrogen receptor antagonist, during the neonatal period (13, 57). The incorrect spatial localization of uterine glands during adenogenesis owing to the myometrial lesions supports the emerging concept that myometrial defects may contribute to the etiology of uterine adenomyosis (13). Of note, aged Tgfbr1 cKO mice demonstrate glandular defects in the uterus (19), which was potentially secondary to the disruption of uterine smooth muscle development and/or altered uterine mesenchymal-epithelial interaction.
Implication of TGFβ signaling in uterine smooth muscle differentiation, basement membrane protein synthesis, and myometrial integrity
In mice, uterine mesenchymal cells remain randomly oriented and undifferentiated until after birth. Between birth and P3, myometrial layers are differentiated from the mesenchyme (11), marking the beginning of myometrial development. Formation of the circular myometrial layer precedes that of the longitudinal layer and is evident by P5. The essential structure of myometrium is well developed by P15 (11). It has been reported that TGFβ signaling regulates the in vivo differentiation of vascular smooth muscle (58). To determine whether conditional deletion of Tgfbr1 affected uterine smooth muscle cell differentiation, we examined transcript levels of a number of known smooth muscle genes and regulator in Tgfbr1 cKO uteri. Surprisingly, mRNA levels of most examined genes were comparable between control and Tgfbr1 cKO uteri at P5 and P10, two critical time points of myometrial development. However, Tagln mRNA levels were reduced (∼30%) in the Tgfbr1 cKO mice at P5 but not P15 (data not shown). TAGLN and ACTG2 seem to be more specific markers for smooth muscle than ACTA2, which is also expressed in nonsmooth muscle cells and myofibroblast-like cells (59, 60). However, Tagln knockout mice are viable and fertile (61). Although the role of TAGLN remains to be identified, it is tempting to speculate that reduced tagln may be associated with delayed/reduced myofibroblast differentiation. Furthermore, the cytoskeleton of uterine smooth muscle cells seems to be intact in the Tgfbr1 cKO mice. Altogether, our data suggest that the myometrial defects may not directly arise from an intrinsic deficiency in uterine smooth muscle cell differentiation.
ECM components undergo constant remodeling and regulate smooth muscle development via influencing essential cellular functions (44, 45). Collagen IV and laminin are critically involved in smooth muscle cell differentiation (62, 63). Regulation of smooth muscle cell phenotype by basement membrane components has been reported (28, 64). Based on these findings, we asked whether the myometrial defects in Tgfbr1 cKO mice were associated with dysregulation of ECM proteins, especially basement membrane components.
It has been known that vascular smooth muscle cells are enclosed with basement membranes that regulate their functions (28, 29). However, the formation, regulation, and function of basement membranes of uterine smooth muscle cells within the myometrium are not well defined, despite the evidence that mouse uterine smooth muscle cells express several collagen genes (30). The finding of reduced synthesis of collagen IV and laminin in Tgfbr1 cKO mice during early uterine development suggests a potential defect in basement membrane deposition. Of note, loss of Smad4 causes altered basement membrane deposition during early development in mice (65). Our findings support the notion that smooth muscle cells regulate the development of their basement membranes (66). On the other hand, the altered production of key basement membrane proteins may profoundly affect uterine smooth muscle differentiation (eg, timing) and myometrial structural development. Understanding the dynamics of the basement membrane protein synthesis and the role in regulating cell fate and function during postnatal uterine development remains one of our future goals.
PDGFs as potential regulators of uterine development
Further efforts toward exploring additional mechanisms underlying the developmental failure of the myometrium in Tgfbr1 cKO mice identified PDGF signaling as a potentially important contributing factor. PDGFs are known migratory regulators for cells including endometrial stromal cells and vascular smooth muscle cells (48, 49). The increased expression of PDGFs in the Tgfbr1 cKO mice is a manifestation of a potentially indirect effect of loss of TGFBR1 in the uterus because induction of PDGFs by TGFβ1 in vitro was reported (67). Interestingly, PDGFAA and PDGFBB promoted the migration of uterine stromal cells from both control and Tgfbr1 cKO mice, consistent with the expression of PDGF receptors by these cells. Although stromal cells isolated from Tgfbr1 cKO and control mice migrated identically in response to PDGFs, elevated PDGFs could potentially enhance cell migration via paracrine action in vivo. Indeed, both Pdgfa and Pdgfb mRNAs were expressed by uterine stromal cells and smooth muscle cells (Gao Y, unpublished observations). Furthermore, the altered PDGFs may also affect uterine vasculature because PDGFs are known to regulate angiogenesis and vascular stabilization (68, 69). Collectively, the deficient production of extracellular matrix components and abnormal uterine cell migration may contribute to the disrupted myometrial formation in Tgfbr1 cKO mice during postnatal uterine development.
In summary, this study identified an important role of TGFBR1 in regulating myometrial configuration and synthesis of basement membrane components during early postnatal uterine development, highlighting TGFBR1 as an essential regulator of myometrial development.
Additional material
Supplementary data supplied by authors.
Acknowledgments
We thank Dr Martin Matzuk for helping import the Tgfbr1 mice. We also thank Robert Bearden and Dr Jörg Steiner for providing the respective technical support and equipment for cell migration analysis.
This work was supported by the National Institutes of Health Grant R21HD073756 (to Q.L.) from the Eunice Kennedy Shriver National Institute of Child Health and Human Development; the Ralph E. Powe Junior Faculty Enhancement Awards (to Q.L.) from Oak Ridge Associated Universities; and the New Faculty Start-up Funds (to Q.L.) from Texas A&M University. Y.G. is also partially supported by a Texas A&M College of Veterinary Medicine graduate student research award.
Disclosure Summary: The authors have nothing to disclose.
Footnotes
- ACTA2
- smooth muscle α-actin
- ACTG2
- smooth muscle γ-actin
- Amhr2
- anti-Müllerian hormone receptor type 2
- cKO
- conditional knockout
- CNN1
- calponin 1
- ECM
- extracellular matrix
- F-actin
- filamentous actin
- FBS
- fetal bovine serum
- FN1
- fibronectin
- FOXA2
- Forkhead box A2
- GAPDH
- glyceraldehyde-3-phosphate dehydrogenase
- HBSS
- Hanks' buffered salt solution
- KRT8
- cytokeratin 8
- P
- postnatal day
- PAS
- periodic acid-Schiff
- PDGF
- platelet-derived growth factor
- PR
- progesterone receptor
- qPCR
- quantitative real-time PCR
- TAGLN
- transgelin
- TGFBR1
- TGFβ type 1 receptor
- X-gal
- 5-bromo-4-chloro-3-indolyl-β-D-galactopyranoside.
References
- 1. Orvis GD, Behringer RR. Cellular mechanisms of Mullerian duct formation in the mouse. Dev Biol. 2007;306:493–504. [DOI] [PMC free article] [PubMed] [Google Scholar]
- 2. Spencer TE, Dunlap KA, Filant J. Comparative developmental biology of the uterus: insights into mechanisms and developmental disruption. Mol Cell Endocrinol. 2012;354:34–53. [DOI] [PubMed] [Google Scholar]
- 3. Mesiano S, Chan EC, Fitter JT, Kwek K, Yeo G, Smith R. Progesterone withdrawal and estrogen activation in human parturition are coordinated by progesterone receptor A expression in the myometrium. J Clin Endocrinol Metab. 2002;87:2924–2930. [DOI] [PubMed] [Google Scholar]
- 4. Condon JC, Jeyasuria P, Faust JM, Wilson JW, Mendelson CR. A decline in the levels of progesterone receptor coactivators in the pregnant uterus at term may antagonize progesterone receptor function and contribute to the initiation of parturition. Proc Natl Acad Sci USA. 2003;100:9518–9523. [DOI] [PMC free article] [PubMed] [Google Scholar]
- 5. Brainard AM, Miller AJ, Martens JR, England SK. Maxi-K channels localize to caveolae in human myometrium: a role for an actin-channel-caveolin complex in the regulation of myometrial smooth muscle K+ current. Am J Physiol Cell Physiol. 2005;289:C49–C57. [DOI] [PubMed] [Google Scholar]
- 6. Brainard AM, Korovkina VP, England SK. Potassium channels and uterine function. Semin Cell Dev Biol. 2007;18:332–339. [DOI] [PMC free article] [PubMed] [Google Scholar]
- 7. Yallampalli C, Dong YL. Estradiol-17β inhibits nitric oxide synthase (NOS)-II and stimulates NOS-III gene expression in the rat uterus. Biol Reprod. 2000;63:34–41. [DOI] [PubMed] [Google Scholar]
- 8. Yallampalli C, Garfield RE, Byam-Smith M. Nitric oxide inhibits uterine contractility during pregnancy but not during delivery. Endocrinology. 1993;133:1899–1902. [DOI] [PubMed] [Google Scholar]
- 9. Tong D, Lu X, Wang HX, et al. A dominant loss-of-function GJA1 (Cx43) mutant impairs parturition in the mouse. Biol Reprod. 2009;80:1099–1106. [DOI] [PMC free article] [PubMed] [Google Scholar]
- 10. Renthal NE, Chen CC, Williams KC, Gerard RD, Prange-Kiel J, Mendelson CR. miR-200 family and targets, ZEB1 and ZEB2, modulate uterine quiescence and contractility during pregnancy and labor. Proc Natl Acad Sci USA. 2010;107:20828–20833. [DOI] [PMC free article] [PubMed] [Google Scholar]
- 11. Brody JR, Cunha GR. Histologic, morphometric, and immunocytochemical analysis of myometrial development in rats and mice: I. Normal development. Am J Anat. 1989;186:1–20. [DOI] [PubMed] [Google Scholar]
- 12. Brody JR, Cunha GR. Histologic, morphometric, and immunocytochemical analysis of myometrial development in rats and mice: II. Effects of DES on development. Am J Anat. 1989;186:21–42. [DOI] [PubMed] [Google Scholar]
- 13. Mehasseb MK, Bell SC, Habiba MA. The effects of tamoxifen and estradiol on myometrial differentiation and organization during early uterine development in the CD1 mouse. Reproduction. 2009;138:341–350. [DOI] [PubMed] [Google Scholar]
- 14. Miller C, Sassoon DA. Wnt-7a maintains appropriate uterine patterning during the development of the mouse female reproductive tract. Development. 1998;125:3201–3211. [DOI] [PubMed] [Google Scholar]
- 15. Wang Y, Jia Y, Franken P, et al. Loss of APC function in mesenchymal cells surrounding the Mullerian duct leads to myometrial defects in adult mice. Mol Cell Endocrinol. 2011;341:48–54. [DOI] [PubMed] [Google Scholar]
- 16. Arango NA, Szotek PP, Manganaro TF, Oliva E, Donahoe PK, Teixeira J. Conditional deletion of β-catenin in the mesenchyme of the developing mouse uterus results in a switch to adipogenesis in the myometrium. Dev Biol. 2005;288:276–283. [DOI] [PubMed] [Google Scholar]
- 17. Parr BA, McMahon AP. Sexually dimorphic development of the mammalian reproductive tract requires Wnt-7a. Nature. 1998;395:707–710. [DOI] [PubMed] [Google Scholar]
- 18. Massague J. The transforming growth-factor-β family. Annu Rev Cell Biol. 1990;6:597–641. [DOI] [PubMed] [Google Scholar]
- 19. Li Q, Agno JE, Edson MA, Nagaraja AK, Nagashima T, Matzuk MM. Transforming growth factor beta receptor type 1 is essential for female reproductive tract integrity and function. PLoS Genet. 2011;7:e1002320. [DOI] [PMC free article] [PubMed] [Google Scholar]
- 20. King KE, Iyemere VP, Weissberg PL, Shanahan CM. Kruppel-like factor 4 (KLF4/GKLF) is a target of bone morphogenetic proteins and transforming growth factor β1 in the regulation of vascular smooth muscle cell phenotype. J Biol Chem. 2003;278:11661–11669. [DOI] [PubMed] [Google Scholar]
- 21. Kennard S, Liu H, Lilly B. Transforming growth factor-β (TGF-β1) down-regulates Notch3 in fibroblasts to promote smooth muscle gene expression. J Biol Chem. 2008;283:1324–1333. [DOI] [PubMed] [Google Scholar]
- 22. Hu J, Gray CA, Spencer TE. Gene expression profiling of neonatal mouse uterine development. Biol Reprod. 2004;70:1870–1876. [DOI] [PubMed] [Google Scholar]
- 23. Hu J, Zhang X, Nothnick WB, Spencer TE. Matrix metalloproteinases and their tissue inhibitors in the developing neonatal mouse uterus. Biol Reprod. 2004;71:1598–1604. [DOI] [PubMed] [Google Scholar]
- 24. Sage EH. Regulation of interactions between cells and extracellular matrix: a command performance on several stages. J Clin Invest. 2001;107:781–783. [DOI] [PMC free article] [PubMed] [Google Scholar]
- 25. Hynes RO. The extracellular matrix: not just pretty fibrils. Science. 2009;326:1216–1219. [DOI] [PMC free article] [PubMed] [Google Scholar]
- 26. Zode GS, Sethi A, Brun-Zinkernagel AM, Chang IF, Clark AF, Wordinger RJ. Transforming growth factor-β2 increases extracellular matrix proteins in optic nerve head cells via activation of the Smad signaling pathway. Mol Vis. 2011;17:1745–1758. [PMC free article] [PubMed] [Google Scholar]
- 27. Busnadiego O, Gonzalez-Santamaria J, Lagares D, et al. LOXL4 is induced by TGF-β1 through Smad and JunB/Fra2 and contributes to vascular matrix remodeling. Mol Cell Biol. 2013;33:2388–2401. [DOI] [PMC free article] [PubMed] [Google Scholar]
- 28. Hedin U, Roy J, Tran PK, Lundmark K, Rahman A. Control of smooth muscle cell proliferation—the role of the basement membrane. Thromb Haemost. 1999;82(suppl 1):23–26. [PubMed] [Google Scholar]
- 29. Thyberg J, Hedin U, Sjolund M, Palmberg L, Bottger BA. Regulation of differentiated properties and proliferation of arterial smooth-muscle cells. Arteriosclerosis. 1990;10:966–990. [DOI] [PubMed] [Google Scholar]
- 30. Seki T, Naito I, Oohashi T, Sado Y, Ninomiya Y. Differential expression of type IV collagen isoforms, α5(IV) and α6(IV) chains, in basement membranes surrounding smooth muscle cells. Histochem Cell Biol. 1998;110:359–366. [DOI] [PubMed] [Google Scholar]
- 31. Jamin SP, Arango NA, Mishina Y, Hanks MC, Behringer RR. Requirement of Bmpr1a for Mullerian duct regression during male sexual development. Nat Genet. 2002;32:408–410. [DOI] [PubMed] [Google Scholar]
- 32. Larsson J, Goumans MJ, Sjostrand LJ, et al. Abnormal angiogenesis but intact hematopoietic potential in TGF-β type I receptor-deficient mice. EMBO J. 2001;20:1663–1673. [DOI] [PMC free article] [PubMed] [Google Scholar]
- 33. Li Q, Pangas SA, Jorgez CJ, Graff JM, Weinstein M, Matzuk MM. Redundant roles of SMAD2 and SMAD3 in ovarian granulosa cells in vivo. Mol Cell Biol. 2008;28:7001–7011. [DOI] [PMC free article] [PubMed] [Google Scholar]
- 34. Livak KJ, Schmittgen TD. Analysis of relative gene expression data using real-time quantitative PCR and the 2[−δδ C(T)] method. Methods. 2001;25:402–408. [DOI] [PubMed] [Google Scholar]
- 35. Shynlova OP, Oldenhof AD, Liu MY, Langille L, Lye SJ. Regulation of c-fos expression by static stretch in rat myometrial smooth muscle cells. Am J Obstet Gynecol. 2002;186:1358–1365. [DOI] [PubMed] [Google Scholar]
- 36. Daikoku T, Tranguch S, Friedman DB, Das SK, Smith DF, Dey SK. Proteomic analysis identifies immunophilin FK506 binding protein 4 (FKBP52) as a downstream target of Hoxa10 in the periimplantation mouse uterus. Mol Endocrinol. 2005;19:683–697. [DOI] [PubMed] [Google Scholar]
- 37. Chen L, Belton RJ, Nowak RA. Basigin-mediated gene expression changes in mouse uterine stromal cells during implantation. Endocrinology. 2009;150:966–976. [DOI] [PMC free article] [PubMed] [Google Scholar]
- 38. Lee M, Rodansky ES, Smith JK, Rodgers GM. ADAMTS13 promotes angiogenesis and modulates VEGF-induced angiogenesis. Microvasc Res. 2012;84:109–115. [DOI] [PubMed] [Google Scholar]
- 39. Filant J, Zhou HJ, Spencer TE. Progesterone inhibits uterine gland development in the neonatal mouse uterus. Biol Reprod. 2012;86:1–9. [DOI] [PMC free article] [PubMed] [Google Scholar]
- 40. Sohni A, Mulas F, Ferrazzi F, et al. TGFβ1-induced Baf60c regulates both smooth muscle cell commitment and quiescence. PloS One. 2012;7:e47629. [DOI] [PMC free article] [PubMed] [Google Scholar]
- 41. Deaton RA, Su C, Valencia TG, Grant SR. Transforming growth factor-β1-induced expression of smooth muscle marker genes involves activation of PKN and p38 MAPK. J Biol Chem. 2005;280:31172–31181. [DOI] [PubMed] [Google Scholar]
- 42. Elberg G, Chen L, Elberg D, Chan MD, Logan CJ, Turman MA. MKL1 mediates TGF-β1-induced α-smooth muscle actin expression in human renal epithelial cells. Am J Physiol Renal Physiol. 2008;294:F1116–F1128. [DOI] [PubMed] [Google Scholar]
- 43. Wang ZG, Wang DZ, Pipes GCT, Olson EN. Myocardin is a master regulator of smooth muscle gene expression. Proc Natl Acad Sci USA. 2003;100:7129–7134. [DOI] [PMC free article] [PubMed] [Google Scholar]
- 44. Schedin P, Keely PJ. Mammary gland ECM remodeling, stiffness, and mechanosignaling in normal development and tumor progression. Cold Spring Harb Perspect Biol. 2011;3:a003228. [DOI] [PMC free article] [PubMed] [Google Scholar]
- 45. Lu P, Takai K, Weaver VM, Werb Z. Extracellular matrix degradation and remodeling in development and disease. Cold Spring Harb Perspect Biol. 2011;3:a005058. [DOI] [PMC free article] [PubMed] [Google Scholar]
- 46. Luo X, Ding L, Xu J, Chegini N. Gene expression profiling of leiomyoma and myometrial smooth muscle cells in response to transforming growth factor-β. Endocrinology. 2005;146:1097–1118. [DOI] [PubMed] [Google Scholar]
- 47. Ma C, Chegini N. Regulation of matrix metalloproteinases (MMPs) and their tissue inhibitors in human myometrial smooth muscle cells by TGF-β1. Mol Hum Reprod. 1999;5:950–954. [DOI] [PubMed] [Google Scholar]
- 48. Schwenke M, Knofler M, Velicky P, et al. Control of human endometrial stromal cell motility by PDGF-BB, HB-EGF and trophoblast-secreted factors. PLoS One. 2013;8:e54336. [DOI] [PMC free article] [PubMed] [Google Scholar]
- 49. Hughes AD, Clunn GF, Refson J, Demoliou-Mason C. Platelet-derived growth factor (PDGF): actions and mechanisms in vascular smooth muscle. Gen Pharmacol. 1996;27:1079–1089. [DOI] [PubMed] [Google Scholar]
- 50. Juengel JL, McNatty KP. The role of proteins of the transforming growth factor-β superfamily in the intraovarian regulation of follicular development. Hum Reprod Update. 2005;11:144–161. [DOI] [PubMed] [Google Scholar]
- 51. Edson MA, Nagaraja AK, Matzuk MM. The mammalian ovary from genesis to revelation. Endocr Rev. 2009;30:624–712. [DOI] [PMC free article] [PubMed] [Google Scholar]
- 52. Tang XM, Dou Q, Zhao Y, McLean F, Davis J, Chegini N. The expression of transforming growth factor-βs and TGF-β receptor mRNA and protein and the effect of TGF-βs on human myometrial smooth muscle cells in vitro. Mol Hum Reprod. 1997;3:233–240. [DOI] [PubMed] [Google Scholar]
- 53. Das SK, Flanders KC, Andrews GK, Dey SK. Expression of transforming growth factor-β isoforms (β2 and β3) in the mouse uterus: analysis of the periimplantation period and effects of ovarian steroids. Endocrinology. 1992;130:3459–3466. [DOI] [PubMed] [Google Scholar]
- 54. Ciarmela P, Wiater E, Vale W. Activin-A in myometrium: characterization of the actions on myometrial cells. Endocrinology. 2008;149:2506–2516. [DOI] [PMC free article] [PubMed] [Google Scholar]
- 55. Ciarmela P, Wiater E, Smith SM, Vale W. Presence, actions, and regulation of myostatin in rat uterus and myometrial cells. Endocrinology. 2009;150:906–914. [DOI] [PMC free article] [PubMed] [Google Scholar]
- 56. Chegini N, Luo X, Ding L, Ripley D. The expression of Smads and transforming growth factor β receptors in leiomyoma and myometrium and the effect of gonadotropin releasing hormone analogue therapy. Mol Cell Endocrinol. 2003;209:9–16. [DOI] [PubMed] [Google Scholar]
- 57. Green AR, Styles JA, Parrott EL, et al. Neonatal tamoxifen treatment of mice leads to adenomyosis but not uterine cancer. Exp Toxicol Pathol. 2005;56:255–263. [DOI] [PubMed] [Google Scholar]
- 58. Grainger DJ, Metcalfe JC, Grace AA, Mosedale DE. Transforming growth factor-β dynamically regulates vascular smooth muscle differentiation in vivo. J Cell Sci. 1998;111:2977–2988. [DOI] [PubMed] [Google Scholar]
- 59. Darby I, Skalli O, Gabbiani G. α-Smooth muscle actins transiently expressed by myofibroblasts during experimental wound healing. Lab Invest. 1990;63:21–29. [PubMed] [Google Scholar]
- 60. Qian J, Lessard JL. Tissue and developmental specific expression of murine smooth-muscle γ-actin (Smga) fusion genes in transgenic mice. Mol Biol Cell. 1995;6:2427–2427. [DOI] [PubMed] [Google Scholar]
- 61. Zhang JCL, Kim S, Helmke BP, et al. Analysis of SM22 α-deficient mice reveals unanticipated insights into smooth muscle cell differentiation and function. Mol Cell Biol. 2001;21:1336–1344. [DOI] [PMC free article] [PubMed] [Google Scholar]
- 62. Xiao QZ, Zeng LF, Zhang ZY, Hu YH, Xu QB. Stem cell-derived Sca-1(+) progenitors differentiate into smooth muscle cells, which is mediated by collagen IV-integrin α(1)/β(1)/α(v) and PDGF receptor pathways. Am J Physiol Cell Physiol. 2007;292:C342–C352. [DOI] [PubMed] [Google Scholar]
- 63. Suzuki S, Narita Y, Yamawaki A, et al. Effects of extracellular matrix on differentiation of human bone marrow-derived mesenchymal stem cells into smooth muscle cell lineage: utility for cardiovascular tissue engineering. Cells Tissues Organs. 2010;191:269–280. [DOI] [PubMed] [Google Scholar]
- 64. Thyberg J, Hultgardh-Nilsson A. Fibronectin and the basement membrane components laminin and collagen type IV influence the phenotypic properties of subcultured rat aortic smooth muscle cells differently. Cell Tissue Res. 1994;276:263–271. [DOI] [PubMed] [Google Scholar]
- 65. Costello I, Biondi CA, Taylor JM, Bikoff EK, Robertson EJ. Smad4-dependent pathways control basement membrane deposition and endodermal cell migration at early stages of mouse development. BMC Dev Biol. 2009;9:54. [DOI] [PMC free article] [PubMed] [Google Scholar]
- 66. Nishinaka K, Fukuda Y. Changes in extracellular-matrix materials in the uterine myometrium of rats during pregnancy and postparturition. Acta Pathol Jpn. 1991;41:122–132. [DOI] [PubMed] [Google Scholar]
- 67. Battegay EJ, Raines EW, Seifert RA, Bowenpope DF, Ross R. Tgf-β induces bimodal proliferation of connective-tissue cells via complex control of an autocrine Pdgf loop. Cell. 1990;63:515–524. [DOI] [PubMed] [Google Scholar]
- 68. Marx M, Perlmutter RA, Madri JA. Modulation of platelet-derived growth-factor receptor expression in microvascular endothelial cells during in vitro angiogenesis. J Clin Invest. 1994;93:131–139. [DOI] [PMC free article] [PubMed] [Google Scholar]
- 69. Gaengel K, Genove G, Armulik A, Betsholtz C. Endothelial-mural cell signaling in vascular development and angiogenesis. Arterioscler Thromb Vasc Biol. 2009;29:630–638. [DOI] [PubMed] [Google Scholar]
- 70. Dixelius J, Jakobsson L, Genersch E, Bohman S, Ekblom P, Claesson-Welsh L. Laminin-1 promotes angiogenesis in synergy with fibroblast growth factor by distinct regulation of the gene and protein expression profile in endothelial cells. J Biol Chem. 2004;279:23766–23772. [DOI] [PubMed] [Google Scholar]
- 71. Nagaraja AK, Andreu-Vieyra C, Franco HL, et al. Deletion of Dicer in somatic cells of the female reproductive tract causes sterility. Mol Endocrinol. 2008;22:2336–2352. [DOI] [PMC free article] [PubMed] [Google Scholar]
- 72. Frank KM, Zhou T, Moreno-Vinasco L, Hollett B, Garcia JGN, Wardenburg JB. Host response signature to staphylococcus aureus α-hemolysin implicates pulmonary Th17 response. Infect Immun. 2012;80:3161–3169. [DOI] [PMC free article] [PubMed] [Google Scholar]
Associated Data
This section collects any data citations, data availability statements, or supplementary materials included in this article.