

Abstract
PRKAR1A is the gene encoding the type 1A regulatory subunit of protein kinase A, and it is the cause of the inherited human tumor syndrome Carney complex. Data from our laboratory has demonstrated that Prkar1a loss causes tumors in multiple cell lineages, including neural crest cells and osteoblasts. We have proposed that one mechanism by which tumorigenesis occurs is through the failure of terminal differentiation. In the present study, we directly test the effects of Prkar1a reduction on osteogenic differentiation in mouse and human cells in vitro. We found that Prkar1a levels noticeably increased during osteoblastic differentiation, indicating a positive correlation between the expression of Prkar1a and osteogenic potential. To validate this hypothesis, we generated stable Prkar1a knockdown in both mouse and human cells. These cells displayed significantly suppressed bone nodule formation and decreased expression of osteoblast markers such as osteocalcin and osteopontin. These observations imply that the antiosteogenic effect of Prkar1a ablation is not species or cell line specific. Furthermore, because Runt-related transcription factor-2 (Runx2) is a key mediator of osteoblast differentiation, we reasoned that the function of this transcription factor may be inhibited by Prkar1a knockdown. Chromatin immunoprecipitation and luciferase assays demonstrated that Prkar1a ablation repressed DNA binding and function of Runx2 at its target genes. Additionally, we determined that this effect is likely due to reductions in the Runx2-cooperating transcription factors forkhead box O1 and activating transcription factor 4. Taken together, this study provides direct evidence that ablation of Prkar1a interferes with signaling pathways necessary for osteoblast differentiation.
The maturation, growth, and remodeling of bones are maintained through a balance between the activities of bone-forming osteoblasts and bone-resorbing osteoclasts. Studies in recent years have witnessed tremendous progress in the understanding of osteoblasts. Osteoblast differentiation is regulated by a series of transcription factors, growth hormones, and cytokines (1). Several transcription factors such as Runt-related transcription factor-2 (Runx2) and Osterix have been identified as key regulators behind the establishment and maintenance of the osteoblastic phenotype. Blocks to normal differentiation lead to diseases such as osteoporosis and osteosarcoma (2).
PRKAR1A is the gene encoding the type 1A regulatory subunit of protein kinase A (PKA), and it is the cause of the inherited human tumor syndrome Carney complex (CNC, Online Mendelian Inheritance in Man #160980). CNC is an autosomal dominant neoplasia syndrome characterized by spotty skin pigmentation, generalized myxomatosis, schwannomas, and endocrine tumors (3). Although not a common manifestation, bone tumors are also observed in CNC and have been characterized as osteochondromyxomas (4). At the biochemical level, loss of this regulatory subunit of PKA leads to enhanced PKA activity in all systems studied (5–7). In our previous studies, we reported that Prkar1a+/− mice (the genetic model for human patients) develop tumors in multiple cell lineages, including neural crest cells and osteoblasts (8, 9). Based on the failure of Prkar1a knockout neural crest cells to undergo intramembranous ossification (8, 9), we proposed that defective terminal differentiation might underlie the phenotype caused by this genetic manipulation. Others also showed that increased level of cAMP/PKA signaling was related to defective osteogenic differentiation (10, 11), potentially due to a role in the stem cell niche (12). However, the direct role of Prkar1a in osteoblastic differentiation has not been elucidated.
In this report, we used three cell models to directly test the effects of Prkar1a knockdown on osteogenic differentiation. Our results demonstrated that dysregulation of PKA activity caused by loss of Prkar1a interferes with the osteoblast differentiation program and that this effect appears to occur through antagonism of Runx2 transcriptional activity.
Materials and Methods
Cell culture and differentiation
The murine preosteoblast cell line, MC3T3-E1, subclone 4 (CRL-2593; American Type Culture Collection) was cultured in MEM-α supplemented with 10% fetal bovine serum (FBS) and antibiotics at 37°C in a 5% CO2 atmosphere. Primary mouse mesenchymal stem cells (mMSCs) were kindly provided by Dr Brett Hall and cultured in DMEM supplemented with 10% FBS and antibiotics as previously described (13). The human osteosarcoma cell line, MG-63 (CRL-1427; American Type Culture Collection) was cultured in Eagle's MEM supplemented with 10% FBS and antibiotics. Osteogenic differentiation was induced using osteoblast differentiation medium (ODM) composed of MEM-α with 50 mg/L ascorbic acid and 10 mM β-glycerophosphate (Sigma-Aldrich).
Stable gene silencing: lentiviral delivery of short hairpin RNA (shRNA)
Lentiviral vectors with LKO.1 backbone expressing shRNA for mouse Prkar1a (Open Biosystems; clone identification TRCN0000025488), shRNA for human PRKAR1A (Open Biosystems; clone identification TRCN0000018368), or lentiviral LKO.1 empty vector control recommended by the RNA interference Consortium (Open Biosystems) were generated by cotransfection of 293T cells with the packaging plasmids. Viruses were collected 48 hours after transfection, filtered with a 0.45-μm filter, and used to infect MC3T3-E1 cells, mMSCs, or MG-63 cells. The transduced mouse cells were selected with 5 μg/mL puromycin, whereas human cells were selected with 2 μg/mL puromycin.
PKA assay
PKA activity was measured by using a nonradioactive PKA activity assay kit (Promega Corp) following the manufacturer's instructions as previously described (14). Thirty micrograms of protein extract from MC3T3-E1 cells were used for measurement of free (−cAMP) and total (+cAMP) PKA activity.
Alkaline phosphatase staining
To determine alkaline phosphatase (ALP) activity, cultured cells were washed twice with PBS and then fixed in 4% paraformaldehyde for 1 hour at 4°C. After washing, cells were stained with nitroblue tetrazolium/5-bromo-4-chloro-3-indolyl phosphate (Roche) for 30 minutes at room temperature. The areas with ALP activity were quantified using GeneTools 4.01 (Syngene).
Alizarin Red staining
Cells were fixed as described for ALP staining and then treated with a 40-mM Alizarin Red stain solution (Sigma- Aldrich) (pH 4.2) for 20 minutes. Stained cultures were imaged and then quantified as described for ALP staining.
Cell growth assay
Cell growth assay was done as previously described (9). MC3T3-E1 cells were plated in triplicate in 12-well dishes at 25 000 cells per well. Cells were incubated in serum-free MEM-α with the following additives, as indicated in the figure legend: 5 μM forskolin or 10% FBS. Cells were allowed to proliferate for 6 days including one change of medium. Cell quantification was performed using crystal violet staining as described (9).
RNA isolation and quantitative RT-PCR (QPCR)
RNA was isolated from cells using Trizol and RNeasy minicolumns (QIAGEN) and converted to cDNA with the Bio-Rad iScript cDNA synthesis kit (Bio-Rad Laboratories) according to the manufacturer instructions. cDNA was subject to QPCR using the iQ SYBR Green Supermix kit (Bio-Rad Laboratories) as per the manufacturer's instructions. Reactions were each performed in triplicate. Primers sequences used in this study can be found in Supplemental Table 1, published on The Endocrine Society's Journals Online web site at http://mend.endojournals.org.
Protein analysis by Western blot
Cultured cells were lysed in M-PER protein extraction reagent containing HALT protease inhibitors (Pierce). Proteins were resolved by SDS-PAGE gels and transferred to nitrocellulose (Pall). Blots were developed with chemiluminescence solution (Western Lightning; PerkinElmer). To detect the proteins of interest, we used the following antibodies: PRKAR1A, PRKAR2A, PRKAR2B, and PKAc were from BD Biosciences; Runx2, forkhead box O1 (Foxo1), and activating transcription factor 4 (Atf4) were from Cell Signaling Technology; osteocalcin was from Biomedical Technologies, osteopontin was from Santa Cruz Biotechnology, and actin was from Sigma.
Short interfering RNA (siRNA)
Predesigned siRNAs were used to selectively silence Foxo1 and Atf4 (Dharmacon SMARTpool). The MC3T3-E1 cells were transfected with 40 nM or 80 nM siRNA using Lipofectamine RNAiMAX (Invitrogen) according to the manufacturer's instructions.
Transient transfection
MC3T3-E1 cells were plated in 24-well plates at a density of 5 × 10⁴ cells/well the day before transfection. To evaluate the cAMP-directed transactivation, the pCRE-luciferase reporter construct (Promega) was transiently transfected using Lipofectamine/plus transfection reagents (Invitrogen). After incubation at 37°C for 48 hours, the cells were treated with vehicle [dimethylsulfoxide (DMSO)] or forskolin (50 μM) for 24 hours and then were lysed and assayed for luciferase activity on a Glomax 96 microplate luminometer (Promega).
To evaluate the Runx2-mediated transcription, 500 ng of p6OSE2-Luc or OG2-Luc and pCMV-Runx2 constructs (15, 16) each were transiently transfected into MC3T3-E1 cells and MG-63 cells using Lipofectamine/plus transfection reagents (Invitrogen).
Chromatin immunoprecipitation
Chromatin immunoprecipitation (ChIP) assays were performed with the EZ ChIP system (Millipore) according to the manufacturer's directions. Briefly, MC3T3-E1 cells were fixed with 1% formaldehyde, lysed in sodium dodecyl sulfate lysis buffer, and sonicated to shear DNA to an average fragment size of 200–1000 bp. After overnight incubation with anti-Runx2 antibody (Cell Signaling Technology) at 4°C, immune complexes were collected using Protein G agarose/salmon sperm DNA. Samples were extracted with elution buffer and heated at 65°C overnight to reverse cross-linking. The primer sequences were as follows: containing Runx2 binding region on the osteocalcin promoter, forward, 5′-AGCCTGGCAGTCTCCGATT-3′ and reverse, 5′-ATGCTGTGGTTGGTGATTGC-3′; containing Runx2 binding region on the osteopontin promoter, forward, 5′-CCGGGTAGTGGCAAAAACCT-3′ and reverse, 5′-CCAGACAGTCTCCACCAATCAG-3′.
Statistical analyses
All experiments were repeated at least three times, and all analyses in this manuscript were performed using a two-sided Student's t test, as implemented by StatCrunch (http://www.statcrunch.com). The differences with P < .05 were considered significant. All values are expressed as the mean ± SD of triplicate independent samples.
Results
Lentivirus-mediated shRNA knockdown of Prkar1a mRNA in three cell models
To study the effects of Prkar1a knockdown on osteoblast differentiation, we turned to a well-established model: the MC3T3-E1 cell line (17). MC3T3-E1 cells are equivalent to committed preosteoblasts, which under differentiation conditions will lay down bone matrix and express markers of fully differentiated osteoblasts (OBLs). To generate Prkar1a-knockdown (KD) cells, a panel of five lentiviral shRNAs targeting Prkar1a was delivered into MC3T3-E1 cells. Cells were screened for the presence of mRNA KD, and the construct (R1a-88) producing the most robust and consistent reduction in Prkar1a was selected for further study (Figure 1A, left panel). For a control, we infected cells with the same lentiviral vector but lacking a shRNA insert.
Figure 1.

Generation of Prkar1a KD cells. The indicated cells were transduced with control or Prkar1a-KD lentivirus and studied at the mRNA or protein level. A, MC3T3-E1, mMSCs, and MG-63 cells were assayed for Prkar1a expression using QPCR. The Prkar1a mRNA levels were normalized to glyceraldehyde-3-phosphate dehydrogenase. B, Protein lysates of MC3T3-E1, mMSCs, and MG-63 cells were analyzed for Prkar1a protein by Western blotting. Note the marked down-regulation in cells transfected with Prkar1a shRNA. Actin was used as the internal control. Numbers below the panels indicate normalized (relative to actin) levels expressed relative to the value for control shRNA, which is arbitrarily set at 1.0. ND, not detected. This experiment was repeated at least twice with similar results, and a representative blot is shown. C, Measurement of total and free PKA activity in MC3T3-E1 cells by PKA assay. D, cAMP responsive element-luciferase reporter assay was used to measure the PKA transcriptional activity in MC3T3-E1 cells stimulated with forskolin. The data in panels A, C, and D are expressed as the mean ± SD of three independent experiments. *, P < .05, **, P < .01 compared with control shRNA.
To rule out effects specific for this cell line, we used two other cell systems. First, we studied mMSCs, primary cells capable of differentiating into a variety of lineages, including osteoblasts, chondroblasts, and adipocytes by manipulation of culture conditions (13). Second, we also studied the human osteosarcoma cell line MG-63; although this is a cancer-derived cell line, it can also be partially differentiated in culture and can be used for similar studies as those described above (18).
To generate the Prkar1a-KD mMSCs, we infected cells with the same lentiviral vector that was used for the MC3T3-E1 cells. For the human cells, we obtained a separate panel of lentiviral shRNAs (see Materials and Methods) and developed a KD construct by the same method.
For all three cell lines, the relative abundance of Prkar1a/PRKAR1A mRNA in the cells stably transfected with control shRNA or Prkar1a shRNA was analyzed by quantitative RT-PCR. Because PKA regulatory subunits have been demonstrated to also exhibit posttranscriptional regulation (19), we also analyzed Prkar1a protein expression by Western blot. Compared with nontransfected cells, there was no difference in Prkar1a mRNA and protein level in cells stably transfected with control shRNA (data not shown). However, transfection with the Prkar1a shRNA decreased Prkar1a mRNA expression and also reduced the level of Prkar1a protein in each of three cell models, confirming stable genomic integration of Prkar1a shRNA (Figure 1, A and B). To compare biochemical changes, we measured free and total PKA activity in the MC3T3-E1 cells transfected with control shRNA or Prkar1a shRNA. We found that the near-total abrogation of Prkar1a protein leads to a significant increase of free and total PKA activity as shown by PKA assay (Figure 1C). We also transfected these cells with a cAMP responsive element-luciferase construct to verify the downstream functional effects of PKA activation. As expected, forskolin induced more stimulation of PKA-driven transcriptional activity in the cells transfected with Prkar1a shRNA than in the cells transfected with the control shRNA, reflecting the inhibitory effect of Prkar1a subunit on PKA activity (Figure 1D).
Characterization of changes in PKA subunits during osteoblast differentiation
To understand the functional changes during OBL differentiation induced by Prkar1a KD, it was first necessary to determine whether the differentiation process itself induced changes in the PKA subunit composition. To address this question, Prkar1a mRNA and protein were examined in three cell models. Prkar1a mRNA and protein levels were significantly higher after osteoblastic differentiation in MC3T3-E1 cells transfected with control shRNAs (Figure 2) or in uninfected cells (data not shown), indicating a positive correlation between the expression of Prkar1a and osteoblastic differentiation (Figure 2). Prkar1a levels also increased in Prkar1a-KD cells, although mRNA levels were significantly reduced. Similar observations were also made for mMSCs and MG-63 cells (Supplemental Figures 1 and 2). We then looked at other PKA regulatory and catalytic subunits. As is shown in Figure 2, the mRNA level of Prkar2a was increased slightly in cells transfected with control shRNA during differentiation, whereas it did not change in Prkar1a KD MC3T3-E1 cells. Although Prkar1a KD MC3T3-E1 cells showed less Prkar2a expression compared with the control model, there is no significant difference in Prkar2a mRNA expression in Prkar1a KD mMSCs or MG-63 cells compared with the control cells (Supplemental Figures 1 and 2). Prkar2b mRNA levels did not change in MC3T3-E1 control cells during differentiation, but the protein level decreased in these cells during differentiation. Interestingly, in Prkar1a-KD MC3T3-E1 cells, both mRNA and protein levels of Prkar2b were increased after the induction of osteoblast differentiation. The Prkar2b level in Prkar1a-KD cells is significantly higher than that in control cells after differentiation, which was also observed in other models (20). Prkar1b was essentially undetectable in these cells, consistent with the much more limited tissue distribution of this subunit (21). Additionally, the expression levels of Prkaca, Prkacb, and Prkx were up-regulated after the induction of osteoblast differentiation in MC3T3-E1 cells transfected with control or Prkar1a shRNAs. Collectively these data demonstrate the expression pattern of PKA regulatory and catalytic subunits during the process of osteoblastic differentiation. Of particular interest, Prkar1a exhibits an expression trend positively correlated with osteogenesis in three different cell models.
Figure 2.

Differential expression of PKA regulatory and catalytic subunits in MC3T3-E1 preosteoblasts. A, MC3T3-E1 cells were grown in the presence (+) or absence (−) of osteoblast differentiation medium (ODM). Transcript levels were determined using QPCR, with expression levels normalized to glyceraldehyde-3-phosphate dehydrogenase. Data are expressed as the mean ± SD of three independent experiments. *, P < .05, **, P < .01 compared with undifferentiated cells. B, Protein lysates of MC3T3-E1 cells were analyzed by Western blotting. Actin was used as the internal control. Numbers below the panels indicate normalized (relative to actin) levels of PKA regulatory and catalytic subunits, expressed relative to the value for control shRNA, which is arbitrarily set at 1.0. This experiment was repeated at least twice with similar results, and a representative blot is shown.
Stable knockdown of Prkar1a results in impaired osteoblastic function
Osteoblastic differentiation was induced at confluence and samples collected at day 7 and assayed for ALP activity and calcium deposition by Alizarin Red staining, two functional assays for OBL differentiation. Osteoblast marker expression was also studied by QPCR and Western blot. After differentiation, the MC3T3-E1 cells transfected with control shRNA showed robust ALP activity and mineralization capacity, as demonstrated by Alizarin Red staining (Figure 3A, left panels). In contrast, ALP activity and calcium deposition of the MC3T3-E1 cells expressing Prkar1a shRNA was significantly reduced (Figure 3A, right panels). Extending the incubation period to 14 or 21 days produced similar findings (data not shown). To determine whether altered cell proliferation affected differentiation, MC3T3-E1 cells were tested for their growth characteristics using crystal violet staining. The knockdown cells exhibited no significant difference in proliferation compared with control cells (Supplemental Figure 3). Similarly, although the MG-63 cells cannot be induced to mineralize as much as the MC3T3-E1 cells, the ability to perform this function was impaired by Prkar1a KD (Figure 3B).
Figure 3.
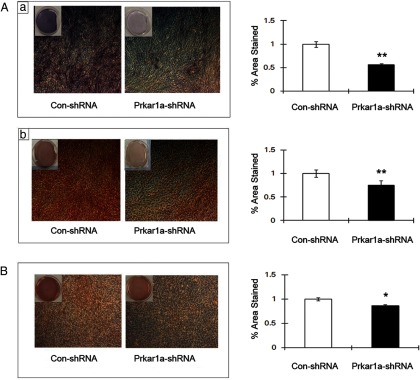
Prkar1a-KD suppresses functional osteoblast differentiation. A, Microscopic as well as gross view of ALP staining (a) and Alizarin Red staining (b) in differentiated MC3T3-E1 reveals reduced ALP activity and decreased mineral deposition in Prkar1a-KD cells. Bar graph shows the percentage of total area viewed that was positively stained with ALP (a) and Alizarin Red (b). B, Microscopic as well as gross view of Alizarin Red staining in differentiated MG-63 cells reveals reduced mineral deposition in Prkar1a-KD cells. Bar graph shows the percentage of total area viewed that was positively stained with Alizarin Red dye. Error bars designate means ± SD (n = 3). *, P < .05, **, P < .01 compared with control shRNA.
We also analyzed expression of mRNA and proteins associated with OBL differentiation. We observed a significant decrease in the expression of OBL markers in the MC3T3-E1 cells expressing Prkar1a shRNA when compared with control (Figure 4). At the protein level, mRNA levels generally correlated with protein with the notable exception of the transcription factor Runx2 (Figure 4B), one of the key mediators of the OBL differentiation program. Although Runx2 transcript was reduced, the Runx2 protein level was not significantly altered in Prkar1a-KD cells.
Figure 4.

Loss of Prkar1a inhibits expression of osteoblast differentiation markers in MC3T3-E1 cells. A, mRNA expression of the osteogenic markers in MC3T3-E1 cells was determined using QPCR analysis. The expression of each gene was normalized to glyceraldehyde-3-phosphate dehydrogenase expression. Data are expressed as means ± SD of three independent experiments. *, P < .05, **, P < .01 compared with control shRNA. B, Protein lysates of MC3T3-E1 cells were analyzed for osteogenic markers by Western blotting. Actin was used as the internal control. Numbers below the panels indicate normalized (relative to actin) levels of osteogenic markers, expressed relative to the value for control shRNA, which is arbitrarily set at 1.0. ND, not detected. This experiment was repeated at least twice with similar results, and a representative blot is shown.
Because we observed that both mRNA and protein levels of Prkar2b were higher after the induction of osteoblast differentiation in Prkar1a-KD MC3T3-E1 cells, we transfected MC3T3-E1 cells with Prkar2b shRNA. As shown in Supplemental Figure 4, decreased Prkar2b expression could also lead to impaired osteoblastic function, and double knockdown of Prkar1a and Prkar2b causes further reduction in the expression of OBL markers, indicating that proper PKA regulation is essential in osteoblastic differentiation.
Similar to the functional assays, MG-63 cells exhibit similar changes in mRNA levels (Figure 5), although changes were not as marked as in MC3T3-E1 cells (Figure 4) or in mMSCs (Supplemental Figure 5). These findings show that loss of Prkar1a impaired osteoblastic differentiation in three cell models, which is consistent with our previous report showing that cell differentiation is altered in Prkar1a tissue-specific knockout animals (8).
Figure 5.

Loss of Prkar1a inhibits expression of osteoblast differentiation markers in MG-63 cells. mRNA expression of the osteogenic markers in MG-63 cells was determined using QPCR analysis. The expression of each gene was normalized to glyceraldehyde-3-phosphate dehydrogenase expression. Data are expressed as means ± SD of three independent experiments. *, P < .05, **, P < .01 compared with control shRNA.
To verify that the effect of Prkar1a KD on osteoblastic differentiation is due to an increase in PKA activity, we treated control cells with forskolin (50 μM) in osteogenic medium for 7 days. As expected, forskolin caused a decrease in ALP activity and in the mRNA expression of OBL markers in MC3T3-E1 cells (Figure 6, A and B). Similar changes were also observed in MG-63 cells treated with forskolin (Supplemental Figure 6). We next examined whether the specific PKA inhibitor H89 (10 μM) would rescue defective osteogenic differentiation in Prkar1a-KD cells. As is shown in Figure 6C, decreased mineralization capacity was partly restored in knockdown cells after treatment with H89. mRNA levels of Runx2 and Osteocalcin were also markedly increased in Prkar1a-KD cells after being treated with H89 in osteogenic medium, although the expression of Osterix was not changed significantly (Figure 6D). The identical experiments in the MG-63 cells, however, did not result in increased mineralization capacity or osteocalcin level in knockdown cells treated with H89, suggesting that H89 may behave differently in different cellular context (Supplemental Figure 6).
Figure 6.

Effect of PKA activation and PKA inhibition on osteoblastic differentiation in MC3T3-E1 cells. A, Gross view of ALP staining in differentiated MC3T3-E1 reveals reduced ALP activity in forskolin-treated cells. B, mRNA expression of the osteogenic markers in MC3T3-E1 cells was determined using QPCR analysis. The expression of each gene was normalized to glyceraldehyde-3-phosphate dehydrogenase expression. Data are expressed as means ± SD of three independent experiments. *, P < .05, **, P < .01 compared with vehicle-treated cells. C, Gross view of Alizarin Red staining in differentiated MC3T3-E1 reveals partially restored mineral deposition in Prkar1a-KD cells treated with H89 (10 μM). D, mRNA expression of the osteogenic markers in MC3T3-E1 cells was determined using QPCR analysis. The expression of each gene was normalized to glyceraldehyde-3-phosphate dehydrogenase expression. Data are expressed as means ± SD of three independent experiments. **, P < .01 compared with knockdown cells.
Loss of Prkar1a suppressed Runx2-mediated transcription
Because Runx2 is a key mediator of the transcriptional program required for OBL differentiation, we were intrigued to find that the protein levels of Runx2 were unaltered in Prkar1a-KD cells, despite the fact that downstream transcriptional targets such as osteocalcin and osteopontin (16) were significantly reduced. To understand this observation, we examined the effect of Prkar1a KD on Runx2 association with the osteocalcin and osteopontin promoters by ChIP assay in MC3T3-E1 cells. As shown in Figure 7A, loss of Prkar1a strongly inhibited endogenous Runx2 binding to the osteocalcin promoter and osteopontin promoter. Next, we asked whether loss of Prkar1a can suppress the transcriptional activity of exogenous Runx2. Transfection of MC3T3-E1 cells or MG-63 cells with the p6OSE2-Luc, which harbors six copies of the Runx2 binding site, or the OG2-Luc, which contains the mouse osteocalcin promoter (15), produced minimal luciferase activity (data not shown). We then repeated the assay using cotransfection of these reporters with a Runx2 expression plasmid (15). Under these conditions, luciferase activity was significantly reduced in Prkar1a-KD cells compared with control, despite the presence of exogenous Runx2. To verify that this was a PKA-mediated effect, control cells were cotransfected with the luciferase and Runx2 expression plasmids, and luciferase assays were performed after forskolin treatment for 24 hours. As expected, luciferase activity was reduced by forskolin in both cell lines (Figure 7, B and C). Taken together, these results indicated that PKA activation, including through reduction of Prkar1a or by pharmacological means, interferes with DNA binding by Runx2, represses Runx2 transactivity, and, consequently, inhibits transcription of Runx2 target genes.
Figure 7.

Prkar1a-KD suppresses Runx2-mediated transcription. A, ChIP assay performed in MC3T3-E1 cells showing Runx2 binding to osteocalcin and osteopontin promoters. Chromatin was immunoprecipitated with antibodies against Runx2. Primers flanking the Runx2 binding site on the osteocalcin and osteopontin promoters were used for amplifying DNA by real-time PCR. Values indicate the mean of ChIP percentages relative to the input. B, Luciferase assay was performed in MC3T3-E1 cells. Left two panels, Control or Prkar1a-KD cells were transfected with the p6OSE2-Luc or OG2-Luc and pCMV-Runx2 constructs and harvested 48 hours later. Right two panels, Control cells were transfected with the p6OSE2-Luc or OG2-Luc and pCMV-Runx2 constructs. Forty-eight hours later, cells were treated with DMSO or forskolin and harvested 6 or 24 hours later. C, Luciferase assays in MG-63 cells were carried out as described above. The data are expressed as means ± SD of three independent experiments. *, P < .05, **, P < .01 compared with control shRNA or DMSO-treated cells.
We then sought to find the precise mechanism through which PKA activation inhibits Runx2-mediated transcription. It has been reported that Runx2 is a direct phosphorylation target for PKA (22); nevertheless, increases in Runx2 phosphorylation were not detected in either control or knockdown cells (data not shown). Previous studies have also indicated that the transcriptional activity of Runx2 can be modulated by binding to other nuclear proteins, including transcriptional coactivators, corepressors, and other transcription factors (23–25). As examples of the latter with relevance to osteogenesis, the Foxo1 protein was found to interact directly with Runx2, and Atf4 could indirectly associate with Runx2 in MC3T3-E1 cells to regulate osteocalcin gene expression (26–29). Indeed, Foxo1 and Atf4 mRNA levels (data not shown) and protein levels (Figure 8A) were significantly decreased in Prkar1a-KD cells. Moreover, in silico analysis showed the consensus DNA binding site for Foxo1 is in the close vicinity of the Runx2-response element (OSE2) in both the osteocalcin promoter (68 bp away) and the osteopontin promoter (156 bp away).
Figure 8.

Silencing of Foxo1 or Atf4 inhibits Runx2-mediated transcription. A, Protein lysates of MC3T3-E1 control and Prkar1a-KD cells were analyzed for Foxo1 and Atf4 by Western blotting. B and C, MC3T3-E1 control cells were treated with control siRNA or increasing concentrations of Foxo1 siRNA or Atf4 siRNA. Protein lysates were analyzed for Atf4, Foxo1, and Runx2 by Western blotting. Actin was used as the internal control. Numbers below the panels indicate normalized (relative to actin) levels of transcription factors, expressed relative to the value for control cells, which is arbitrarily set at 1.0. ND, not detected. The experiment was repeated at least twice with similar results, and a representative blot is shown. D, A ChIP assay was performed in MC3T3-E1 cells treated with control siRNA or 80 nM Foxo1 siRNA showing Runx2 binding to osteocalcin and osteopontin promoters. Chromatin was immunoprecipitated with antibodies against Runx2. Primers flanking the Runx2 binding site on the osteocalcin and osteopontin promoters were used for amplifying DNA by real-time PCR. Values indicate the mean of ChIP percentages relative to the input. E, MC3T3-E1 cells were transfected with the p6OSE2-Luc or OG2-Luc and pCMV-Runx2 constructs along with control siRNA or 80 nM Foxo1 siRNA and harvested 48 hours later. A luciferase assay was performed. F and G, MC3T3-E1 cells were treated with control siRNA or 80 nM Atf4 siRNA. ChIP assays and luciferase assays were performed as above. The data are expressed as means ± SD of three independent experiments. *. P < .05, **. P < .01 compared with control siRNA.
In the osteocalcin promoter, there is also a DNA-binding site for Atf4 within 100 bp from OSE2 (16). Based on this evidence, we hypothesized that reductions in Foxo1 or Atf4 might be responsible for the reduced Runx2-mediated osteocalcin promoter activation. To this end, we treated MC3T3-E1 control cells with siRNA targeting Foxo1 or Atf4. A significant decrease in Foxo1 or Atf4 was caused by transfection with the specific siRNAs, whereas control siRNA did not modify Foxo1 or Atf4 expression. Silencing of Foxo1 did not decrease Runx2 expression but led to a decrease in Atf4 protein expression, whereas silencing of Atf4 did not reduce either Runx2 or Foxo1 expression (Figure 8, B and C). The ChIP assay showed siFoxo1 or siAtf4 considerably inhibited the recruitment of Runx2 to OSE2 of the osteocalcin and osteopontin promoter (Figure 8, D and F). Given the role of Foxo1 or Atf4 in supporting the interaction of Runx2 with OSE2, we hypothesized that the transcriptional activity of Runx2 should also be decreased in Foxo1-deficient or Atf4-deficient osteoblasts. By luciferase assay, we observed that the activity of OG2-Luc, which contains the binding sites for Foxo1, Atf4, and Runx2, was dramatically reduced upon knockdown of Foxo1. Even though there were no Foxo1 binding sites in the p6OSE2-Luc plasmid, siFoxo1 also decreased Runx2-mediated transcription, suggesting that some of the effects of Foxo1 may occur in the absence of DNA binding (Figure 8E). Although silencing of Atf4 inhibited drastically the OG2 promoter activity, it caused only a slight reduction in the luciferase activity driven by OSE2 only (P = .046). These data indicate that Atf4 requires DNA binding to produce effects on Runx2 transcriptional activity (Figure 8G). Collectively these results indicate that reduced Runx2-mediated transcription in Prkar1a KD cells can be explained, at least partially, by the loss of cooperative transcription factor partners such as Foxo1 and Atf4.
Discussion
The involvement of the PKA pathway in bone biology has been known for many years because it is a key signal transduction pathway downstream from the PTH receptor PTH1R (30–32). PKA signaling has been demonstrated functionally to be essential for bone mineralization both in vitro and in vivo (33). In addition to these functional data, there are also strong genetic data connecting PKA signaling to bone biology. McCune-Albright syndrome (MAS) is a human syndrome affecting bone biology that also implicates PKA signaling. The genetic defects responsible for MAS were identified as activating mutations of the Gsα subunit, leading to stimulation of adenylyl cyclase (5), elevation of intracellular cAMP levels, and unregulated activation of PKA signaling. When bone is affected, patients get fibrous dysplasia, an immature expansion of osteoblast precursors leading to structurally immature and hyperproliferative bone (34). Conversely, lack of this protein causes progressive osseous heteroplasia, an excess of mineralized bone (35); the accelerated osteoblast differentiation has also been modeled in mice and found to occur in a cell-autonomous manner (36). Additionally, although not a common manifestation, bone tumors are also observed in CNC and have been characterized as osteochondromyxomas (4). These patients carry mutations in PRKAR1A and thus have dysregulation of the PKA system (5). The recent finding that Prkar1a is an osteosarcoma tumor suppressor verifies further the genetic evidence implicating PKA signaling in skeletal biology and disease (37).
Despite the fact that proper PKA regulation is required for bone formation, analysis of the role of PKA subunits has not previously reported. In this paper, we describe changes in PKA subunit composition that occur during differentiation, which may explain why CNC (and MAS) patients develop tumors of differentiated bone. Although the primary goal of this study was to determine the role of Prkar1a in regulating osteogenesis, we also characterized the gene expression of other regulatory and catalytic subunits of PKA, which may provide important clues into the function of the corresponding proteins. These observations add to the recent findings on the developmentally regulated differences in transcription of the GNAS1 locus, which encodes Gsα and related transcripts (35). In our studies, we observed the up-regulation of catalytic subunits and barely detectable levels of Prkar1b during differentiation among all three cell types. However, osteoblastic differentiation impacts the expression of Prkar2a and Prkar2b in a cell type-dependent manner.
We have previously proposed that the ablation of Prkar1a interferes with the differentiation of multiple tissue lineages, and using three different cell models, the work presented here confirms that normal Prkar1a levels are required for proper OBL differentiation. We found that Prkar1a levels noticeably increased during osteoblastic differentiation of three osteoblast cell models. This observation suggests that Prkar1a has a positive effect on promoting osteogenesis and further indicates that suppression of Prkar1a may allow cells to be refractory to osteogenic differentiation cues. Specifically we observed an inhibition of the expression of osteoblast markers without alteration in cell proliferation. The fact that similar observations were made in three cell systems implies that the antiosteogenic effect of Prkar1 KD is not species or cell type specific.
We further sought the cellular mechanisms through which Prkar1a-KD causes aberrant differentiation. Osteoblastic differentiation and bone formation is under the guidance of a series of transcription factors such as Runx2 and Osterix because deletion of either of them will lead to a complete lack of bone formation (38, 39). These transcription factors are regulated by a range of developmental signals, which have important roles at various stages of osteoblast lineage cell development (40). In this report, we focused on Runx2, which has been reported to be the major regulator of OBL differentiation (40). Our observations showed that Runx2 may undergo posttranscriptional regulation because protein levels did not change despite a reduction in mRNA. Functionally, Prkar1a-KD repressed Runx2 binding to osteocalcin and osteopontin promoters with subsequent reduction in Runx2 transactivation. Although it is known that Runx2 can undergo posttranslational modifications such as phosphorylation, acetylation, and ubiquitylation during osteoblast differentiation (22, 41, 42), increases in Runx2 phosphorylation were not detected in MC3T3-E1 transfected with control shRNA or Prkar1a shRNA(data not shown). We have not evaluated acetylation or ubiquitylation of Runx2 yet.
The cooperation of some transcription factors and Runx2 in osteocalcin expression has previously been reported. Foxo1 is a forkhead transcription factor that can modulate proliferation and differentiation of osteoblastic cells (43, 44). It has been shown that Foxo1 can interact directly with Runx2, although the exact impact of Foxo1 on Runx2 functional activity is controversial (27–29). Atf4 is a member of the basic leucine zipper family of transcription factors, which can indirectly associate with Runx2 to promote the terminal differentiation of osteoblasts via enhancing osteocalcin expression (26). Alteration of these two transcription factors was also observed in Prkar1a-KD cells: both mRNA and protein levels were significantly decreased. Although these findings suggest that PKA activity may affect transcription and/or RNA stability of these two proteins, we can not rule out the possibility that PKA can also regulate them through posttranslational mechanisms because both Foxo1 and Atf4 have been proved to be the direct substrates of PKA (45, 46). The association of ChIP and promoter-reporter luciferase assays provides compelling evidence that Foxo1 and Atf4 can function as collaborating transcription factors for Runx2-mediated osteocalcin gene transcription. The affinity of Runx2 for the OSE2 was decreased in the cells transfected with siFoxo1 or siAtf4, suggesting that Foxo1 or Atf4 act as adaptors, allowing Runx2 to bind to OSE2. Moreover, previous reports have indicated that Foxo1 can interact with Atf4 and this interaction promotes the transcriptional activity of Foxo1 (43, 47) as well as that of Atf4 (48). Therefore, it is likely that combinations of Runx2, Foxo1, and Atf4, possibly with other factors, contribute to the physiological regulation of osteogenic marker expression. The examination of the hierarchical relationship of these transcription factors will require Runx2 silencing and a ChIP assay with the Foxo1 or Atf4 antibody.
In summary, our findings suggest that Prkar1a increases during osteoblast differentiation and that PKA activation caused by the loss of Prkar1a negatively regulates osteoblast differentiation through the inhibition of Runx2-mediated transcription. Our data indicate that decreases in Foxo1 and Atf4 are likely responsible for the attenuated Runx2 transcriptional activity in Prkar1a KD cells. Prkar1a and PKA signaling may impact bone biology on a fundamental level and thus could be a potential clinical target to combat a variety of bone diseases relevant to abnormal differentiation and maturation of osteoblasts.
Additional material
Supplementary data supplied by authors.
Acknowledgments
We are grateful to Dr Xiangtao Liu for the sequence analysis. We also thank Dr Gerard Karsenty for the p6OSE2-Luc and pCMV-Cbfa1/Runx2 expression constructs; Dr Renny T. Franceschi for the OG2-Luc construct; and Dr Brett Hall and Dr Gail E. Besner for the mMSCs.
This work was supported in part by National Institutes of Health Grants CA112268 and AR057168 (to L.S.K.) and Grant CA16058 (to the Ohio State University Comprehensive Cancer Center).
Disclosure Summary: The authors indicate they have nothing to disclose.
Footnotes
- ALP
- alkaline phosphatase
- Atf4
- activating transcription factor 4
- ChIP
- chromatin immunoprecipitation
- CNC
- Carney complex
- DMSO
- dimethylsulfoxide
- FBS
- fetal bovine serum
- Foxo1
- forkhead box O1
- KD
- knockdown
- MAS
- McCune-Albright syndrome
- mMSC
- mouse mesenchymal stem cell
- OBL
- osteoblast
- OSE2
- Runx2-response element
- PKA
- protein kinase A
- QPCR
- quantitative RT-PCR
- Runx2
- Runt-related transcription factor-2
- shRNA
- short hairpin RNA
- si
- short interfering
- siRNA
- short interfering RNA.
References
- 1. Nefussi JR, Brami G, Modrowski D, Oboeuf M, Forest N. Sequential expression of bone matrix proteins during rat calvaria osteoblast differentiation and bone nodule formation in vitro. J Histochem Cytochem. 1997;45:493–503. [DOI] [PubMed] [Google Scholar]
- 2. Haydon RC, Luu HH, He TC. Osteosarcoma and osteoblastic differentiation: a new perspective on oncogenesis. Clin Orthop Relat Res. 2007;454:237–246. [DOI] [PubMed] [Google Scholar]
- 3. Kirschner LS, Kusewitt DF, Matyakhina L, et al. A mouse model for the Carney complex tumor syndrome develops neoplasia in cyclic AMP-responsive tissues. Cancer Res. 2005;65:4506–4514. [DOI] [PubMed] [Google Scholar]
- 4. Carney JA, Boccon-Gibod L, Jarka DE, et al. Osteochondromyxoma of bone: a congenital tumor associated with lentigines and other unusual disorders. Am J Surg Pathol. 2001;25:164–176. [DOI] [PubMed] [Google Scholar]
- 5. Kirschner LS, Carney JA, Pack SD, et al. Mutations of the gene encoding the protein kinase A type I-α regulatory subunit in patients with the Carney complex. Nat Genet. 2000;26:89–92. [DOI] [PubMed] [Google Scholar]
- 6. Kirschner LS. Use of mouse models to understand the molecular basis of tissue-specific tumorigenesis in the Carney complex. J Intern Med. 2009;266:60–68. [DOI] [PubMed] [Google Scholar]
- 7. Yin Z, Jones GN, Towns WH, 2nd, et al. Heart-specific ablation of Prkar1a causes failure of heart development and myxomagenesis. Circulation. 2008;117:1414–1422. [DOI] [PubMed] [Google Scholar]
- 8. Jones GN, Pringle DR, Yin Z, et al. Neural crest-specific loss of Prkar1a causes perinatal lethality resulting from defects in intramembranous ossification. Mol Endocrinol. 24:1559–1568. [DOI] [PMC free article] [PubMed] [Google Scholar]
- 9. Pavel E, Nadella K, Towns WH, 2nd, Kirschner LS. Mutation of Prkar1a causes osteoblast neoplasia driven by dysregulation of protein kinase A. Mol Endocrinol. 2008;22:430–440. [DOI] [PMC free article] [PubMed] [Google Scholar]
- 10. Koh AJ, Beecher CA, Rosol TJ, McCauley LK. 3′,5′-Cyclic adenosine monophosphate activation in osteoblastic cells: effects on parathyroid hormone-1 receptors and osteoblastic differentiation in vitro. Endocrinology. 1999;140:3154–3162. [DOI] [PubMed] [Google Scholar]
- 11. Qiu N, Zhou H, Xiao Z. Downregulation of PKD1 by shRNA results in defective osteogenic differentiation via cAMP/PKA pathway in human MG-63 cells. J Cell Biochem. 2012;113:967–976. [DOI] [PMC free article] [PubMed] [Google Scholar]
- 12. Tsang KM, Starost MF, Nesterova M, et al. Alternate protein kinase A activity identifies a unique population of stromal cells in adult bone. Proc Natl Acad Sci USA. 107:8683–8688. [DOI] [PMC free article] [PubMed] [Google Scholar]
- 13. Tropel P, Noel D, Platet N, Legrand P, Benabid AL, Berger F. Isolation and characterisation of mesenchymal stem cells from adult mouse bone marrow. Exp Cell Res. 2004;295:395–406. [DOI] [PubMed] [Google Scholar]
- 14. Yin Z, Pringle DR, Jones GN, Kelly KM, Kirschner LS. Differential role of PKA catalytic subunits in mediating phenotypes caused by knockout of the Carney complex gene Prkar1a. Mol Endocrinol. 2011;25:1786–1793. [DOI] [PMC free article] [PubMed] [Google Scholar]
- 15. Ducy P, Zhang R, Geoffroy V, Ridall AL, Karsenty G. Osf2/Cbfa1: a transcriptional activator of osteoblast differentiation. Cell. 1997;89:747–754. [DOI] [PubMed] [Google Scholar]
- 16. Ducy P, Karsenty G. Two distinct osteoblast-specific cis-acting elements control expression of a mouse osteocalcin gene. Mol Cell Biol. 1995;15:1858–1869. [DOI] [PMC free article] [PubMed] [Google Scholar]
- 17. Schiller PC, D'Ippolito G, Roos BA, Howard GA. Anabolic or catabolic responses of MC3T3–E1 osteoblastic cells to parathyroid hormone depend on time and duration of treatment. J Bone Miner Res. 1999;14:1504–1512. [DOI] [PubMed] [Google Scholar]
- 18. Parreno J, Buckley-Herd G, de-Hemptinne I, Hart DA. Osteoblastic MG-63 cell differentiation, contraction, and mRNA expression in stress-relaxed 3D collagen I gels. Mol Cell Biochem. 2008;317:21–32. [DOI] [PubMed] [Google Scholar]
- 19. Boundy VA, Chen J, Nestler EJ. Regulation of cAMP-dependent protein kinase subunit expression in CATH.a and SH-SY5Y cells. J Pharmacol Exp Ther. 1998;286:1058–1065. [PubMed] [Google Scholar]
- 20. Griffin KJ, Kirschner LS, Matyakhina L, et al. A transgenic mouse bearing an antisense construct of regulatory subunit type 1A of protein kinase A develops endocrine and other tumours: comparison with Carney complex and other PRKAR1A induced lesions. J Med Genet. 2004;41:923–931. [DOI] [PMC free article] [PubMed] [Google Scholar]
- 21. Clegg CH, Koeiman NR, Jenkins NA, Gilbert DJ, Copeland NG, Neubauer MG. Structural features of the murine gene encoding the RIβ subunit of cAMP-dependent protein kinase. Mol Cell Neurosci. 1994;5:153–164. [DOI] [PubMed] [Google Scholar]
- 22. Selvamurugan N, Shimizu E, Lee M, Liu T, Li H, Partridge NC. Identification and characterization of Runx2 phosphorylation sites involved in matrix metalloproteinase-13 promoter activation. FEBS Lett. 2009;583:1141–1146. [DOI] [PMC free article] [PubMed] [Google Scholar]
- 23. Li X, Decker M, Westendorf JJ. TEThered to Runx: novel binding partners for runx factors. Blood Cells Mol Dis. 2010;45:82–85. [DOI] [PMC free article] [PubMed] [Google Scholar]
- 24. Li X, Hoeppner LH, Jensen ED, Gopalakrishnan R, Westendorf JJ. Co-activator activator (CoAA) prevents the transcriptional activity of Runt domain transcription factors. J Cell Biochem. 2009;108:378–387. [DOI] [PMC free article] [PubMed] [Google Scholar]
- 25. Westendorf JJ. Transcriptional co-repressors of Runx2. J Cell Biochem. 2006;98:54–64. [DOI] [PubMed] [Google Scholar]
- 26. Xiao G, Jiang D, Ge C, et al. Cooperative interactions between activating transcription factor 4 and Runx2/Cbfa1 stimulate osteoblast-specific osteocalcin gene expression. J Biol Chem. 2005;280:30689–30696. [DOI] [PubMed] [Google Scholar]
- 27. Teixeira CC, Liu Y, Thant LM, Pang J, Palmer G, Alikhani M. Foxo1, a novel regulator of osteoblast differentiation and skeletogenesis. J Biol Chem. 2010;285:31055–31065. [DOI] [PMC free article] [PubMed] [Google Scholar]
- 28. Zhang H, Pan Y, Zheng L, et al. FOXO1 inhibits Runx2 transcriptional activity and prostate cancer cell migration and invasion. Cancer Res. 71:3257–3267. [DOI] [PMC free article] [PubMed] [Google Scholar]
- 29. Yang S, Xu H, Yu S, et al. Foxo1 mediates insulin-like growth factor 1 (IGF1)/insulin regulation of osteocalcin expression by antagonizing Runx2 in osteoblasts. J Biol Chem. 286:19149–19158. [DOI] [PMC free article] [PubMed] [Google Scholar]
- 30. Spiegel AM. The molecular basis of disorders caused by defects in G proteins. Horm Res. 1997;47:89–96. [DOI] [PubMed] [Google Scholar]
- 31. Kano J, Sugimoto T, Fukase M, Fujita T. The activation of cAMP-dependent protein kinase is directly linked to the inhibition of osteoblast proliferation (UMR-106) by parathyroid hormone-related protein. Biochem Biophys Res Commun. 1991;179:97–101. [DOI] [PubMed] [Google Scholar]
- 32. Ahlstrom M, Lamberg-Allardt C. Rapid protein kinase A-mediated activation of cyclic AMP-phosphodiesterase by parathyroid hormone in UMR-106 osteoblast-like cells. J Bone Miner Res. 1997;12:172–178. [DOI] [PubMed] [Google Scholar]
- 33. Siddappa R, Martens A, Doorn J, et al. cAMP/PKA pathway activation in human mesenchymal stem cells in vitro results in robust bone formation in vivo. Proc Natl Acad Sci USA. 2008;105:7281–7286. [DOI] [PMC free article] [PubMed] [Google Scholar]
- 34. Riminucci M, Fisher LW, Shenker A, Spiegel AM, Bianco P, Gehron Robey P. Fibrous dysplasia of bone in the McCune-Albright syndrome: abnormalities in bone formation. Am J Pathol. 1997;151:1587–1600. [PMC free article] [PubMed] [Google Scholar]
- 35. Zhang S, Kaplan FS, Shore EM. Different roles of GNAS and cAMP signaling during early and late stages of osteogenic differentiation. Horm Metab Res. 2012;44:724–731. [DOI] [PMC free article] [PubMed] [Google Scholar]
- 36. Wu JY, Aarnisalo P, Bastepe M, et al. Gsα enhances commitment of mesenchymal progenitors to the osteoblast lineage but restrains osteoblast differentiation in mice. J Clin Invest. 121:3492–3504. [DOI] [PMC free article] [PubMed] [Google Scholar]
- 37. Molyneux SD, Di Grappa MA, Beristain AG, et al. Prkar1a is an osteosarcoma tumor suppressor that defines a molecular subclass in mice. J Clin Invest. 120:3310–3325. [DOI] [PMC free article] [PubMed] [Google Scholar]
- 38. Komori T, Yagi H, Nomura S, et al. Targeted disruption of Cbfa1 results in a complete lack of bone formation owing to maturational arrest of osteoblasts. Cell. 1997;89:755–764. [DOI] [PubMed] [Google Scholar]
- 39. Nakashima K, Zhou X, Kunkel G, et al. The novel zinc finger-containing transcription factor osterix is required for osteoblast differentiation and bone formation. Cell. 2002;108:17–29. [DOI] [PubMed] [Google Scholar]
- 40. Long F. Building strong bones: molecular regulation of the osteoblast lineage. Nat Rev Mol Cell Biol. 2012;13:27–38. [DOI] [PubMed] [Google Scholar]
- 41. Jeon EJ, Lee KY, Choi NS, et al. Bone morphogenetic protein-2 stimulates Runx2 acetylation. J Biol Chem. 2006;281:16502–16511. [DOI] [PubMed] [Google Scholar]
- 42. Tintut Y, Parhami F, Le V, Karsenty G, Demer LL. Inhibition of osteoblast-specific transcription factor Cbfa1 by the cAMP pathway in osteoblastic cells. Ubiquitin/proteasome-dependent regulation. J Biol Chem. 1999;274:28875–28879. [DOI] [PubMed] [Google Scholar]
- 43. Rached MT, Kode A, Xu L, et al. FoxO1 is a positive regulator of bone formation by favoring protein synthesis and resistance to oxidative stress in osteoblasts. Cell Metab. 11:147–160. [DOI] [PMC free article] [PubMed] [Google Scholar]
- 44. Siqueira MF, Flowers S, Bhattacharya R, et al. FOXO1 modulates osteoblast differentiation. Bone. 48:1043–1051. [DOI] [PMC free article] [PubMed] [Google Scholar]
- 45. Lee JW, Chen H, Pullikotil P, Quon MJ. Protein kinase A-α directly phosphorylates FoxO1 in vascular endothelial cells to regulate expression of vascular cellular adhesion molecule-1 mRNA. J Biol Chem. 286:6423–6432. [DOI] [PMC free article] [PubMed] [Google Scholar]
- 46. Elefteriou F, Ahn JD, Takeda S, et al. Leptin regulation of bone resorption by the sympathetic nervous system and CART. Nature. 2005;434:514–520. [DOI] [PubMed] [Google Scholar]
- 47. Kode A, Mosialou I, Silva BC, et al. FOXO1 orchestrates the bone-suppressing function of gut-derived serotonin. J Clin Invest. 2012;122:3490–3503. [DOI] [PMC free article] [PubMed] [Google Scholar]
- 48. Kode A, Mosialou I, Silva BC, et al. FoxO1 protein cooperates with ATF4 protein in osteoblasts to control glucose homeostasis. J Biol Chem. 287:8757–8768. [DOI] [PMC free article] [PubMed] [Google Scholar]
Associated Data
This section collects any data citations, data availability statements, or supplementary materials included in this article.