

Tandem chromatin affinity purification in Arabidopsis cell suspension cultures omits the need for specific antibodies and improves DNA enrichment efficiency of transcription factor location experiments.
Abstract
Genome-wide identification of transcription factor (TF) binding sites is pivotal to our understanding of gene expression regulation. Although much progress has been made in the determination of potential binding regions of proteins by chromatin immunoprecipitation, this method has some inherent limitations regarding DNA enrichment efficiency and antibody necessity. Here, we report an alternative strategy for assaying in vivo TF-DNA binding in Arabidopsis (Arabidopsis thaliana) cells by tandem chromatin affinity purification (TChAP). Evaluation of TChAP using the E2Fa TF and comparison with traditional chromatin immunoprecipitation and single chromatin affinity purification illustrates the suitability of TChAP and provides a resource for exploring the E2Fa transcriptional network. Integration with transcriptome, cis-regulatory element, functional enrichment, and coexpression network analyses demonstrates the quality of the E2Fa TChAP sequencing data and validates the identification of new direct E2Fa targets. TChAP enhances both TF target mapping throughput, by circumventing issues related to antibody availability, and output, by improving DNA enrichment efficiency.
The regulation of gene expression plays an important role in a variety of biological processes. Many regulatory genes encode transcription factors (TFs), which modulate gene expression by binding to regulatory sequences of their target genes. However, which genes are directly controlled by these TFs, and the molecular mechanisms of target gene recognition in vivo, particularly in plants, are still largely unexplored.
A commonly used tool to address these questions is chromatin immunoprecipitation (ChIP; Kuo and Allis, 1999). In a classical ChIP experiment, DNA fragments associated with a specific protein are enriched. DNA-binding protein complexes are reversibly cross linked with formaldehyde, the chromatin is fragmented, and the DNA fraction that interacts with the TF of interest is isolated by immunoprecipitation with a specific antibody. Finally, DNA sequences associated with the precipitated protein can be identified by hybridization to tiling arrays (ChIP-chip) or by direct high-throughput sequencing (ChIP-seq; Kim and Ren, 2006; Park, 2009).
In spite of its power, conventional ChIP has experimental boundaries. Its main shortcoming, especially in the case of genome-wide applications, is the overall inefficiency of ChIP enrichment. This drawback, which is a consequence of cross linking and compromises the identification of low-abundance TF-DNA interactions, necessitates the requirement for large cell numbers and the need for high-quality antibodies. The hurdle to allow ChIP application to small cell numbers is mainly being addressed at the level of the chromatin isolation procedure (O’Neill et al., 2006; Acevedo et al., 2007; Dahl and Collas, 2008; Wu et al., 2009). Recent adaptations in deep sequencing and library preparation, allowing compatibility with smaller DNA quantities, provide alternative solutions (Goren et al., 2010; Adli and Bernstein, 2011; Bowman et al., 2013). The challenge of specific antibody requirement may be circumvented by epitope/affinity tagging of the TF (Harbison et al., 2004; Zhang et al., 2008).
Reports of genome-wide ChIP studies of plant TFs, in comparison with other eukaryotic systems, are still lagging behind. Although plant-specific ChIP protocols have been successfully developed (Bowler et al., 2004; Gendrel et al., 2005; Saleh et al., 2008; Kaufmann et al., 2010), plant features, such as rigid cell walls, large vacuoles, chloroplasts, and the paucity of nuclei in some tissues, combined with TF tissue and target specificities all challenge TF-DNA enrichment.
Here, we report a generic alternative ChIP protocol relying on Arabidopsis (Arabidopsis thaliana) cell suspension cultures and TF tandem affinity tagging. The development of a high-throughput tandem affinity purification (TAP) platform, comprising transformation vectors with high cloning flexibility and the fast generation of transgenic cell suspension cultures, to study protein interactomes was described previously (Van Leene et al., 2007, 2008). Through combining the TAP approach with ChIP protocol features, we established a tandem chromatin affinity purification (TChAP) method for assaying in vivo TF-DNA binding.
As a proof of principle, we employed TChAP followed by direct sequencing to study the well-characterized Arabidopsis E2Fa TF (De Veylder et al., 2002). Our results demonstrate that the TChAP method is suitable for the identification of TF-DNA binding regions. We have confirmed previously identified E2Fa-regulated genes and identified many new potential E2Fa targets. We further show that the two-step TChAP purification performs better than traditional ChIP and single-step chromatin affinity purification (ChAP) in terms of the enrichment of DNA elements. This enables the identification of more and less prevalent TF-DNA interactions. The TChAP method in Arabidopsis cell suspension cultures offers an excellent ChIP alternative, enhancing both data quality and the quantity of TF location studies.
RESULTS
Establishment of TChAP in Arabidopsis Cell Suspension Cultures
Although ChIP has been applied to a wide range of model organisms, including Arabidopsis, it remains a challenging technique, with the quality of specific antibodies greatly influencing genomic ChIP outcomes. ChAP methods, with different generic tags, are commonly used as an alternative, but these approaches also often suffer from low signal-to-noise ratios. To overcome this problem and to reduce nonspecific background signals, we developed a two-step TChAP strategy. In addition, Arabidopsis cell suspension cultures, rather than plants, were utilized in order to have an unlimited supply of cells.
Previous reports describe a tandem affinity tag system, based on a biotinylated peptide flanked by two hexa-histidine (HBH) tags, compatible with TAP purification and mass spectrometry identification of formaldehyde cross-linked protein complexes in yeast (Saccharomyces cerevisiae; Guerrero et al., 2006; Tagwerker et al., 2006). To evaluate the suitability of this HBH tag for chromatin isolation in plants, we C-terminally tagged the well-characterized Arabidopsis E2Fa TF and expressed the E2Fa-HBH fusion under the control of the constitutive cauliflower mosaic virus 35S promoter in Arabidopsis cell suspension cultures.
E2Fa-HBH expression in transgenic lines was determined by protein-blot analysis with both an anti-His antibody and an anti-E2Fa antibody (Takahashi et al., 2008; Fig. 1A). Although constitutively overexpressed, E2Fa-HBH protein accumulation was close to the endogenous E2Fa protein level (Fig. 1A). Similar accumulation levels for other 35S-driven fusion proteins have been observed previously and are explained by the high ploidy level (9n) of the used Arabidopsis culture and/or the high level of posttranslational regulation of the fusion protein (Van Leene et al., 2007).
Figure 1.
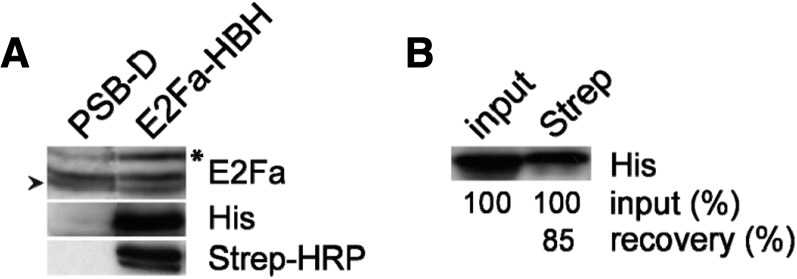
E2Fa-HBH expression and biotinylation analysis. A, E2Fa-HBH protein expression analysis. Immunoblot analysis of wild-type (PSB-D) and E2Fa-HBH-overexpressing cell suspension cultures used anti-E2Fa and anti-His antibodies and a streptavidin (Strep)-HRP conjugate. The arrowhead indicates the endogenous E2Fa and the asterisk the ectopic E2Fa-HBH detected with the anti-E2Fa antibody. B, E2Fa-HBH in vivo biotinylation efficiency. Western blotting with an anti-His antibody was used to monitor binding of E2Fa-HBH to streptavidin-Sepharose beads. Information on the percentage of input and the estimation of the bead-bound amount is indicated.
In vivo biotinylation of the HBH tag was initially assayed in total protein extracts using a streptavidin-horseradish peroxidase (HRP) conjugate detecting a biotinylated protein corresponding to E2Fa-HBH in transgenic extracts (Fig. 1A). In addition, the biotinylation efficiency, as evaluated by incubating E2Fa-HBH protein extracts with streptavidin-Sepharose beads, was estimated at 85% when comparing the E2Fa-HBH amount in the bound fraction versus the total fraction (Fig. 1B; see “Materials and Methods”).
While establishing the TChAP procedure, several aspects of the assay were optimized. Cross-linking stringency was evaluated to ensure good extraction and isolation of TF-DNA complexes; the appropriate sonication condition was determined; and a purification strategy was set up to obtain a purification efficiency comparable with that of traditional TAP purifications, resulting in an E2Fa-HBH protein bait recovery of 2% to 5% (Fig. 2A).
Figure 2.

Comparison of different chromatin isolation methods. A, E2Fa-HBH protein purification efficiency. Immunoblot analysis used an anti-His antibody to evaluate the ChIP, ChAP, and TChAP E2Fa-HBH protein purification yields. Information on the percentage of input and the estimation of the purification efficiency is given. B, ChIP, ChAP, and TChAP DNA qPCR analysis. The association of E2Fa with the proximal promoters of the well-established E2Fa target genes, ORC1b, CTF18, and ETG1, was quantified by qPCR. Enrichment of E2Fa binding was normalized using CDKA;1 and UBQ10 control promoter regions. Error bars indicate sd (n = 3).
Eventually, TChAP was performed by combining the HBH purification method of Tardiff et al. (2007) with ChIP protocol de-cross linking, deproteinization, and DNA purification (Kim et al., 2008). Briefly, E2Fa-HBH and its cross-linked proteins and DNA were first bound on nickel-nitrilotriacetic acid agarose (NiNTA) beads, specifically eluted with imidazole, and then bound to streptavidin-Sepharose under high-stringency conditions. E2Fa-HBH-DNA complexes were subsequently eluted and reverse cross linked, and the DNA was purified.
Final evaluation of the TChAP procedure occurred by analyzing the TChAP DNA sample by quantitative PCR. The proximal promoters of the well-known E2Fa target genes ORIGIN OF REPLICATION COMPLEX1b (ORC1b), CHROMOSOME TRANSMISSION FIDELITY18 (CTF18), and E2F TARGET GENE1 (ETG1; Vandepoele et al., 2005) were found to be highly enriched relative to both negative control promoter regions and input DNA (Fig. 2B; Supplemental Fig. S1), illustrating the suitability of our TChAP approach for the isolation and identification of TF-DNA binding sites.
Evaluation of Alternative Chromatin Isolation Methods
To further validate the TChAP strategy, we performed, in parallel, ChIP and single-step ChAP reactions on the E2Fa-HBH-expressing Arabidopsis cell suspension culture. Using a specific anti-E2Fa antibody (Takahashi et al., 2008), both endogenous E2Fa and E2Fa-HBH cross-linked DNA elements were precipitated. Biotin tagging in combination with streptavidin-based ChAP, which has been reported to be a suitable ChIP alternative (Kim et al., 2009; Kulyyassov et al., 2011), was also performed on E2Fa-HBH.
Analysis of the E2Fa-HBH protein purification by protein blotting demonstrated a higher recovery of bait protein using these one-step purification methods (Fig. 2A). As expected, the very high affinity of biotin for streptavidin (10−15 Kd) was more efficient in isolating-tagged E2Fa (40%–50% estimated recovery of bait) than the traditional immunoaffinity approach using the E2Fa antibody (10%–15%), whereas two-step affinity purifications in general resulted in low yields (2%–5%). In concordance, quantification of the E2Fa-bound coisolated DNA measured the highest DNA yield in ChAP, an intermediate amount in ChIP, and the lowest recovery in TChAP. As a consequence, for TChAP, three times more input was required to retrieve a copurified DNA amount in the same range as that of the ChIP isolation protocol and sufficient for downstream sequencing (see “Materials and Methods”).
Quantitative PCR evaluation of the three methods, however, showed that TChAP gave the highest enrichments relative to unbound control loci of selected E2Fa target gene promoters, indicating a better signal-to-noise ratio (Fig. 2B; Supplemental Fig. S1). Analysis of enrichment levels in mock ChIP/ChAP/TChAP experiments confirm the differences in the levels of nonspecific genomic DNA isolation between the alternative chromatin isolation methods (Supplemental Fig. S1). Surprisingly ChAP, despite the stringent biotin-streptavidin purification procedure, displayed the lowest signal-to-noise ratio. This could be due to the copurification of endogenous biotinylated protein-bound DNA. Although currently unexplored in plants, biotin is known, in addition to its classical catalytic function as a coenzyme for carboxylases, to play a role in animals in regulating chromatin structure and gene expression (Zempleni, 2005).
In conclusion, these comparisons demonstrate that the TChAP procedure offers an excellent alternative to isolate TF-bound chromatin, omitting the need for high-quality antibodies by utilizing biotin tagging in combination with a preceding tandem purification to reduce background signals and improve DNA enrichment.
Genome-Wide Comparison of ChIP, ChAP, and TChAP
To benchmark the different chromatin isolation methods, we analyzed the isolated DNA samples and their corresponding negative controls, namely mock samples of ChAP and TChAP performed on wild-type cultures and the DNA sample of a no-antibody ChIP on the E2Fa-HBH-expressing culture, by high-throughput sequencing. The samples were processed by standard Illumina ChIP-seq barcoded library generation protocols and sequenced by multiplexing on an Illumina Genome Analyzer II. For the different samples, between 161,071 and 2,178,951 sequencing reads were uniquely mapped to the five chromosomes of The Arabidopsis Information Resource 9 (TAIR9) genome. This variable number of reads was largely due to the chromatin isolation methods displaying different fractions of reads mapping to the chromosomes and only to a small extent because of differences in the number of input reads and global mapping efficiencies (Supplemental Table S1). For ChAP, the observed high read mapping to the chloroplast genome indicates that biotin tagging is less optimal for TF-binding studies in plants.
E2Fa-HBH-enriched binding sites were identified with the Model-Based Analysis of ChIP-Seq (MACS) peak-calling tool (Zhang et al., 2008). To eliminate possible biases in peak-calling outcome caused by the variable amounts of mapped read data of the different samples, we used a random subsampling strategy, fixing the same number of reads in the different data sets and repeating the peak-calling analyses 100 times, to establish the stability of the peak-calling algorithm in detecting the same enriched locations. Starting with the same number of reads (see “Materials and Methods”), 4,161, 2,221, and 8,365 enriched regions were identified and linked to nearest neighbor/closest annotated genes for ChIP, ChAP, and TChAP, respectively (Table I). Among these, only majority peaks/genes, which are peaks/genes detected in at least half of all subsamples, and the 200 best peaks/genes, as reported by MACS, were retained as high-confidence E2Fa-bound genes in subsequent analyses (Supplemental Tables S2 and S3). Overall, the TChAP method yielded more peaks and more majority genes compared with the other methods (Table I). Additionally, the average MACS peak score, which is a measure for the confidence level of the called peaks, was highest for TChAP (Table I; Supplemental Table S2). By selecting only the 200 best peaks of each chromatin isolation procedure, in order to remove the different number of called peaks, the difference in score and confidence level became even more pronounced in favor of TChAP (Table I; Supplemental Table S3). When all mapped reads were used for MACS peak-calling analysis, a similar trend was obtained, with TChAP delivering more peaks/genes with better peak scores (Supplemental Table S4).
Table I. Number of peaks called over 100 subsamplings of the complete data sets.
The top 200 genes identified by ChIP, ChAP, and TChAP of E2Fa-HBH displayed a very big overlap (Supplemental Fig. S2). Comparison with previous data sets obtained by transcriptome and cis-regulatory element analyses (Vandepoele et al., 2005; Naouar et al., 2009) demonstrated high enrichments for E2Fa-regulated genes and genes containing an E2F motif in the bound regions (E2F motif genes). Together, the high overlap and enrichments support the correctness of the data sets and prove the quality of the three different chromatin isolation methods (Supplemental Fig. S2).
When examining the ChIP, ChAP, and TChAP majority genes, 98% (408 of 415) ChIP and 78% (721 of 918) ChAP genes were also present in the TChAP majority data set, with 310 genes identified in all three procedures defining a core set of E2Fa target genes (Fig. 3A). However, 1,777 genes (68%) of the much larger group of TChAP majority genes were unique. The average confidence level (MACS score) of this specific group of genes was higher than that of all and common (represented in at least two data sets) identified ChIP or ChAP genes, respectively (Fig. 4A; Supplemental Table S5), suggesting that the unique TChAP genes were bona fide E2Fa-bound genes that were missed by ChIP and ChAP because of the lower specificity of these methods. Comparison of the read coverage between the methods, as visualized by GenomeView (Abeel et al., 2012), at the ORC1b and CTF18 promoter E2Fa-binding sites confirmed this asset of tandem chromatin affinity purification sequencing (TChAP-seq; Fig. 3B). As a consequence, both E2Fa-regulated genes (163 genes, 2.4-fold enrichment, P = 3.9e-26) and E2F motif genes (439 genes, 5.7-fold enrichment, P = 5.4e-229) were significantly present among the TChAP-specific majority genes (Fig. 3A). In comparison, the ChIP- and ChAP-specific bound genes were not enriched for E2Fa-regulated genes (for ChIP, one gene, 5-fold, P = 0.17; for ChAP, eight genes, 1-fold, P = 0.47), and only the ChAP-specific genes were significantly enriched for E2F motif genes (for ChIP, two genes, 9-fold, P = 0.017; for ChAP, 19 genes, 2.2-fold, P = 8.7e-4). Moreover, plotting the ChIP, ChAP, and TChAP majority peaks/genes according to descending MACS confidence scores and measuring the fraction of E2Fa-regulated and E2F motif genes revealed that, despite the pattern that lower confidence levels correlated with lower overlap scores, all peaks/genes retained enrichment for these gene sets (Fig. 3C). These properties, together with the global higher MACS scores of TChAP-identified peaks/genes (Table I; Fig. 4A), suggest that the additional E2F locations discovered with TChAP-seq are true, possibly less occupied, binding regions. As a validation, E2Fa binding specificity to 20 TChAP-seq uniquely identified known and putative new E2Fa target regions/genes, sampled throughout the confidence score distribution, was evaluated by quantitative PCR (qPCR) after ChIP, ChAP, and TChAP (Supplemental Table S6). For all, 12, and eight regions, a significant enrichment (more than 2-fold) was detected with TChAP, ChIP, and ChAP qPCR, respectively (Fig. 4B), confirming E2Fa binding, besides with TChAP, of some regions with ChIP and ChAP. Moreover, TChAP displayed improved enrichments relative to negative control regions compared with ChIP and ChAP.
Figure 3.

ChIP, ChAP, and TChAP E2Fa majority peaks/genes. A, Venn diagrams showing overlap among all, the E2Fa-regulated, and the E2F motif majority genes identified through ChIP, ChAP, and TChAP-seq. B, Examples of known E2Fa-binding sites identified in the ChIP, ChAP, and TChAP-seq data. Visual representation is organized in four tracks. Gene structure is indicated with cyan rectangles. The normalized coverage for each of the methods is displayed as a bar chart around a central axis with coverage on the forward and reverse shown in green (up) and blue (down), respectively. Total coverage is indicated in yellow. The coverage scale is the same for all three protocols, and each track has been normalized for total coverage in that protocol, allowing direct comparison. C, Frequency of E2Fa-regulated or E2F motif genes among the ChIP-, ChAP-, and TChAP-identified majority peaks. Peaks are sorted based on descending MACS confidence peak scores. The gray lines depict the random occurrence of an E2Fa-regulated gene in the Arabidopsis genome (left) and the expected frequency of E2F motif genes based on randomized peak sequences (right).
Figure 4.

Evaluation of TChAP-seq binding regions. A, Heat map representation of the MACS scores of ChIP, ChAP, and TChAP-seq-identified binding regions. Per method, the MACS scores were transformed to a range between 0 and 1, making it possible to visually compare the relative scores between the different methods. Regions not called in a data set are depicted white. B, Binding of E2Fa to TChAP-unique identified binding regions, having different confidence scores (Supplemental Table S6), was analyzed by quantitative ChIP/ChAP/TChAP PCR. Besides known E2Fa target genes (#), also new identified E2Fa-bound genes were selected. E2F motif genes are indicated with $. Enrichment of E2Fa binding was normalized using CDKA;1 and UBQ10 control promoter regions. Error bars indicate sd (n = 3).
In summary, the above results indicate that, although many E2Fa target genes were identified by all three methods, a substantial additional set of E2Fa-bound genes were found in the TChAP-seq data set because TChAP gives higher signal-to-noise signals, allowing the genome-wide identification of less prevalent E2Fa-binding sites.
Analysis of TChAP-seq E2Fa Target Genes
For detailed analysis of the E2Fa-binding locations and target genes identified by TChAP-seq, an independent biological replicate experiment was performed. In total, 2,407 majority peaks (92.7%) were confirmed to be enriched in the second experiment and selected as high-confidence E2Fa-binding sites (Supplemental Table S2). Details of the distribution in the Arabidopsis genome of these sites and their annotation to genes are summarized in Table II. Peak locations were determined in relation to the nearest annotated gene. Sixty-two percent of all peaks were located at the 5′ side (intergenic region or untranslated region [UTR]), 25% resided in coding exons or introns, and 13% overlapped with 3′ UTRs or 3′ intergenic regions (Fig. 5A; Table II). Considering 5′ promoter peaks, the median distance from a peak to the transcription start site was 184 bp (Fig. 5B), which is consistent with the role of E2Fa in classical transcriptional regulation. Of all peaks, 94% were assigned to a protein-coding gene and 91% had annotated features within 1,000 bp of the E2F-bound region.
Table II. Summary of E2Fa TChAP-seq peak location and gene annotation.
Figure 5.

Distribution and motif analysis of E2Fa TChAP-seq-identified binding sites. A, Distribution of E2Fa-binding sites in the Arabidopsis genome. CDS, Coding sequence. B, Distance in bp of the 5′ promoter peak summits relative to the transcription start site (TSS) of the nearest gene. C, The E2F motif identified by Regulatory Sequence Analysis Tools peak motifs and its distribution in relation to the peak summits.
Combining this annotation with the transcript profiling data of Naouar et al. (2009) indicates that 393 (16%) E2Fa-bound genes, of which approximately one-third were only retrieved with TChAP, show obvious E2F regulation (4-fold enrichment compared with the expected number of genes; P = 4.1e-155; Table II; Fig. 6A). De novo motif finding using the TChAP peak sequences confirmed that the previously described TTTSSCGC motif (S = G or C) corresponds with the E2F-binding site (Vandepoele et al., 2005). A total of 684 E2Fa-bound regions (28%) contained an E2F motif (6-fold enrichment, P < 1e-150; Table II), and a high-confidence set of 174 E2Fa TChAP targets, comprising 50 TChAP unique genes, contained both genomic properties of E2Fa regulation and motif presence (Fig. 6A).
Figure 6.

Analysis of TChAP-seq E2Fa target genes. A, Venn diagram showing the overlap of the TChAP E2Fa-bound genes with E2Fa-regulated genes. Genes containing an E2F motif in their 1-kb promoter are indicated. In parentheses, the number of E2Fa-bound genes uniquely identified with TChAP is shown. B, Clustering of TChAP (all), TChAP unique, TChAP new, and TChAP E2Fa-regulated genes displaying differential expression (blue, down-regulated; red, up-regulated) in RBRcs mutants. Genes not represented in the sublists are depicted white. C, Enrichment analysis of the TChAP data for DNA repair, cell cycle, cell cycle periodic, G1+S phase-expressed, and G2+M phase-expressed genes. Shown are negative log10 values of the likelihood to obtain an observed fraction of specific genes by change. The vertical line indicates P = 0.004 (Bonferroni-corrected P = 0.05). For gene numbers, see Supplemental Table S7.
Nevertheless, 84% of all TChAP-seq-identified E2Fa-bound genes, hereafter referred to as new E2Fa target genes (2,014 genes), of which the majority (75%) were only identified with TChAP, are not represented in the Naouar et al. (2009) data set. This is in part because this study does not cover all E2Fa targets due to the relatively stringent analysis settings (q-value < 0.05, fold change ≥ 2) used and its confinement to E2Fa-DPa as a transcriptional activator and induced transcripts. Moreover, TF binding in general is often not correlated with transcriptional changes and depends on context-specific regulation by different coactivators and repressors. Exploring other E2Fa-DPa transcriptome reports indeed revealed additional TChAP genes to be E2Fa regulated (Vlieghe et al., 2003; Vandepoele et al., 2005; de Jager et al., 2009), and quantitative reverse transcription (qRT)-PCR analysis of the expression levels of several putative E2Fa targets, not identified in any of the transciptome studies, confirmed transcriptional regulation in E2Fa-DPa-overexpressing Arabidopsis plants (Supplemental Fig. S3; De Veylder et al., 2002). Although, consistent with its activating role, the expression of most E2Fa-bound genes was induced in these additional transcriptome studies (and the qRT-PCR results), several direct targets appeared to be repressed. Recently, RETINOBLASTOMA-RELATED1 (RBR1)-complexed E2Fa has been suggested to act as a transcriptional repressor (Magyar et al., 2012). Exploring microarray data of RBR co-suppression (RBRcs) mutant plants (Gutzat et al., 2011) revealed 551 TChAP genes (23%, P = 7.5e-26), of which 55.4% were not identified with ChIP or ChAP (TChAP unique; Fig. 6B). In addition, 346 (62.8%) of the RBRcs-deregulated TChAP genes, comprising 70.8% TChAP unique ones, represent new E2Fa targets (TChAP new) not represented in the Naouar et al. (2009) data set. This strengthens the biological relevance of the TChAP targets and highlights the significant contribution of both unique and newly identified TChAP genes in revealing the overlap with RBR target genes (Fig. 6B). Curiously, analysis of the expression deregulation of the TChAP genes in RBRcs mutants demonstrated that, whereas the known E2Fa-regulated TChAP genes were almost exclusively up-regulated, as shown previously (Gutzat et al., 2011), a considerable part of the new E2Fa TChAP genes was down-regulated in RBRcs mutants (Fig. 6B). Whether this reflects a repressor function of E2Fa or a common transcriptional role for the E2Fa-RBR complex remains to be studied.
Additional validation of the TChAP data set comes from the observation that 25% of the new TChAP E2Fa-bound genes contain an E2F motif (6-fold enrichment; Fig. 6A). Moreover, expression similarity analysis in five different microarray compendia (see “Materials and Methods”) generated a network comprising 1,735 TChAP genes clustered in gene modules containing a minimum of five genes. Coexpression analysis revealed that 70% of the new and 72% of the unique TChAP genes were grouped within gene modules containing E2Fa-regulated or E2F motif genes, further favoring the relevance of the TChAP-seq results. Finally, enrichment analyses demonstrated that, in agreement with E2Fa function, cell cycle (Van Leene et al., 2010), cell cycle periodic-expressed (Menges et al., 2003), and DNA repair (GO:0006281) genes are strongly represented in the total E2Fa TChAP data set. When subtracting known E2Fa targets (Naouar et al., 2009) or ChIP/ChAP-identified genes, cell cycle-related genes (but excluding DNA repair genes) remained, although to a lesser extent, significantly enriched among both the new and the unique TChAP-identified E2Fa target genes (Fig. 6C; Supplemental Table S7). Integration of the TChAP-seq data with the Arabidopsis cell cycle interactome (Van Leene et al., 2010) generated a network demonstrating binding among several TChAP E2Fa targets and other cell cycle proteins (Supplemental Fig. S4). Remarkably, this protein interaction map comprises mainly new and/or unique TChAP genes. Interestingly, several G2+M-phase periodic-expressed cell cycle genes are present in the network (Supplemental Fig. S4), and subdivision of all, new, and unique TChAP genes in G1+S- or G2+M-phase periodic genes shows enrichment in G2+M phase, suggesting a role of E2Fa in M-phase regulation (Fig. 6C).
Taken together, these analyses demonstrate the quality of the E2Fa TChAP-seq data set and the TChAP uniquely identified target genes and emphasize its strength as an hypothesis-generating tool. Not only did many known E2Fa-regulated genes get identified as direct targets, but many new E2Fa-bound genes point to additional, less characterized functions of the E2Fa TF.
DISCUSSION AND CONCLUSION
In recent years, ChIP-seq has become the gold-standard method for genome-wide detection of binding regions of TFs (Johnson et al., 2007; Robertson et al., 2007). The success of ChIP-seq is crucially dependent on good enrichment of DNA target regions. Enrichment efficiency relies both on antibody specificity and on the prevalence and genomic coverage of the TF of interest. Whereas the tedious generation of high-quality antibodies hampers ChIP throughput, TFs with a limited number of target genes also raise challenges in the ChIP protocol and require sufficient starting material. To overcome these drawbacks, we developed TChAP, which uses ectopic expression of tandem affinity-tagged TFs in Arabidopsis cell suspension cells. Affinity tagging is a commonly used generic ChIP alternative to circumvent the requirement for specific antibodies (de Folter, 2011). One-step purifications, nevertheless, are generally prone to relatively high background levels. Biotin tagging, allowing very-high-stringency purification conditions, is an exception offering an interesting ChAP approach. An important issue regarding its use, however, is the evidence of histones being naturally biotinylated (Zempleni, 2005). Moreover, considering the role of biotin in Arabidopsis as an essential cofactor of the plastidial heteromeric acetyl-CoA carboxylase (Nikolau et al., 2003) and the observed high mapping of our ChAP-seq reads to the chloroplast genome, biotin tagging appears not optimal for TF location studies in plants. Sequential purifications, using tandem affinity tagging, efficiently reduce nonspecific background signals but are technically challenging and suffer from low yields (Rigaut et al., 1999). Nevertheless, the use of different TAP tags in TF location studies in mammalian cell lines has recently been reported (Harada and Nepveu, 2012; Soleimani et al., 2013). Here, a TChAP approach using Arabidopsis cell suspension cultures and the HBH affinity tag system compatible with high-stringency tandem purification of biotinylated TFs was developed and evaluated.
Proof of principle of the TChAP method was shown by studying the E2Fa TF. E2Fa is part of the conserved E2F/DP/RBR pathway regulating cell cycle initiation across higher eukaryotes (Inzé and De Veylder, 2006; van den Heuvel and Dyson, 2008). Arabidopsis encodes eight E2F/DP TFs, which are subdivided into three typical E2Fs (E2Fa, E2Fb, and E2Fc), two dimerization proteins (DPa and DPb), and three atypical E2Fs (E2Fd/DEL2, E2Fe/DEL1, and E2Ff/DEL3; Vandepoele et al., 2002). Overexpression in Arabidopsis of E2Fa together with its dimerization partner DPa induces ectopic divisions at the whole-plant level, severely affecting plant development (De Veylder et al., 2002). Previous transcriptome analyses of E2Fa-DPa-overexpressing plants identified 946 E2Fa-regulated genes, of which 468 genes were designated to be direct E2Fa targets based on the presence of an E2F consensus motif in their promoters (Vandepoele et al., 2005; Naouar et al., 2009).
Comparing these previous data sets with the E2Fa-bound genes identified in this study revealed that 42% (393 of 946) of the E2Fa-regulated genes (Naouar et al., 2009) were represented in the TChAP-seq data set, underlining that they are direct E2Fa targets. The overlap between both data sets resulted in the identification of 219 additional direct E2Fa-regulated genes lacking a consensus E2F motif. On the contrary, 294 E2Fa-regulated genes containing an E2F promoter motif were not represented in the TChAP-seq data. This indicates that, as seen for other TFs, genomic E2F motif occurrence is larger than motif binding and that binding often occurs in nonconsensus motifs (Farnham, 2009), demonstrating the importance of integrating genome-wide transcriptome, cis-regulatory motif, and TF location data for TF target and regulatory network studies.
TChAP evaluation through comparison with the outcome of alternative chromatin isolation methods illustrated the accuracy and power of tandem chromatin purification. TChAP-seq identified many more E2Fa-bound genes in comparison with ChIP or ChAP, among them many known E2Fa-regulated genes. As an example, the identification by TChAP-seq of E2Fa itself, E2Fb, E2Fc, DPa, and DEL3 as direct E2Fa targets confirms the complex interplay among E2Fs/DPs (Sozzani et al., 2006; Naouar et al., 2009; Berckmans et al., 2011; Magyar et al., 2012). The quality of the additional TChAP-specific putative new E2Fa targets was supported through computational analyses (see below). The large difference in the number of E2Fa-bound genes obtained by TChAP, ChIP, and ChAP resulted from differences in enrichment efficiencies, which, as a consequence of the tandem purification and as reflected by both qPCR and MACS peak confidence scores, are superior in TChAP.
Of all the TChAP E2Fa-bound genes, only a few (16%) were described in the Naouar et al. (2009) transcriptome study. Weak correlations between genome location and expression profiling experiments are commonly observed in TF studies (Farnham, 2009; Ferrier et al., 2011). Explanations for this phenomenon are differences in the technology platforms and analysis methods used and context-specific TF target gene regulation (e.g. in different tissues and developmental stages or by different cofactors). In addition, the observed pervasiveness of TF-binding and target regulation discrepancy in many studies illustrates that TF binding in general is often not functional. Nevertheless, considering the differences observed with ChIP and ChAP as well, the concern could be raised that TChAP has a higher false-positive rate. This possibility, however, is unlikely for several reasons. At the level of E2Fa binding, the application of TAP greatly enhances signal-to-noise ratios. This, in combination with the MACS peak calling on subsamples and the majority peak selection strategy, argues for low erroneous peak identification. In agreement with the latter, 92.7% of the majority peaks were reproducibly detected in the biological replicate experiment. Moreover, 25% of the new TChAP genes, not represented in the E2Fa transcriptome data set, were also retrieved with ChIP and/or ChAP. With respect to functional binding, qRT-PCR analysis of E2Fa-DPa-overexpressing plants demonstrated transcriptional regulation of several new TChAP genes, and independent studies reported E2Fa regulation of additional new TChAP targets (Magyar et al., 2005; Sozzani et al., 2006; Chen et al., 2011; Heyman et al., 2011; Lario et al., 2013). Furthermore, the TChAP uniquely identified genes were significantly enriched for E2Fa-regulated genes. Finally, the biological relevance of the TChAP data was computationally strengthened, with new and unique TChAP target genes showing enrichment for E2F elements and cell cycle features and expression network analysis clustering 70% and 72% of them with E2Fa-regulated or E2F motif genes, respectively.
Together, these facts indicate that the TChAP-seq strategy identified many E2Fa-bound genes and, through integration with other data sets and future studies, provides a resource for the construction of the Arabidopsis E2Fa transcriptional regulatory network. Comparing the TChAP-seq data with RBRcs mutant transcript profiling data of Gutzat et al. (2011) isolated 551 genes possibly directly regulated by the E2F/DP/RBR pathway. Among these, 62.8% new TChAP genes display enrichment for microtubule-based process (P = 6.0e-6) and cell cycle (P = 1.2e-6) Gene Ontology categories. The products of these gene categories are important players in mitosis (mitotic cyclins; CDKB1;2), mitotic checkpoints (anaphase-promoting complex subunits; BUB3), and cytokinesis (kinesins; MYB3R4). Although knowledge of E2F function in plants in these processes is scarce, some reports already demonstrated targeting of M-phase-regulating genes by E2Fs (Boudolf et al., 2004; Lammens et al., 2008; Heyman et al., 2011; Magyar et al., 2012). In animals, the multisubunit E2F-RB dREAM (for Drosophila melanogaster RB, E2F, and MYB) complexes are important for mitosis and cytokinesis (Osterloh et al., 2007; Reichert et al., 2010). As components of putative dREAM complexes are conserved in Arabidopsis, E2Fa and RBR, participating in a plant homolog of the dREAM complex, could regulate these processes, although further studies are required to prove this hypothesis.
In conclusion, we have demonstrated that the TChAP method is suitable for TF-DNA interaction studies in plant cell cultures and that its application for the E2Fa TF successfully identified many E2Fa target genes, including a substantial number that could not be retrieved using alternative protocols. Although ectopic expression of tagged proteins can have potential downsides, requiring evaluation of the (preferentially near-endogenous) expression level of the tagged proteins, TChAP has several advantages over traditional ChIP. The use of tandem affinity tagging not only enhances TF target mapping throughput, by circumventing issues related to antibody availability and quality, but also its output, by improving DNA enrichment ratios. The latter also holds true compared with single affinity purifications, because the HBH tag accommodates high-stringency tandem purification. Combined with high-throughput sequencing, TChAP as such enables the identification of novel and less abundant TF-DNA interactions, broadening the scope to TFs that target a very specific set of genes. Conversely, this may allow cost-effective identification of major TF targets with less sequencing. Sequential purification, however, comes at the cost of DNA yield, due to a combination of lower nonspecific background DNA and protein-DNA complex recovery. As a consequence, TChAP required 3-fold more initial cell material than ChIP to obtain a similar DNA yield amenable for sequencing. Although currently addressed in cell suspension cultures, which provide an unlimited supply of cells and allow the study of various (Pauwels et al., 2010; Fernández-Calvo et al., 2011; Bassard et al., 2012; Antoni et al., 2013) but not all (e.g. developmental) pathways, TChAP-seq represents a universal strategy that should be applicable to plants. We anticipate that ongoing advances in library preparation procedures compatible with low DNA yields (Adli and Bernstein, 2011; Bowman et al., 2013) will allow TChAP-seq in plants, where its benefits can enhance insights in both global and, in due time, cell type-specific gene regulation, if combined with cell sorting or microdissection (Birnbaum et al., 2003; Nakazono et al., 2003).
MATERIALS AND METHODS
Constructs, Plant Material, Transformation, and Growth Conditions
The HBH tag sequence was amplified by PCR using the pFA6HBH-KanMX6 plasmid as template (Tagwerker et al., 2006) and cloned into the pDONRP2RP3 entry vector by a Gateway BP recombination reaction according to the manufacturer’s instructions (Invitrogen). The P35S:E2Fa-HBH-containing plant transformation vector was obtained by a Multisite Gateway LR reaction between pEntryL4R1-P35S, pEntryL1L2-E2Fa, and pEntryR2L3-HBH and the destination vector pK7GW43D (Van Leene et al., 2007). The construct was transferred into the Agrobacterium tumefaciens C58C1RifR strain harboring plasmid pMP90 for transformation of Arabidopsis (Arabidopsis thaliana) cell suspension cultures. Maintenance and stable transformation of Arabidopsis PSB-D cell suspension cultures were done according to Van Leene et al. (2007).
Arabidopsis ecotype Columbia-0 plants were grown under long-day conditions (16 h of light and 8 h of darkness) at 22°C on one-half-strength Murashige and Skoog agar plates (Valvekens et al., 1988). The E2Fa-DPa-overexpressing plants have been described previously (De Veylder et al., 2002).
Protein Extraction, SDS-PAGE, and Immunoblotting
Two-day-old PSB-D cell suspension cultures were harvested, used immediately or snap frozen in liquid nitrogen, and stored at −70°C. Proteins were extracted after grinding in liquid nitrogen in homogenization buffer (25 mm Tris-Cl, pH 7.6, 75 mm NaCl, 15 mm MgCl2, 15 mm EGTA, 15 mm p-nitrophenylphosphate, 60 mm β-glycerophosphate, 1 mm dithiothreitol, 0.1% [v/v] Nonidet P-40, 0.1 mm Na3VO4, 1 mm NaF, and protease inhibitor cocktail P9599 [Sigma-Aldrich]).
Proteins were separated by 10% SDS-PAGE and blotted onto Immobilon-P membranes (Millipore). Filters were blocked in 3% (w/v) milk powder in 25 mm Tris-Cl (pH 8), 150 mm NaCl, and 0.05% Tween 20 for at least 1 h at room temperature and incubated overnight at 4°C with E2Fa (1:2,500; Takahashi et al., 2008), His (1:2,000; Qiagen), or streptavidin-HRP (1:4,000; Amersham Biosciences) antibody in blocking buffer. Antigen-antibody complexes were detected with HRP-conjugated IgG diluted 1:10,000 (Amersham Biosciences) with a chemiluminescence system (Perkin-Elmer). Purification efficiency or bait recovery was estimated from western-blot signal intensities using the Bio-Rad Image Lab 3.0 software.
RNA Isolation, Complementary DNA Preparation, and qRT-PCR
RNA was extracted using the RNeasy Plant Mini Kit (Qiagen) and DNase I treated (Promega) prior to complementary DNA (cDNA) synthesis. cDNA was prepared from DNase I-treated total RNA with the iScript cDNA Synthesis Kit (Bio-Rad) according to the manufacturer’s instructions. Relative transcript abundance of selected genes (for a list of genes and the primers used, see Supplemental Table S8) was determined using the Roche LightCycler 480 system and the LC480 SYBR Green I Master Kit (Roche Diagnostics). Measurements were taken for two biological and three technical repeats. The amplification data were analyzed using the second derivative maximum method, and resulting cycle threshold values were converted into relative expression values using the comparative cycle threshold method.
ChIP, ChAP, and TChAP
Purifications were performed with between 0.5 and 1.5 L of cell cultures. Two-day-old exponentially growing cell cultures were treated with 0.75% formaldehyde for 10 min. Cross linking was stopped by the addition of 0.25 m Gly during 10 min. Cells were filtered, washed with phosphate-buffered saline, pH 7.2 (0.14 m NaCl, 2.7 mm KCl, and 10 mm PO43−), weighted and frozen, and stored at −80°C in 4-g packages. Four grams of harvested material was ground in liquid nitrogen and solubilized in 16 mL of NLB buffer (50 mm HEPES, pH 7.5, 150 mm NaCl, 0.5 mm EDTA, 1% Triton X-100, 0.1% sodium deoxycholate, 0.1% SDS, 1 µg mL−1 pepstatin A, 1 µg mL−1 aprotinin, 1 µg mL−1 leupeptin, and 1 mm phenylmethylsulfonyl fluoride) with an Ultra-Turrax T25 mixer. Chromatin was fragmented on ice with a probe sonicator to obtain approximately 200- to 800-bp fragments. After sonication, the suspension was centrifuged twice for 20 min at 16,000 rpm. Extract from approximately 4 g of harvested cells, containing 200 mg of protein as determined by using the Bio-Rad protein assay kit, was used as input for ChIP and ChAP. For TChAP, 12 g of cell material was used, as three first-step purifications, on 200 mg of input protein, were pooled for the second affinity purification.
For traditional ChIP, extract was precleared with 100 µL of salmon sperm DNA/protein A agarose beads (Millipore) for 1 h. The precleared supernatant was incubated overnight with 12 µL of anti-E2Fa antibody (Takahashi et al., 2008) or no antibody (control). Afterward, the supernatant was mixed with 100 µL of salmon sperm DNA/protein A agarose beads and incubated for 3 h on a rotating wheel. Finally, the beads were washed with 10 mL of NLB buffer, 1 mL of low-salt buffer (20 mm Tris-Cl, pH 8, 150 mm NaCl, 2 mm EDTA, 1% Triton X-100, and 0.1% SDS), 1 mL of high-salt buffer (20 mm Tris-Cl, pH 8, 500 mm NaCl, 2 mm EDTA, 1% Triton X-100, and 0.1% SDS), and 1 mL of LiCl buffer (10 mm Tris-Cl, pH 8, 0.25 m LiCl, 1 mm EDTA, 1% sodium deoxycholate, and 1% Nonidet P-40).
For ChAP, wild-type and E2Fa-HBH-overexpressing extract was incubated overnight on a rotating wheel with 100 µL of streptavidin-Sepharose (GE Healthcare). Beads were washed with 10 mL of NLB and three times with 1 mL of NLB containing 750 mm NaCl and increasing SDS concentrations (0.1%, 0.5%, and 1%).
For TChAP, extract was adjusted to 10 mm imidazole and incubated overnight on a rotating wheel with 300 µL of Ni-NTA Superflow (Qiagen). The NiNTA resin was washed three times with 10 mL of NLB + 10 mm imidazole, and complexes were eluted two times with 1.5 mL of NLB + 150 mm imidazole. Next, the eluates from three NiNTA purifications were pooled on 100 µL of streptavidin-Sepharose. After 3 h of incubation on a rotating wheel, the streptavidin-Sepharose beads were washed with 10 mL of NLB + 10 mm imidazole and three times with 1 mL of NLB containing 750 mm NaCl and increasing SDS concentrations (0.1%, 0.5%, and 1%).
Finally, the ChIP, ChAP, and TChAP beads were washed with 15 mL of 10 mm Tris-Cl, pH 8, 500 mm NaCl, and 1 mm EDTA, and the bound E2Fa-DNA complexes were eluted and reverse cross linked by incubation overnight at 65°C on a rotating wheel in 1 mL of 10 mm Tris-Cl, pH 8, 1 mm EDTA, 0.5 m NaCl, 1% SDS, and 0.5 µL of RNase A (100 mg mL−1). Next, the eluates were incubated with 100 µg of proteinase K for 2 h at 42°C on a rotating wheel, and the DNA was extracted by phenol/chloroform/isoamyl alcohol followed by purification using the Qiaquick PCR purification kit. DNA quantification by the Quant-iT dsDNA High Sensitivity Kit (Invitrogen) yielded approximately 15, 200, and 10 to 12 ng of E2Fa-bound DNA with ChIP, ChAP, and TChAP, respectively.
Illumina Sequencing
Ten nanograms of DNA was end repaired and A tailed as described in the Illumina ChIP-seq standard protocol. It was then ligated to customized adapters, which contain a five-base barcode, before the final library was obtained by PCR amplification with the standard Illumina primers. The library was verified by cloning and sequencing of a few constructs and then quantified by Qubit (Invitrogen). The run was performed for 38 cycles on an Illumina Genome Analyzer IIx using 10 pm final concentration of DNA. The sample sequences are attributed to each sample according to their barcode (first five bases) with one mismatch allowed. For pooled samples with only two different bases in their barcode, the selected reads in the data sets are screened for shared read (attributed to both samples at first). They are then removed from both data sets. Therefore, the data sets provided contain only sequences attributed without ambiguity to only one sample.
Data Analysis
Read mapping was done with BWA version 0.5.8a (Li and Durbin, 2009) using default settings. Reads that did not map uniquely to one of the five chromosomes were discarded from further analysis. Mapping was done against the TAIR9 version of the Arabidopsis genome (http://arabidopsis.org).
Peak calling was performed using MACS version 1.3.7 (Zhang et al., 2008) with default settings, except the MFOLD parameter, which was lowered to 6, and the effective genome size, which was set to 90 Mb. The MACS confidence value is defined as −10 × log10(P value). Higher values indicate higher confidence predictions. Subsampling was done without replacement from the set of reads uniquely mapping to the five chromosomes. The target ratio between ChIP/ChAP/TChAP and control reads is 3:1. The ratio 3:1 was derived as the closest ratio to all of the complete sequencing sets. The data sets were down sampled to 600,000 reads total (150,000 control reads and 450,000 ChIP/ChAP/TChAP reads) to accommodate the smallest data set.
Peak annotation was performed by overlapping the peak summits reported by MACS with the TAIR9 annotation. To define majority genes, the peak annotations from the different subsamples were combined, and only those genes, together with their maximum peak score, recovered in 50% or more of the samples were retained. E2F motif analysis was performed with dna-pattern using the motif consensus sequence TTTSSCGC defined by Naouar et al. (2009).
For de novo motif finding, we used peak-motifs (http://rsat.ulb.ac.be/tutorials/tut_peak-motifs.html) using default settings (Thomas-Chollier et al., 2012). To calculate the E2F motif enrichment in the E2Fa-bound regions (Fig. 3), the background motif frequency (4.34%) was estimated using reshuffled sequences with the same length and nucleotide composition as the bound regions defined by MACS. P values for enrichment analysis were calculated using the hypergeometric distribution.
Based on five expression compendia (Development, Whole Plant, Stress, Hormone, and GenMod_rma) from CORNET (De Bodt et al., 2010, 2012), a consensus coexpression network was generated. Expression similarity was measured using the Pearson correlation coefficient, and a relative 95th percentile cutoff was applied to retain coexpressed gene pairs (Vandepoele et al., 2009). A global network was constructed by merging all coexpressed gene pairs of the different compendia, and gene clusters were detected using the CAST algorithm (using the lowest 95th percentile Pearson correlation coefficient cutoff, 0.42, and requiring at least five genes per cluster; Vandepoele et al., 2009). Functional Gene Ontology enrichment analysis was performed using PLAZA 2.0 (Proost et al., 2009).
Quantitative ChIP/ChAP/TChAP PCR
qPCR experiments were performed on total, ChIP, ChAP, and TChAP isolated genomic DNA from E2Fa-HBH-overexpressing and wild-type PSB-D cultures. qPCR experiments were done as technical triplicates on equal concentrations of DNA using the Roche LightCycler 480 system and the LC480 SYBR Green I Master Kit (Roche Diagnostics). Primers used for PCR amplification were designed surrounding the position of maximum height in the corresponding peak (i.e. the peak center) identified in the sequencing experiments using Primer-BLAST (http://www.ncbi.nlm.nih.gov/tools/primer-blast/; Supplemental Table S9). The fold enrichment of E2Fa binding was normalized using two (CDKA;1 and UBQ10) control promoter regions or total input DNA.
The data discussed in this article have been deposited in the National Center for Biotechnology Information Gene Expression Omnibus (Edgar et al., 2002) and are accessible through GEO Series accession number GSE53422 (http://www.ncbi.nlm.nih.gov/geo/query/acc.cgi?acc=GSE53422).
Supplemental Data
The following materials are available in the online version of this article.
Supplemental Figure S1. ChIP, ChAP, and TChAP DNA qPCR analysis.
Supplemental Figure S2. Comparison of ChIP, ChAP, and TChAP top 200 genes.
Supplemental Figure S3. Validation of new E2Fa targets.
Supplemental Figure S4. Subnetwork of the cell cycle interactome representing the part containing TChAP-seq E2Fa target genes.
Supplemental Table S1. Summary of sequencing and mapping results.
Supplemental Table S2. Majority ChIP, ChAP, and TChAP gene lists.
Supplemental Table S3. Best 200 (top 200 genes) ChIP, ChAP, and TChAP lists.
Supplemental Table S4. Summary of MACS analysis using all mapped reads.
Supplemental Table S5. Median peak scores of all, shared, and unique ChIP, ChAP, and TChAP majority peaks.
Supplemental Table S6. TChAP-seq unique identified target genes.
Supplemental Table S7. Enrichment analysis: gene numbers.
Supplemental Table S8. List of primer sequences used for qRT-PCR analysis.
Supplemental Table S9. List of primer sequences used for ChIP/ChAP/TChAP qPCR assays.
Acknowledgments
We thank Jens Hollunder, Steven Maere, and the members of the functional proteomics group for assistance and useful suggestions, Peter Kaiser for providing the pFA6HBH-KanMX6 plasmid, Lieven De Veylder for critical reading of the manuscript, and Annick Bleys for help in preparing it.
Glossary
- TF
transcription factor
- ChIP
chromatin immunoprecipitation
- ChIP-seq
chromatin immunoprecipitation sequencing
- TAP
tandem affinity purification
- TChAP
tandem chromatin affinity purification
- ChAP
chromatin affinity purification
- HBH
hexa-histidine
- HRP
horseradish peroxidase
- NiNTA
nickel-nitrilotriacetic acid agarose
- TAIR9
The Arabidopsis Information Resource 9
- MACS
Model-Based Analysis of ChIP-Seq
- TChAP-seq
tandem chromatin affinity purification sequencing
- qPCR
quantitative PCR
- UTR
untranslated region
- qRT
quantitative reverse transcription
- cDNA
complementary DNA
- NLB
50 mm HEPES, pH 7.5, 150 mm NaCl, 0.5 mm EDTA, 1% Triton X-100, 0.1% sodium deoxycholate, 0.1% SDS, 1 µg mL−1 pepstatin A, 1 µg mL−1 aprotinin, 1 µg mL−1 leupeptin, and 1 mm phenylmethylsulfonyl fluoride
Footnotes
This work was supported by the Bijzonder Onderzoeksfonds Methusalem Project (grant no. BOF08/01M00408) and the multidisciplinary research partnership project Bioinformatics: From Nucleotides to Networks (grant no. 01MR0310W) of Ghent University, by the Agency for Innovation by Science and Technology in Flanders (fellowships to A.V. and K.S.H.), and by the Research Foundation-Flanders (fellowships to T.A. and J.V.L.).
Present address: Broad Institute of Massachusetts Institute of Technology and Harvard University, Cambridge, MA 02142.
These authors contributed equally to the article.
The online version of this article contains Web-only data.
Articles can be viewed online without a subscription.
References
- Abeel T, Van Parys T, Saeys Y, Galagan J, Van de Peer Y. (2012) GenomeView: a next-generation genome browser. Nucleic Acids Res 40: e12. [DOI] [PMC free article] [PubMed] [Google Scholar]
- Acevedo LG, Iniguez AL, Holster HL, Zhang X, Green R, Farnham PJ. (2007) Genome-scale ChIP-chip analysis using 10,000 human cells. Biotechniques 43: 791–797 [DOI] [PMC free article] [PubMed] [Google Scholar]
- Adli M, Bernstein BE. (2011) Whole-genome chromatin profiling from limited numbers of cells using nano-ChIP-seq. Nat Protoc 6: 1656–1668 [DOI] [PMC free article] [PubMed] [Google Scholar]
- Antoni R, Gonzalez-Guzman M, Rodriguez L, Peirats-Llobet M, Pizzio GA, Fernandez MA, De Winne N, De Jaeger G, Dietrich D, Bennett MJ, et al. (2013) PYRABACTIN RESISTANCE1-LIKE8 plays an important role for the regulation of abscisic acid signaling in root. Plant Physiol 161: 931–941 [DOI] [PMC free article] [PubMed] [Google Scholar]
- Bassard JE, Richert L, Geerinck J, Renault H, Duval F, Ullmann P, Schmitt M, Meyer E, Mutterer J, Boerjan W, et al. (2012) Protein-protein and protein-membrane associations in the lignin pathway. Plant Cell 24: 4465–4482 [DOI] [PMC free article] [PubMed] [Google Scholar]
- Berckmans B, Lammens T, Van Den Daele H, Magyar Z, Bögre L, De Veylder L. (2011) Light-dependent regulation of DEL1 is determined by the antagonistic action of E2Fb and E2Fc. Plant Physiol 157: 1440–1451 [DOI] [PMC free article] [PubMed] [Google Scholar]
- Birnbaum K, Shasha DE, Wang JY, Jung JW, Lambert GM, Galbraith DW, Benfey PN. (2003) A gene expression map of the Arabidopsis root. Science 302: 1956–1960 [DOI] [PubMed] [Google Scholar]
- Boudolf V, Vlieghe K, Beemster GT, Magyar Z, Torres Acosta JA, Maes S, Van Der Schueren E, Inzé D, De Veylder L. (2004) The plant-specific cyclin-dependent kinase CDKB1;1 and transcription factor E2Fa-DPa control the balance of mitotically dividing and endoreduplicating cells in Arabidopsis. Plant Cell 16: 2683–2692 [DOI] [PMC free article] [PubMed] [Google Scholar]
- Bowler C, Benvenuto G, Laflamme P, Molino D, Probst AV, Tariq M, Paszkowski J. (2004) Chromatin techniques for plant cells. Plant J 39: 776–789 [DOI] [PubMed] [Google Scholar]
- Bowman SK, Simon MD, Deaton AM, Tolstorukov M, Borowsky ML, Kingston RE. (2013) Multiplexed Illumina sequencing libraries from picogram quantities of DNA. BMC Genomics 14: 466. [DOI] [PMC free article] [PubMed] [Google Scholar]
- Chen HC, Hwang SG, Chen SM, Shii CT, Cheng WH. (2011) ABA-mediated heterophylly is regulated by differential expression of 9-cis-epoxycarotenoid dioxygenase 3 in lilies. Plant Cell Physiol 52: 1806–1821 [DOI] [PubMed] [Google Scholar]
- Dahl JA, Collas P. (2008) A rapid micro chromatin immunoprecipitation assay (microChIP). Nat Protoc 3: 1032–1045 [DOI] [PubMed] [Google Scholar]
- De Bodt S, Carvajal D, Hollunder J, Van den Cruyce J, Movahedi S, Inzé D. (2010) CORNET: a user-friendly tool for data mining and integration. Plant Physiol 152: 1167–1179 [DOI] [PMC free article] [PubMed] [Google Scholar]
- De Bodt S, Hollunder J, Nelissen H, Meulemeester N, Inzé D. (2012) CORNET 2.0: integrating plant coexpression, protein-protein interactions, regulatory interactions, gene associations and functional annotations. New Phytol 195: 707–720 [DOI] [PubMed] [Google Scholar]
- de Folter S (2011) Protein tagging for chromatin immunoprecipitation from Arabidopsis Methods Mol Biol 678: 199–210 [DOI] [PubMed] [Google Scholar]
- de Jager SM, Scofield S, Huntley RP, Robinson AS, den Boer BG, Murray JA. (2009) Dissecting regulatory pathways of G1/S control in Arabidopsis: common and distinct targets of CYCD3;1, E2Fa and E2Fc. Plant Mol Biol 71: 345–365 [DOI] [PubMed] [Google Scholar]
- De Veylder L, Beeckman T, Beemster GT, de Almeida Engler J, Ormenese S, Maes S, Naudts M, Van Der Schueren E, Jacqmard A, Engler G, et al. (2002) Control of proliferation, endoreduplication and differentiation by the Arabidopsis E2Fa-DPa transcription factor. EMBO J 21: 1360–1368 [DOI] [PMC free article] [PubMed] [Google Scholar]
- Edgar R, Domrachev M, Lash AE. (2002) Gene Expression Omnibus: NCBI gene expression and hybridization array data repository. Nucleic Acids Res 30: 207–210 [DOI] [PMC free article] [PubMed] [Google Scholar]
- Farnham PJ. (2009) Insights from genomic profiling of transcription factors. Nat Rev Genet 10: 605–616 [DOI] [PMC free article] [PubMed] [Google Scholar]
- Fernández-Calvo P, Chini A, Fernández-Barbero G, Chico JM, Gimenez-Ibanez S, Geerinck J, Eeckhout D, Schweizer F, Godoy M, Franco-Zorrilla JM, et al. (2011) The Arabidopsis bHLH transcription factors MYC3 and MYC4 are targets of JAZ repressors and act additively with MYC2 in the activation of jasmonate responses. Plant Cell 23: 701–715 [DOI] [PMC free article] [PubMed] [Google Scholar]
- Ferrier T, Matus JT, Jin J, Riechmann JL. (2011) Arabidopsis paves the way: genomic and network analyses in crops. Curr Opin Biotechnol 22: 260–270 [DOI] [PubMed] [Google Scholar]
- Gendrel AV, Lippman Z, Martienssen R, Colot V. (2005) Profiling histone modification patterns in plants using genomic tiling microarrays. Nat Methods 2: 213–218 [DOI] [PubMed] [Google Scholar]
- Goren A, Ozsolak F, Shoresh N, Ku M, Adli M, Hart C, Gymrek M, Zuk O, Regev A, Milos PM, et al. (2010) Chromatin profiling by directly sequencing small quantities of immunoprecipitated DNA. Nat Methods 7: 47–49 [DOI] [PMC free article] [PubMed] [Google Scholar]
- Guerrero C, Tagwerker C, Kaiser P, Huang L. (2006) An integrated mass spectrometry-based proteomic approach: quantitative analysis of tandem affinity-purified in vivo cross-linked protein complexes (QTAX) to decipher the 26 S proteasome-interacting network. Mol Cell Proteomics 5: 366–378 [DOI] [PubMed] [Google Scholar]
- Gutzat R, Borghi L, Fütterer J, Bischof S, Laizet Y, Hennig L, Feil R, Lunn J, Gruissem W. (2011) RETINOBLASTOMA-RELATED PROTEIN controls the transition to autotrophic plant development. Development 138: 2977–2986 [DOI] [PubMed] [Google Scholar]
- Harada R, Nepveu A (2012) Chromatin affinity purification. Methods Mol Biol 809: 237–253 [DOI] [PubMed] [Google Scholar]
- Harbison CT, Gordon DB, Lee TI, Rinaldi NJ, Macisaac KD, Danford TW, Hannett NM, Tagne JB, Reynolds DB, Yoo J, et al. (2004) Transcriptional regulatory code of a eukaryotic genome. Nature 431: 99–104 [DOI] [PMC free article] [PubMed] [Google Scholar]
- Heyman J, Van den Daele H, De Wit K, Boudolf V, Berckmans B, Verkest A, Alvim Kamei CL, De Jaeger G, Koncz C, De Veylder L. (2011) Arabidopsis ULTRAVIOLET-B-INSENSITIVE4 maintains cell division activity by temporal inhibition of the anaphase-promoting complex/cyclosome. Plant Cell 23: 4394–4410 [DOI] [PMC free article] [PubMed] [Google Scholar]
- Inzé D, De Veylder L. (2006) Cell cycle regulation in plant development. Annu Rev Genet 40: 77–105 [DOI] [PubMed] [Google Scholar]
- Johnson DS, Mortazavi A, Myers RM, Wold B. (2007) Genome-wide mapping of in vivo protein-DNA interactions. Science 316: 1497–1502 [DOI] [PubMed] [Google Scholar]
- Kaufmann K, Muiño JM, Østerås M, Farinelli L, Krajewski P, Angenent GC. (2010) Chromatin immunoprecipitation (ChIP) of plant transcription factors followed by sequencing (ChIP-SEQ) or hybridization to whole genome arrays (ChIP-CHIP). Nat Protoc 5: 457–472 [DOI] [PubMed] [Google Scholar]
- Kim J, Cantor AB, Orkin SH, Wang J. (2009) Use of in vivo biotinylation to study protein-protein and protein-DNA interactions in mouse embryonic stem cells. Nat Protoc 4: 506–517 [DOI] [PubMed] [Google Scholar]
- Kim J, Chu J, Shen X, Wang J, Orkin SH. (2008) An extended transcriptional network for pluripotency of embryonic stem cells. Cell 132: 1049–1061 [DOI] [PMC free article] [PubMed] [Google Scholar]
- Kim TH, Ren B. (2006) Genome-wide analysis of protein-DNA interactions. Annu Rev Genomics Hum Genet 7: 81–102 [DOI] [PubMed] [Google Scholar]
- Kulyyassov A, Shoaib M, Ogryzko V. (2011) Use of in vivo biotinylation for chromatin immunoprecipitation. Curr Protoc Cell Biol Chapter 17: Unit17.12. [DOI] [PubMed] [Google Scholar]
- Kuo MH, Allis CD. (1999) In vivo cross-linking and immunoprecipitation for studying dynamic protein:DNA associations in a chromatin environment. Methods 19: 425–433 [DOI] [PubMed] [Google Scholar]
- Lammens T, Boudolf V, Kheibarshekan L, Zalmas LP, Gaamouche T, Maes S, Vanstraelen M, Kondorosi E, La Thangue NB, Govaerts W, et al. (2008) Atypical E2F activity restrains APC/CCCS52A2 function obligatory for endocycle onset. Proc Natl Acad Sci USA 105: 14721–14726 [DOI] [PMC free article] [PubMed] [Google Scholar]
- Lario LD, Ramirez-Parra E, Gutierrez C, Spampinato CP, Casati P. (2013) ANTI-SILENCING FUNCTION1 proteins are involved in ultraviolet-induced DNA damage repair and are cell cycle regulated by E2F transcription factors in Arabidopsis. Plant Physiol 162: 1164–1177 [DOI] [PMC free article] [PubMed] [Google Scholar]
- Li H, Durbin R. (2009) Fast and accurate short read alignment with Burrows-Wheeler transform. Bioinformatics 25: 1754–1760 [DOI] [PMC free article] [PubMed] [Google Scholar]
- Magyar Z, De Veylder L, Atanassova A, Bakó L, Inzé D, Bögre L. (2005) The role of the Arabidopsis E2FB transcription factor in regulating auxin-dependent cell division. Plant Cell 17: 2527–2541 [DOI] [PMC free article] [PubMed] [Google Scholar]
- Magyar Z, Horváth B, Khan S, Mohammed B, Henriques R, De Veylder L, Bakó L, Scheres B, Bögre L. (2012) Arabidopsis E2FA stimulates proliferation and endocycle separately through RBR-bound and RBR-free complexes. EMBO J 31: 1480–1493 [DOI] [PMC free article] [PubMed] [Google Scholar]
- Menges M, Hennig L, Gruissem W, Murray JA. (2003) Genome-wide gene expression in an Arabidopsis cell suspension. Plant Mol Biol 53: 423–442 [DOI] [PubMed] [Google Scholar]
- Nakazono M, Qiu F, Borsuk LA, Schnable PS. (2003) Laser-capture microdissection, a tool for the global analysis of gene expression in specific plant cell types: identification of genes expressed differentially in epidermal cells or vascular tissues of maize. Plant Cell 15: 583–596 [DOI] [PMC free article] [PubMed] [Google Scholar]
- Naouar N, Vandepoele K, Lammens T, Casneuf T, Zeller G, van Hummelen P, Weigel D, Rätsch G, Inzé D, Kuiper M, et al. (2009) Quantitative RNA expression analysis with Affymetrix Tiling 1.0R arrays identifies new E2F target genes. Plant J 57: 184–194 [DOI] [PubMed] [Google Scholar]
- Nikolau BJ, Ohlrogge JB, Wurtele ES. (2003) Plant biotin-containing carboxylases. Arch Biochem Biophys 414: 211–222 [DOI] [PubMed] [Google Scholar]
- O’Neill LP, VerMilyea MD, Turner BM. (2006) Epigenetic characterization of the early embryo with a chromatin immunoprecipitation protocol applicable to small cell populations. Nat Genet 38: 835–841 [DOI] [PubMed] [Google Scholar]
- Osterloh L, von Eyss B, Schmit F, Rein L, Hübner D, Samans B, Hauser S, Gaubatz S. (2007) The human synMuv-like protein LIN-9 is required for transcription of G2/M genes and for entry into mitosis. EMBO J 26: 144–157 [DOI] [PMC free article] [PubMed] [Google Scholar]
- Park PJ. (2009) ChIP-seq: advantages and challenges of a maturing technology. Nat Rev Genet 10: 669–680 [DOI] [PMC free article] [PubMed] [Google Scholar]
- Pauwels L, Barbero GF, Geerinck J, Tilleman S, Grunewald W, Pérez AC, Chico JM, Bossche RV, Sewell J, Gil E, et al. (2010) NINJA connects the co-repressor TOPLESS to jasmonate signalling. Nature 464: 788–791 [DOI] [PMC free article] [PubMed] [Google Scholar]
- Proost S, Van Bel M, Sterck L, Billiau K, Van Parys T, Van de Peer Y, Vandepoele K. (2009) PLAZA: a comparative genomics resource to study gene and genome evolution in plants. Plant Cell 21: 3718–3731 [DOI] [PMC free article] [PubMed] [Google Scholar]
- Reichert N, Wurster S, Ulrich T, Schmitt K, Hauser S, Probst L, Götz R, Ceteci F, Moll R, Rapp U, et al. (2010) Lin9, a subunit of the mammalian DREAM complex, is essential for embryonic development, for survival of adult mice, and for tumor suppression. Mol Cell Biol 30: 2896–2908 [DOI] [PMC free article] [PubMed] [Google Scholar]
- Rigaut G, Shevchenko A, Rutz B, Wilm M, Mann M, Séraphin B. (1999) A generic protein purification method for protein complex characterization and proteome exploration. Nat Biotechnol 17: 1030–1032 [DOI] [PubMed] [Google Scholar]
- Robertson G, Hirst M, Bainbridge M, Bilenky M, Zhao Y, Zeng T, Euskirchen G, Bernier B, Varhol R, Delaney A, et al. (2007) Genome-wide profiles of STAT1 DNA association using chromatin immunoprecipitation and massively parallel sequencing. Nat Methods 4: 651–657 [DOI] [PubMed] [Google Scholar]
- Saleh A, Alvarez-Venegas R, Avramova Z. (2008) An efficient chromatin immunoprecipitation (ChIP) protocol for studying histone modifications in Arabidopsis plants. Nat Protoc 3: 1018–1025 [DOI] [PubMed] [Google Scholar]
- Soleimani VD, Palidwor GA, Ramachandran P, Perkins TJ, Rudnicki MA. (2013) Chromatin tandem affinity purification sequencing. Nat Protoc 8: 1525–1534 [DOI] [PMC free article] [PubMed] [Google Scholar]
- Sozzani R, Maggio C, Varotto S, Canova S, Bergounioux C, Albani D, Cella R. (2006) Interplay between Arabidopsis activating factors E2Fb and E2Fa in cell cycle progression and development. Plant Physiol 140: 1355–1366 [DOI] [PMC free article] [PubMed] [Google Scholar]
- Tagwerker C, Flick K, Cui M, Guerrero C, Dou Y, Auer B, Baldi P, Huang L, Kaiser P. (2006) A tandem affinity tag for two-step purification under fully denaturing conditions: application in ubiquitin profiling and protein complex identification combined with in vivo cross-linking. Mol Cell Proteomics 5: 737–748 [DOI] [PubMed] [Google Scholar]
- Takahashi N, Lammens T, Boudolf V, Maes S, Yoshizumi T, De Jaeger G, Witters E, Inzé D, De Veylder L. (2008) The DNA replication checkpoint aids survival of plants deficient in the novel replisome factor ETG1. EMBO J 27: 1840–1851 [DOI] [PMC free article] [PubMed] [Google Scholar]
- Tardiff DF, Abruzzi KC, Rosbash M. (2007) Protein characterization of Saccharomyces cerevisiae RNA polymerase II after in vivo cross-linking. Proc Natl Acad Sci USA 104: 19948–19953 [DOI] [PMC free article] [PubMed] [Google Scholar]
- Thomas-Chollier M, Herrmann C, Defrance M, Sand O, Thieffry D, van Helden J. (2012) RSAT peak-motifs: motif analysis in full-size ChIP-seq datasets. Nucleic Acids Res 40: e31. [DOI] [PMC free article] [PubMed] [Google Scholar]
- Valvekens D, Montagu MV, Van Lijsebettens M. (1988) Agrobacterium tumefaciens-mediated transformation of Arabidopsis thaliana root explants by using kanamycin selection. Proc Natl Acad Sci USA 85: 5536–5540 [DOI] [PMC free article] [PubMed] [Google Scholar]
- van den Heuvel S, Dyson NJ. (2008) Conserved functions of the pRB and E2F families. Nat Rev Mol Cell Biol 9: 713–724 [DOI] [PubMed] [Google Scholar]
- Vandepoele K, Quimbaya M, Casneuf T, De Veylder L, Van de Peer Y. (2009) Unraveling transcriptional control in Arabidopsis using cis-regulatory elements and coexpression networks. Plant Physiol 150: 535–546 [DOI] [PMC free article] [PubMed] [Google Scholar]
- Vandepoele K, Raes J, De Veylder L, Rouzé P, Rombauts S, Inzé D. (2002) Genome-wide analysis of core cell cycle genes in Arabidopsis. Plant Cell 14: 903–916 [DOI] [PMC free article] [PubMed] [Google Scholar]
- Vandepoele K, Vlieghe K, Florquin K, Hennig L, Beemster GT, Gruissem W, Van de Peer Y, Inzé D, De Veylder L. (2005) Genome-wide identification of potential plant E2F target genes. Plant Physiol 139: 316–328 [DOI] [PMC free article] [PubMed] [Google Scholar]
- Van Leene J, Hollunder J, Eeckhout D, Persiau G, Van De Slijke E, Stals H, Van Isterdael G, Verkest A, Neirynck S, Buffel Y, et al. (2010) Targeted interactomics reveals a complex core cell cycle machinery in Arabidopsis thaliana. Mol Syst Biol 6: 397. [DOI] [PMC free article] [PubMed] [Google Scholar]
- Van Leene J, Stals H, Eeckhout D, Persiau G, Van De Slijke E, Van Isterdael G, De Clercq A, Bonnet E, Laukens K, Remmerie N, et al. (2007) A tandem affinity purification-based technology platform to study the cell cycle interactome in Arabidopsis thaliana. Mol Cell Proteomics 6: 1226–1238 [DOI] [PubMed] [Google Scholar]
- Van Leene J, Witters E, Inzé D, De Jaeger G. (2008) Boosting tandem affinity purification of plant protein complexes. Trends Plant Sci 13: 517–520 [DOI] [PubMed] [Google Scholar]
- Vlieghe K, Vuylsteke M, Florquin K, Rombauts S, Maes S, Ormenese S, Van Hummelen P, Van de Peer Y, Inzé D, De Veylder L. (2003) Microarray analysis of E2Fa-DPa-overexpressing plants uncovers a cross-talking genetic network between DNA replication and nitrogen assimilation. J Cell Sci 116: 4249–4259 [DOI] [PubMed] [Google Scholar]
- Wu AR, Hiatt JB, Lu R, Attema JL, Lobo NA, Weissman IL, Clarke MF, Quake SR. (2009) Automated microfluidic chromatin immunoprecipitation from 2,000 cells. Lab Chip 9: 1365–1370 [DOI] [PMC free article] [PubMed] [Google Scholar]
- Zempleni J. (2005) Uptake, localization, and noncarboxylase roles of biotin. Annu Rev Nutr 25: 175–196 [DOI] [PubMed] [Google Scholar]
- Zhang Y, Liu T, Meyer CA, Eeckhoute J, Johnson DS, Bernstein BE, Nusbaum C, Myers RM, Brown M, Li W, et al. (2008) Model-based analysis of ChIP-Seq (MACS). Genome Biol 9: R137. [DOI] [PMC free article] [PubMed] [Google Scholar]