

Abstract
Purpose
The long-term update of US GI Intergroup RTOG 98-11 anal cancer trial found that concurrent chemoradiation (CCRT) with fluorouracil (5-FU) plus mitomycin had a significant impact on disease-free survival (DFS) and overall survival (OS) compared with induction plus concurrent 5-FU plus cisplatin. The intent of the current analysis was to determine the impact of tumor node (TN) category of disease on survival (DFS and OS), colostomy failure (CF), and relapse (local-regional failure [LRF] and distant metastases [DM]) in this patient group.
Methods and Materials
DFS and OS were estimated univariately by using the Kaplan-Meier method, and 6 TN categories were compared by the log–rank test (T2N0, T3N0, T4N0, T2N1-3, T3N1-3, and T4N1-3). Time to relapse and colostomy were estimated by the cumulative incidence method, and TN categories were compared using Gray’s test.
Results
Of 682 patients, 620 were analyzable for outcomes by TN category. All endpoints showed statistically significant differences among the TN categories of disease (OS, P<.0001; DFS, P<.0001; LRF, P<.0001; DM, P=.0011; CF, P=.01). Patients with the poorest OS, DFS, and LRF outcomes were those with T3-4N-positive (+) disease. CF was lowest for T2N0 and T2N+ (11%, 11%, respectively) and worst for the T4N0, T3N+, and T4N+ categories (26%, 27%, 24%, respectively).
Conclusions
TN category of disease has a statistically significant impact on OS, DFS, LRF, DM, and CF in patients treated with CCRT and provides excellent prognostic information for outcomes in patients with anal carcinoma. Significant challenges remain for patients with T4N0 and T3-4N+ categories of disease with regard to survival, relapse, and CF and lesser challenges for T2-3N0/T2N+ categories.
Introduction
Phase 2 (1-3) and subsequent randomized phase 3 trials (4-10) have established concurrent chemoradiation (CCRT) as the initial treatment of choice for most patients with anal carcinoma. CCRT achieves sphincter preservation in many patients, allowing surgical resection to be kept in reserve as a salvage maneuver (11). A phase 3 trial by the Radiation Therapy Oncology Group and Eastern Cooperative Oncology Group (RTOG 87-04/ECOG 1289) ECOG 1289) demonstrated that RT plus concurrent infusion with fluorouracil (5-FU) plus mitomycin (MMC) both improved local control and had a lower colostomy rate than RT plus 5-FU (4). Phase 3 trials from the United Kingdom Coordinating Committee on Cancer Research and the European Organization for the Research and Treatment of Cancer (EORTC) established that CCRT with 5-FU/MMC was superior to RT alone with regard to local control and colostomy failure (CF) but had no overall survival (OS) advantage (5, 6).
In an attempt to determine whether concurrent MMC during RT plus 5-FU infusion could be replaced with cisplatin (CDDP), a US GI Intergroup phase 3 trial coordinated by RTOG (RTOG 98-11) was initiated to test RT plus concurrent 5-FU/MMC therapy versus induction 5-FU/CDDP therapy followed by RT plus concurrent 5-FU/CDDP (7). Disease-free survival (DFS) was the primary endpoint, and secondary endpoints were OS, CF, and disease relapse. An initial analysis of RTOG 98-11 showed a decrease in CF for RT plus 5-FU/MMC versus RT plus 5-FU/CDDP, with 5-year rates of 10% versus 19% (P=.02), respectively, but no impact on either DFS or OS (7). On the basis of a long-term updated analysis, therapy with RT plus 5-FU/MMC had statistically better DFS and OS rates than RT plus 5-FU/CDDP (5-year DFS: 67.8% vs 57.8%, respectively, P=.006; 5-year OS: 78.3% vs 70.7%, respectively, P=.026) (8).
Secondary analyses of RTOG 98-11 were previously performed to evaluate OS, DFS, and time to colostomy by using various prognostic factors (9, 10). In an analysis of predictors for colostomy, only tumor diameter >5 cm predicted for time to colostomy (P=.008). In an analysis that evaluated prognostic factors for survival (10), patients with >5-cm node-positive (N+) tumors had the worst DFS and OS rates, and those with ≤5 cm N0 tumors had the best DFS and OS (10).
The prognosis for patients with T2-4N0 or T2-4N+ disease could not, however, be derived from prior RTOG 98-11 reports. According to American Joint Committee on Cancer definition (fifth edition), T4 tumor category is a tumor of any size that invades adjacent organs. Therefore, the size category of >2 to ≤5 cm included patients with both T2 (tumors >2 cm but ≤5 cm, greatest dimension) and T4 lesions, and the >5-cm size category included patients with both T3 (tumors >5 cm, greatest dimension) and T4 lesions. Accordingly, it was felt that a further analysis of RTOG 98-11 was needed to determine the impact of pretreatment TN category of disease on survival, disease relapse, and CF.
Methods and Materials
Infrastructure, hypothesis, and objectives
RTOG 98-11 was a US GI Intergroup trial coordinated by RTOG, with participation by ECOG, Cancer and Leukemia Group B, North Central Cancer Treatment Group, Southwest Oncology Group, and RTOG. The primary objective of the study was to observe an increase in 5-year DFS from 63% with RT plus concurrent 5-FU/MMC therapy to 73% with RT plus concurrent 5-FU/CDDP. Secondary objectives included OS, LRF, CF, and differences in toxicities.
The objective of the current analysis (January 25, 2012) was to determine the impact of each TN category of disease on survival (OS, DFS), disease relapse (local-regional [LRF], distant [DM]) and CF in the RTOG 98-11 phase 3 trial.
Patient eligibility
Patients with histologically documented squamous, basaloid, or cloacogenic carcinoma of the anal canal were eligible, provided they were 18 years of age or older and had Karnofsky performance status ≥60, T2-4 category cancer with any N category (pelvic or inguinal), and adequate organ function, and were willing to provide written consent. Patients were excluded if they had T1N0-3 or M1 cancer, severe comorbid conditions (including acquired immunodeficiency syndrome), or major malignancy, unless successfully treated and disease-free for at least 5 years.
Evaluations
Before treatment, patients underwent baseline proctoscopy or sigmoidoscopy, chest radiography, and computerized tomography (CT) or magnetic resonance imaging (MRI) of the abdomen and pelvis to establish the stage of disease, plus blood and serum chemistry evaluations to determine the adequacy of hepatic, renal, and bone marrow function. After treatment, patients were re-evaluated similar to baseline and were then followed every 3 months for 2 years, every 6 months for 1 year, and then yearly.
Randomization, stratification, and treatment
Patients were randomized to receive RT plus concurrent infusion of 5-FU/MMC (Arm A; control arm) or induction 5-FU/CDDP therapy followed by RT plus concurrent 5-FU/CDDP therapy (Arm B). Patients were stratified according to gender, clinical node status (N0 vs N+), and size of primary (>2-5 cm or >5 cm).
Details of both RT and the chemotherapy components of treatment are described in depth in the initial publication (7). All patients were to receive a minimum dose of 45 Gy in 25 fractions of 1.8 Gy over 5 weeks to the primary cancer with megavoltage radiation, using anteroposterior-posteroanterior or multifield techniques. Noninvolved nodal sites at risk received 30.6 to 36 Gy in 17 to 20 fractions of 1.8 Gy over 3.5 to 4 weeks. For patients with T3, T4, or N+ disease or T2 patients with residual disease after 45 Gy, the intent was to deliver an additional boost of 10 to 14 Gy in 2-Gy fractions to the primary tumor and involved nodal disease (total dose of 55-59 Gy in 30-32 fractions over 5.5-6.5 weeks).
Statistical methods
DFS and OS were univariately estimated by using the Kaplan-Meier method (12), and 6 TN categories were compared using the log–rank test (T2N0, T3N0, T4N0, T2N+, T3N+, T4N+) (13). LRF, DM, and CF were estimated by using the cumulative incidence method (14), and results by TN category were compared using Gray’s test (15). Initial analyses of OS, DFS, and LRF led to collapsing TN categories into 2 TN groups (T2-3N0 vs T4N0/Any TN+) and 3 TN groups (T2-3N0, T4N0/T2N+, T3-4N+) for further analyses.
Univariate and multivariate Cox proportional hazards models (16) were used to determine whether there was any correlation between the TN categories of disease with regard to OS, DFS, LRF, DM, and CF. Models looking at the 6 TN categories are coded with the reference level of T2N0. A hazard ratio (HR) >1 indicated an increased risk of failure for the other TN categories relative to T2N0. For comparison of the 2 TN groupings, we used a reference level of T2-3N0. When comparing the 3 TN groupings, the reference level was T4N0/T2N+ (HR >1 for T2-3N0 or T3-4N+ categories indicated increased risk of failure relative to T4N0/T2N+; HR <1 for T2-3N0 or T3-4N+ categories indicated a decreased risk of failure relative to T4N0/T2N+).
Results
Patient characteristics
Of 682 patients randomized to the trial, 649 were evaluable for the initial analysis (25 were ineligible, 6 withdrew consent, 2 had no follow-up information). Of the 649 patients, 620 were evaluable for the current analysis; an additional 29 were excluded because of uncertain nodal status.
Survival and relapse by TN category of disease
In the 620 evaluable patients, all endpoints showed statistically significant differences among the TN categories of disease, as seen in Table 1 and Figures 1 and 2 (OS, P<.0001; DFS, P<.0001; LRF, P<.0001; DM, P=.0011; CF, P=.01). OS, LRF, DM, and CF were not statistically different for T2N0 and T3N0 patients but were statistically worse for the other TN categories. For DFS, all TN categories were statistically worse than T2N0.
Table 1.
Impact of TN category on survival, relapse, and colostomy failure
| TN category | No. of Patients | OS
|
DFS
|
LRF
|
DM
|
CF
|
|||||
|---|---|---|---|---|---|---|---|---|---|---|---|
| TD | 5 y %† | TF | 5 y % | TF | 5 y % | TF | 5 y % | TF | 3 y % | ||
| Six TN groups | |||||||||||
| T2N0 | 323 | 76 | 82 | 110 | 72 | 57 | 17 | 38 | 10 | 36 | 11 |
| T3N0 | 96 | 30 | 74 | 45 | 61 | 17 | 18 | 13 | 14 | 15 | 13 |
| T4N0 | 31 | 14 | 57 | 16 | 50 | 11 | 37 | 7 | 21 | 8 | 26 |
| T2N1-3 | 99 | 38 | 70 | 50 | 57 | 26 | 26 | 28 | 27 | 11 | 11 |
| T3N1-3 | 46 | 20 | 57 | 29 | 38 | 20 | 44 | 11 | 24 | 12 | 27 |
| T4N1-3 | 25 | 16 | 42 | 18 | 31 | 15 | 60 | 6 | 24 | 6 | 24 |
| P value* | <.0001 | <.0001 | <.0001 | .0011 | .01 | ||||||
| Two TN groups | |||||||||||
| T2-3N0 | 419 | 106 | 80 | 155 | 70 | 74 | 17 | 51 | 11 | 51 | 11 |
| T4N0/T2-4N1-3 | 201 | 88 | 62 | 113 | 49 | 72 | 36 | 52 | 25 | 37 | 19 |
| P value* | <.0001 | <.0001 | <.0001 | <.0001 | .029 | ||||||
| Three TN Groups | |||||||||||
| T2-3N0 | 419 | 106 | 80 | 155 | 70 | 74 | 17 | 51 | 11 | 51 | 11 |
| T4N0/T2N1-3 | 130 | 52 | 67 | 66 | 56 | 37 | 28 | 35 | 26 | 19 | 15 |
| T3-4N1-3 | 71 | 36 | 52 | 47 | 36 | 35 | 50 | 17 | 24 | 18 | 26 |
| P value* | <.0001 | <.0001 | <.0001 | <.0001 | .01 | ||||||
Abbreviations: CF = colostomy failure; DFS = disease-free survival; DM = distant metastasis; LRF = local-regional failure; OS = overall survival; TD = total deaths; TF = total failures.
Log–rank test for OS and DFS; Gray’s test for LRF, DM, and CF.
Some 5-year estimates might be unstable due to small sample size and, therefore, too few patients at risk at 5 years.
Fig. 1.
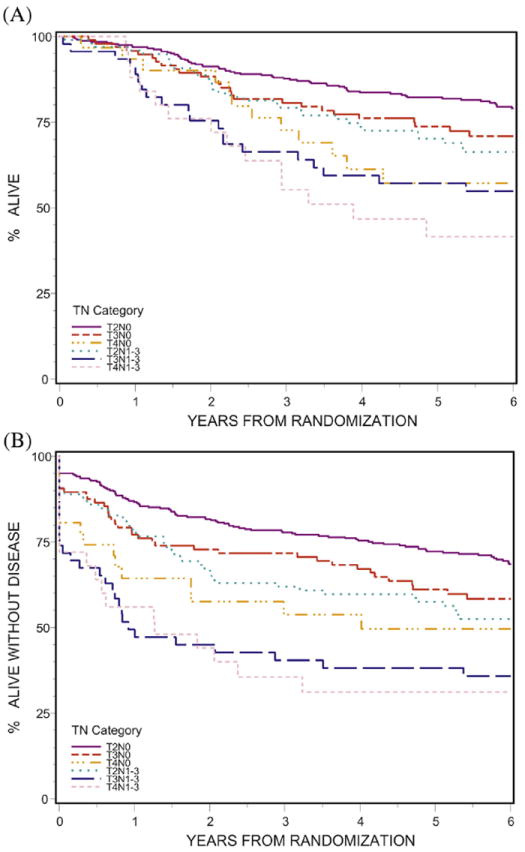
Impact of TN category on survival. (A) Overall (P<.0001); (B) disease-free (P<.0001).
Fig. 2.
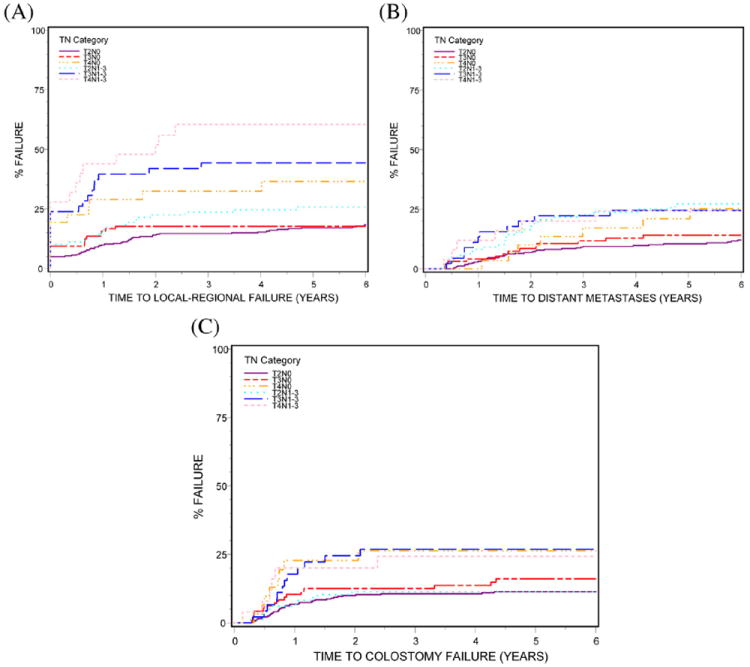
Impact of TN category on disease relapse and colostomy failure (A) local-regional failure (P<.0001); (B) distant metastases (P=.0011); (C) colostomy failure (P=.01).
The best OS and DFS rates and LRF 5-year outcomes were seen in patients with T2N0 and T3N0 categories of disease (OS, 82% and 74%, respectively; DFS, 72% and 61%, respectively; LRF, 17% and 18%, respectively) and the worst outcomes in patients with T4N0, T3N1-3, and T4N1-3 disease (OS, 57%, 57%, and 42%, respectively; DFS, 50%, 38%, and 31%, respectively; LRF, 37%, 44%, and 60%, respectively). Survival and LRF 5-year outcomes for T2N+ category (OS, 70%; DFS, 57%; LRF, 26%) were intermediate between T3N0 and T4N0 disease.
Outcomes by TN category groups
The impact of TN category group on survival, relapse, and CF is seen in Table 1. When separated into 2 TN groups (T2-3N0 vs T4N0/T2-4N+), patients with T2-3N0 disease had statistically better outcomes for 5-year OS (80% vs 62%, respectively, P<.0001); DFS (70% vs 49%, respectively, P<.0001), LRF (17% vs 36%, respectively, P<.0001), and DM (11% vs 25%, respectively, P<.0001). When separated into 3 TN groups (T2-3N0, T4N0/T2N+, and T3-4N+), patients with T2-3N0 disease had better survival and relapse outcomes than patients in the other 2 TN groups with regard to 5-year OS (80% vs 67% and 52%, respectively, P<.0001), DFS (70% vs 56% and 36%, respectively, P<.0001), LRF (17% vs 28% and 50%, respectively, P<.0001), and DM (11% vs 26% and 24%, respectively, P<.0001). Patients with T4N0/T2N+ lesions had intermediate outcomes relative to the other 2 groups (Table 1 and see Supplementary Table 1b).
Colostomy failure by TN category and treatment
Colostomy failure was lowest in patients with T2N0 and T2N+ lesions (3-year: 11%, 11%, respectively) and highest in patients with T4N0, T3N+, and T4N+ lesions (3-year: 26%, 27%, and 24%, respectively) (Table 1). The differences in CF by TN category did not achieve statistical significance in the RT plus 5-FU/CDDP treatment arm (P=.11) (Table 2). There was a trend toward a statistically significant difference in CF among the 6 TN categories of disease in the RT plus 5-FU/MMC arm (P=.066); T2N0 and T2N+ patients still had the lowest rates of CF (3-year: 9%, 4%, respectively). Only the T4N+ group, however, had statistically significantly worse CF than the T2N0 group.
Table 2.
Colostomy failure: impact of TN Category and treatment
| TN Category | Colostomy Failure
|
|||||||
|---|---|---|---|---|---|---|---|---|
| RT plus 5-FU/MMC arm
|
RT plus 5-FU/CDDP arm
|
|||||||
| TF/No. of Patients | 3 y %* | HR (95% CI) | P value† | TF/No. of Patients | 3 y % | HR (95% CI) | P value† | |
| Node negative | ||||||||
| T2N0 | 15/161 | 9 | 1.00 | 21/162 | 12 | 1.00 | ||
| T3N0 | 7/51 | 12 | 1.50 (0.61-3.68) | .38 | 8/45 | 13 | 1.49 (0.66-3.37) | .34 |
| T4N0 | 3/15 | 20 | 2.38 (0.69-8.23) | .17 | 5/16 | 31 | 3.11 (1.17-8.26) | .023 |
| Node positive | ||||||||
| T2N1-3 | 2/46 | 4 | 0.47 (0.11-2.05) | .32 | 9/53 | 17 | 1.42 (0.65-3.09) | .38 |
| T3N1-3 | 4/21 | 19 | 2.38 (0.79-7.17) | .12 | 8/25 | 34 | 2.98 (1.32-6.74) | .0087 |
| T4N1-3 | 5/18 | 28 | 3.64 (1.32-10.04) | .013 | 1/7 | 14 | 1.02 (0.14-7.56) | .99 |
| P value‡ | .066 | .11 | ||||||
Abbreviations: CDDP = cisplatin; CI = confidence interval; HR = hazard ratio; MMC, mitomycin; TF = total failures.
Some 3-year estimates might be unstable due to small sample sizes and, therefore, too few patients at risk at 3 years.
P value from χ2 test using the Cox proportional HR model.
P value from the Gray’s test.
Survival and relapse by TN category and treatment
When treatment arms were analyzed separately (Tables 3 and 4), there were statistically significant differences in OS, DFS, LRF, and DM among the 6 TN categories in both the RT plus 5-FU/MMC (P<.0001 for OS, DFS, and LRF; DM, P=.015) and RT plus 5-FU/CDDP arms (OS, P=.013; DFS, P=.0015; LRF, P=.0032; DM, P=.0093). In the RT plus 5-FU/MMC arm, the T3N+ and T4N+ category patients were statistically more likely to die than the T2N0 category patients, whereas in the RT plus 5-FU/CDDP arm, the patients more likely to die included those in the T4N0, T2N+, and T3N+ categories. With regard to DFS, TN categories more likely to fail (than T2N0) on the RT plus 5-FU/MMC arm are T3N0 and T2-4N+; whereas RT plus 5-FU/CDDP arm categories more likely to fail include the T4N0, T2N+, and T3N+ categories. For LRF, T4N0, T3N+, and T4N+ categories are more likely to fail on the RT plus 5-FU/MMC arm; on the RT plus 5-FU/CDDP arm only those with T3N+ and T4N+ disease had statistically different outcomes (Table 4). For DM, on the RT plus 5-FU/MMC arm, T2N+ and T4N+ are statistically significantly more likely to fail; T3-4N0 outcomes were not statistically different. The T3N+ group did not show statistically different results (P=.27), but the HR of 2.01 suggests that there is a trend toward more DM failures. On the RT plus 5-FU/CDDP arm, there were no DM failures in the T4N+ group, but the T2N+ and T3N+ categories had higher rates of DM.
Table 3.
Overall and disease-free survival: impact of TN category and treatment
| TN Category | Overall Survival
|
|||||||
|---|---|---|---|---|---|---|---|---|
| RT plus 5-FU/MMC arm
|
RT plus 5-FU/CDDP arm
|
|||||||
| TD/No. of Patients | 5y-%‡ | HR (95% CI) | P value† | TD/No. of Patients | 5y-% | HR (95% CI) | P value† | |
| Node negative | ||||||||
| T2N0 | 28/161 | 86 | 1.00 | 48/162 | 78 | 1.00 | ||
| T3N0 | 15/51 | 74 | 1.79 (0.96-3.35) | .07 | 15/45 | 74 | 1.28 (0.72, 2.29) | .40 |
| T4N0 | 4/15 | 77 | 1.63 (0.57-4.65) | .36 | 10/16 | 37 | 2.95 (1.49-5.86) | .002 |
| Node positive | ||||||||
| T2N1-3 | 14/46 | 83 | 1.85 (0.97-3.51) | .061 | 24/53 | 59 | 1.81 (1.11-2.95) | .018 |
| T3N1-3 | 9/21 | 57 | 3.14 (1.48-6.66) | .0029 | 11/25 | 57 | 1.93 (1.00-3.72) | .049 |
| T4N1-3 | 13/18 | 37 | 7.08 (3.65-13.75) | <.0001 | 3/7 | 54 | 1.53 (0.48-4.90) | .48 |
| P value* | <.0001 | .013 | ||||||
|
| ||||||||
| TN Category | Disease-Free Survival
|
|||||||
| RT plus 5-FU/MMC arm
|
RT plus 5-FU/CDDP arm
|
|||||||
| TF/No. of Patients | 5 y %‡ | HR (95% CI) | P value† | TF/No. of Patients | 5y-% | HR (95% CI) | P value† | |
|
| ||||||||
| Node Negative | ||||||||
| T2N0 | 42/161 | 80 | 1.00 | 68/162 | 65 | 1.00 | ||
| T3N0 | 23/51 | 60 | 1.94 (1.17-3.23) | .011 | 22/45 | 62 | 1.30 (0.80-2.10) | .29 |
| T4N0 | 5/15 | 65 | 1.44 (0.57-3.65) | .44 | 11/16 | 36 | 2.56 (1.35-4.85) | .004 |
| Node Positive | ||||||||
| T2N1-3 | 20/46 | 68 | 1.86 (1.09-3.17) | .023 | 30/53 | 49 | 1.63 (1.06-2.51) | .025 |
| T3N1-3 | 12/21 | 43 | 3.27 (1.72-6.23) | .0003 | 17/25 | 34 | 2.62 (1.54-4.47) | .0004 |
| T4N1-3 | 14/18 | 27 | 5.64 (3.06-10.38) | <.0001 | 4/7 | 43 | 1.75 (0.64-4.79) | .28 |
| P value* | <.0001 | .0015 | ||||||
Abbreviations: CDDP = cisplatin; CI = confidence interval; HR = hazard ratio; MMC = mitomycin; TF = total failures.
P value from the log–rank test.
P value from χ2 test using the Cox proportional hazards model.
Some 5-year estimates might be unstable due to small sample sizes and therefore, too few patients at risk at 5 years.
Table 4.
Disease relapse: local-regional versus distant: impact of TN category and treatment
| TN Category | Local-Regional Relapse
|
|||||||
|---|---|---|---|---|---|---|---|---|
| RT plus 5-FU/MMC Arm
|
RT plus 5-FU/CDDP Arm
|
|||||||
| TF/No. of Patients | 3 y %‡ | HR (95% CI) | P value† | TF/No. of Patients | 3 y % | HR (95% CI) | P value† | |
| Node Negative | ||||||||
| T2N0 | 19/161 | 10 | 1.00 | 38/162 | 19 | 1.00 | ||
| T3N0 | 11/51 | 22 | 1.98 (0.94-4.15) | .072 | 6/45 | 13 | 0.59 (.25-1.39) | .22 |
| T4N0 | 5/15 | 27 | 3.23 (1.21-8.66) | .02 | 6/16 | 38 | 2.13 (0.90-5.04) | .087 |
| Node Positive | ||||||||
| T2N1-3 | 10/46 | 18 | 1.97 (0.92-4.24) | .083 | 16/53 | 28 | 1.42 (0.79-2.55) | .24 |
| T3N1-3 | 8/21 | 38 | 4.09 (1.79-9.36) | .0009 | 12/25 | 49 | 2.85 (1.49-5.46) | .0016 |
| T4N1-3 | 11/18 | 61 | 8.00 (3.79-16.91) | <.0001 | 4/7 | 57 | 3.06 (1.09-8.58) | .033 |
| P value* | <.0001 | .0032 | ||||||
|
| ||||||||
| TN Category | Distant Metastases
|
|||||||
| RT plus 5-FU/MMC Arm
|
RT plus 5-FU/CDDP Arm
|
|||||||
| TF/No. of Patients | 3 y %‡ | HR (95% CI) | P value† | TF/No. of Patients | 3 y % | HR (95% CI) | P value† | |
|
| ||||||||
| Node Negative | ||||||||
| T2N0 | 14/161 | 7 | 1.00 | 24/162 | 12 | 1.00 | ||
| T3N0 | 8/51 | 14 | 1.91 (0.80-4.56) | .14 | 5/45 | 9 | 0.81 (0.31-2.12) | .66 |
| T4N0 | 3/15 | 14 | 2.49 (0.72-8.67) | .15 | 4/16 | 19 | 2.04 (0.71-5.88) | .19 |
| Node Positive | ||||||||
| T2N1-3 | 11/46 | 19 | 3.00 (1.36-6.61) | .0064 | 17/53 | 26 | 2.57 (1.38-4.78) | .0029 |
| T3N1-3 | 3/21 | 10 | 2.01 (0.58-7.02) | .27 | 8/25 | 33 | 2.91 (1.30-6.48) | .0091 |
| T4N1-3 | 6/18 | 28 | 6.36 (2.43-16.63) | .0002 | 0/7 | 0 | - | - |
| P value* | .015 | .0093 | ||||||
Abbreviations: CDDP = cisplatin; CI = confidence interval; HR = hazard ratio; MMC = mitomycin; TF = total failures.
P value from the Gray’s test.
P value from χ2 test using the Cox proportional hazards model.
Some 3-year estimates might be unstable due to small sample sizes and, therefore, too few patients at risk at 3 years.
Summary
For all the results in this analysis, it is important to note that sample sizes for some TN categories were very small, resulting in wide confidence intervals, and that RTOG 98-11 was not designed nor powered for this type of subset analysis. There may be differences among TN categories for some endpoints that were unable to be detected statistically due to inadequate power.
Discussion
For several decades, CCRT has been the preferred initial treatment in most anal carcinoma patients because of a high probability of sphincter preservation (1-10). While differences in DFS and local control had been noted in phase 3 trials, this had not translated into improvements in OS, as surgical salvage was feasible with abdominoperineal resection (11).
In the initial analysis of RTOG 98-11, there was a statistically significant decrease in CF for RT plus 5-FU/MMC therapy compared to RT plus 5-FU/CDDP, with 5-year CF rates of 10% versus 19%, respectively (P=.02), but no impact on either DFS or OS (7). On the basis of the long-term updated analysis, RT plus 5-FU/MMC had statistically better DFS and OS rates than RT plus 5-FU/CDDP (5-year DFS: 67.8% vs 57.8%, respectively, P=.006; 5-year OS: 78.3% vs 70.7%, respectively, P=.026) (8).
Outcomes by tumor size and T category of disease
Tumor size appears to have a moderate impact on outcomes when anal cancer is treated with CCRT. In the RTOG 8704/ECOG 1289 phase 3 study, positive biopsy samples were found 6 weeks after completion of CCRT in 17% versus 7% of patients with primary tumors ≥5 cm versus <5 cm in diameter, respectively (P=.02) (4). Differences in local control have also been reported based on maximum tumor diameter. In RTOG 8314, 3-year local control (LC) was 84% versus 62% in patients with tumors <3 cm versus those with tumors ≥3 cm (2). In a Princess Margaret Hospital (PMH) CCRT series, LC was 94% versus 72% for patients with ≤2 cm versus those with >2 cm tumors (3). No differences in LC were found in the PMH series for patients with tumors of 2 to 5 cm versus those with >5 cm, unless there was tumor invasion of adjacent structures (T4 category), in whom LC was 62%. However, anal function was maintained in ~67% of PMH T4 patients (3).
Secondary analyses of US GI Intergroup RTOG 98-11 were previously performed to evaluate outcomes by various prognostic factors; the first analysis attempted to find a pretreatment variable that predicted for colostomy (9). Only tumor diameter >5 cm predicted for time to colostomy (P=.008).
Outcomes by N category of disease
Nodal involvement at time of diagnosis was associated with worse prognosis in most series. In the EORTC phase 3 trial, patients with involved nodes had inferior LC and OS independent of extent of nodal involvement (6). In the PMH series, 5-year cause-specific survival for clinically node-positive versus node-negative patients was 57% versus 81%, respectively (P=.07) (3).
In the initial RTOG 9811 secondary analysis of prognostic factors, 5-year DFS was 64% for node-negative patients versus 35% for node-positive patients (log–rank, P<.0001) (9). The 5-year OS rates favored node-negative patients at 80% versus 57% (log–rank P<.0001).
Outcomes by TN category: RTOG 98-11 analyses
In an RTOG 98-11 analysis that attempted to confirm or find new prognostic factors for survival (10), combinations of tumor size (>2-≤5 cm vs >5 cm) and clinically involved nodes (N0, N+) were analyzed (10). Patients with >5 cm tumor and N+ had the worst DFS and OS rates, and those with ≤5 cm N0 tumors had the best DFS and OS rates (3-year DFS 30% vs 74%, log–rank P<.0001; 4-year OS, 48% vs 81%; log–rank, P<.0001). The prognosis for patients with T2-4N0 or T2-4N+ disease could not be derived, however, as T4 is a tumor of any size that invades adjacent organs.
The current analysis of US GI Intergroup RTOG 98-11 was performed to determine if TN category of disease has an impact on survival, relapse, or CF. All endpoints showed statistically significant differences among the TN categories of disease, including OS (P<.0001), DFS (P<.0001), LRF (P<.0001), DM (P=.0011), and CF (P=.01). The best OS, DFS, and LRF outcomes were found in patients with T2N0 and T3N0 disease categories (5-year OS: 82%, 74%, respectively; DFS, 72%, 61%, respectively; LRF, 17%, 18%, respectively), and the poorest outcomes were in patients with T4N0, T3N+, and T4N+ disease (5-year OS: 57%, 57%, and 42%, respectively; DFS, 50%, 38%, and 31%, respectively; and LRF, 37%, 44%, and 60%, respectively). Survival and LRF outcomes for T2N+ patients were intermediate between T3N0 and T4N0, as found in prior TN category outcome analyses for patients with colon and rectal cancer (17-19). CF was lowest in patients with T2N0 and T2N+ categories (3-year: 11%, 11%, respectively) and highest in those with T4N0, T3N+, and T4N+ category (3-year: 26%, 27%, 24%, respectively).
Outcomes by TN category and treatment: Current series
Outcome analyses by TN category and treatment were performed in the current series. In the CF analyses, there was a trend for a statistically significant differences among the 6 TN categories in the RT plus 5-FU-MMC arm (P=.066) but not the RT plus 5-FU/CDDP arm (P=.11). In the RT plus 5-FU/MMC arm, 3-year CF rates for T2N0 and T2N+ patients were only 9% and 4%, respectively.
Survival and relapse analyses revealed significant difference in OS, DFS, LRF, and DM among the 6 TN categories on both treatment arms. In the RT plus 5-FU/MMC arm, patients with T3-4N+ disease were more likely to die than those with T2N0 disease category, but on the RT plus 5-FU/CCDP arm, those with T4N0 category were also more likely to die. With regard to DFS, TN categories of patients more likely to fail on the RT plus 5-FU/MMC arm are T3N0 and T2-4N+, whereas on the RT plus 5-FU/CDDP arm those most likely to fail include T4N0 and T2-3N+.
Conclusions
The impact of TN category on outcomes for patients treated with CCRT for anal carcinoma are somewhat similar to what has been found in prior analyses of outcomes by TN category for patients with colorectal cancer (17-19). In both anal and colorectal cancer patients, those with 2 high risk factors (higher T category, N+) have poorer survival and higher relapse rates than those with 1 high risk factor (10, 17-20). In the current analysis, patients with T2-3N0 category disease had the best survival and lowest relapse rates, whereas those with T3-4N+ category disease had the poorest survival rates and highest relapse rates. A subset of patients with involved nodes (T2N+) had similar or better prognosis than a node-negative, high T category subset (T4N0).
Potential strategies to improve outcomes for patients with anal canal carcinoma include treatment intensification, treatment modification based on positron emission tomography (PET) response, and individualized molecular medicine-based treatment (8, 21-24). Treatment intensification and modification has implications with regard to each potential component of treatment (RT, chemotherapy, surgery), but evaluation of such should vary by TN category of disease (21).
Evaluation of RT intensification and optimization of concurrent chemotherapy during external beam RT are appropriate, especially in patients with high rates of CF and LRF after CCRT (T4N0 and T3-4N+ in the current analysis). RT intensification may occur as a result of both an increase in RT dose (increase boost dose to 65-70 Gy) and decrease in treatment duration. Both strategies are most feasible with intensity modulated RT, which decreases patient morbidity in both single institution and multi-institution studies, including a phase 2 RTOG trial (25). Whether the intense concurrent 5-FU regimen of 1000 mg/m2 on days 1 to 4 and days 29 to 32 of RT could be replaced by rectal cancer regimens remains to be determined.
As local disease control becomes optimized, systemic approaches may need to be re-evaluated for patients with a TN category of disease who have higher risks of systemic relapse (eg, T4N0/T2-4N+). Some anal carcinomas express biomarkers of therapy resistance such as sonic hedgehog, nuclear factor kappa B, and nuclear Gli-1 (26), which lend themselves to therapeutic exploitation.
Earlier surgical salvage may be appropriate in patients with high rates of CF and LRF after CCRT (T4N0, T3-4N+). For such patients, it may be preferable to perform a baseline PET-CT study and to repeat PET-CT within 4 to 6 weeks of completion of treatment (23, 24). Patients with less than optimal PET response could proceed to early surgical salvage, which might include local excision in select patients. As two-thirds to three-fourths of patients with high-risk TN categories maintained sphincter preservation with CCRT in both the PMH (3) and current series, initial treatment with CCRT is still the most appropriate approach.
Supplementary Material
Summary.
The hypothesis was that tumor node (TN) category of disease has a meaningful impact on survival (disease-free survival [DFS] and overall survival [OS]), colostomy failure (CF), and relapse (local-regional failure [LRF] and distant metastases [DM]) in patients with anal cancer treated with concurrent chemoradiation. Six TN categories were compared (T2N0, T3N0, T4N0, T2N1-3, T3N1-3, and T4N1-3). All endpoints showed statistically significant differences among TN categories of disease (OS, P<.0001; DFS, P<.0001; LRF, P<.0001; DM, P=.0011; CF, P=.01). Significant challenges remain for patients with T4N0 and T3-4N+ disease.
Acknowledgments
This trial was conducted by the Radiation Therapy Oncology Group (RTOG) and was supported by RTOG grant U10 CA21661 and CCOP grant U10 CA37422 from the National Institutes of Health National Cancer Institute. The manuscript’s contents are the sole responsibility of the authors and do not necessarily represent the official views of the NIH National Cancer Institute.
Footnotes
Conflict of interest: none.
Supplementary material for this article can be found at www.redjournal.org.
References
- 1.Nigro ND, Seydel HG, Considine B, et al. Combined preoperative radiation and chemotherapy for squamous cell carcinoma of the anal canal. Cancer. 1983;51:1826. doi: 10.1002/1097-0142(19830515)51:10<1826::aid-cncr2820511012>3.0.co;2-l. [DOI] [PubMed] [Google Scholar]
- 2.Sischy B, Doggett RL, Krall JM, et al. Definitive irradiation and chemotherapy for radiosensitization in management of anal carcinoma: interim report on Radiation Therapy Oncology Group study 8314. J Natl Cancer Inst. 1989;81:850–856. doi: 10.1093/jnci/81.11.850. [DOI] [PubMed] [Google Scholar]
- 3.Cummings BJ, Keane TH, O’Sullivan MB, et al. Epidermoid anal cancer: treatment by radiation alone or by radiation and 5-fluorouracil with and without mitomycin C. Int J Radiat Oncol Biol Phys. 1991;21:1115–1125. doi: 10.1016/0360-3016(91)90265-6. [DOI] [PubMed] [Google Scholar]
- 4.Flam M, John M, Pajak TF, et al. Role of mitomycin in combination with fluorouracil and radiotherapy, and salvage chemoradiation in the definitive nonsurgical treatment of epidermoid carcinoma of the anal canal: results of a phase III randomized intergroup study. J Clin Oncol. 1996;14:2527–2539. doi: 10.1200/JCO.1996.14.9.2527. [DOI] [PubMed] [Google Scholar]
- 5.Arnott SJ, Cunningham D, Gallagher J, et al. Epidermoid anal cancer: results from the UKCCCR randomized trial for radiotherapy alone versus radiotherapy, 5-fluorouracil, and mitomycin. Lancet. 1996;348:1049–1054. [PubMed] [Google Scholar]
- 6.Bartelink H, Roelofsen F, Eschwege F, et al. Concomitant radiotherapy and chemotherapy is superior to radiotherapy alone in the treatment of locally advanced anal cancer: results of a phase III randomized trial of the European Organization for Research and Treatment of Cancer Radiotherapy and Gastrointestinal Cooperative Groups. J Clin Oncol. 1997;15:2040–2049. doi: 10.1200/JCO.1997.15.5.2040. [DOI] [PubMed] [Google Scholar]
- 7.Ajani JA, Winter KA, Gunderson LL, et al. Fluorouracil, mitomycin and radiotherapy vs fluorouracil, cisplatin and radiotherapy for carcinoma of the anal canal: a randomized controlled trial. JAMA. 2008;299:1914–1921. doi: 10.1001/jama.299.16.1914. [DOI] [PubMed] [Google Scholar]
- 8.Gunderson LL, Winter KA, Ajani JA, et al. Long-term update of US GI Intergroup RTOG 98-11 Phase III trial for anal carcinoma: survival, relapse and colostomy failure with concurrent chemoradiation involving fluorouracil/mitomycin versus fluorouracil/cisplatin. J Clin Oncol. 2012;30:4344–4351. doi: 10.1200/JCO.2012.43.8085. [DOI] [PMC free article] [PubMed] [Google Scholar]
- 9.Ajani JA, Winter KA, Gunderson LL, et al. The US Intergroup anal carcinoma trial: combined analysis uncovers a pretreatment variable that predicts for colostomy. J Clin Oncol. 2009;27:1116–1121. doi: 10.1200/JCO.2008.19.6857. [DOI] [PMC free article] [PubMed] [Google Scholar]
- 10.Ajani JA, Winter KA, Gunderson LL, et al. Reliable prognostic factors dictate clinical biology of anal cancer: an analysis of the prospective database of the intergroup trial RTOG 98-11. Cancer. 2010;116:4007–4013. doi: 10.1002/cncr.25188. [DOI] [PMC free article] [PubMed] [Google Scholar]
- 11.Allal A, Laurencet FM, Reymond MA, et al. Effectiveness of surgical salvage therapy for patients with locally uncontrolled anal carcinoma after sphincter conserving treatment. Cancer. 1999;86:405–409. doi: 10.1002/(sici)1097-0142(19990801)86:3<405::aid-cncr7>3.0.co;2-q. [DOI] [PubMed] [Google Scholar]
- 12.Kaplan EL, Meier P. Nonparametric estimation from incomplete observations. J Stat Assoc. 1958;53:457–481. [Google Scholar]
- 13.Mantel N. Evaluation of survival data and two new rank order statistics arising in its consideration. Cancer Chemother Rep. 1966;50:163–170. [PubMed] [Google Scholar]
- 14.Kalbfleisch JD, Prentice RL. The statistical analysis of failure time data. New York: John Wiley & Sons; 1980. pp. 167–169. [Google Scholar]
- 15.Gray RJ. A class of K-samples test for comparing the cumulative incidence of a competing risk. Ann Stat. 1988;16:1141–1154. [Google Scholar]
- 16.Cox DR. Regression models and life-tables. J R Stat Soc Series B Stat Methodol. 1972;34:187–202. [Google Scholar]
- 17.Gunderson LL, Sargent DJ, Tepper JE, et al. Impact of T and N stage and treatment on survival and relapse in adjuvant rectal cancer: a pooled analysis. J Clin Oncol. 2004;22:1785–1796. doi: 10.1200/JCO.2004.08.173. [DOI] [PubMed] [Google Scholar]
- 18.Gunderson LL, Jessup JM, Sargent DJ, et al. AJCC Hindgut Taskforce. Revised TN categorization for rectal cancer based on SEER and rectal pooled analysis outcomes. J Clin Oncol. 2010;28:256–263. doi: 10.1200/JCO.2009.23.9194. [DOI] [PMC free article] [PubMed] [Google Scholar]
- 19.Gunderson LL, Jessup JM, Sargent DJ, et al. AJCC Hindgut Taskforce. Revised TN categorization for colon cancer based on national survival outcome data. J Clin Oncol. 2010;28:264–271. doi: 10.1200/JCO.2009.24.0952. [DOI] [PMC free article] [PubMed] [Google Scholar]
- 20.Das P, Bhatia S, Eng C, et al. Predictors and patterns of recurrence after definitive chemoradiation for anal cancer. Int J Radiat Oncol Biol Phys. 2007;68:794–800. doi: 10.1016/j.ijrobp.2006.12.052. [DOI] [PubMed] [Google Scholar]
- 21.Glynne-Jones R, Lim F. Anal cancer: an examination of radiotherapy strategies. Int J Rad Oncol Biol Phys. 2011;79:1290–1301. doi: 10.1016/j.ijrobp.2010.10.017. [DOI] [PubMed] [Google Scholar]
- 22.Peiffert D, Tournier-Rangeard L, Gerard JP, et al. Induction chemotherapy and dose intensification of the radiation boost in locally advanced anal canal carcinoma: final analysis of the randomized UNICANCER ACCORD 03 trial. J Clin Oncol. 2012;30:1941–1948. doi: 10.1200/JCO.2011.35.4837. [DOI] [PubMed] [Google Scholar]
- 23.Schwarz JK, Siegel BA, Dendashti F, et al. Tumor response and survival predicted by post-therapy FDG-PET/CT in anal cancer. Int J Radiat Oncol Biol Phys. 2008;71:180–186. doi: 10.1016/j.ijrobp.2007.09.005. [DOI] [PubMed] [Google Scholar]
- 24.Day FL, Link E, Ngan S, et al. FDG-PET metabolic response predicts outcomes in anal cancer managed with chemoradiotherapy. Br J Cancer. 2011;105:498–504. doi: 10.1038/bjc.2011.274. [DOI] [PMC free article] [PubMed] [Google Scholar]
- 25.Kachnic L, Winter K, Myerson R, et al. RTOG 0529: A phase II evaluation of dose-painted intensity modulated radiation therapy in combination with 5-fluououracil and mitomycin-C for the reduction of acute morbidity in carcinoma of the anal canal. Int J Radiat Oncol Biol Phys. 2013;86:27–33. doi: 10.1016/j.ijrobp.2012.09.023. [DOI] [PMC free article] [PubMed] [Google Scholar]
- 26.Ajani JA, Wang X, Izzo JG, et al. Molecular biomarkers correlate with disease-free survival in patients with anal canal carcinoma treated with chemo-radiation. Dig Dis Sci. 2010;55:1098–1105. doi: 10.1007/s10620-009-0812-6. [DOI] [PubMed] [Google Scholar]
Associated Data
This section collects any data citations, data availability statements, or supplementary materials included in this article.