Abstract
A fast and novel strategy for efficient ionization of phosphopeptides in mixtures is reported, in which the sample is acidified to low pH to suppress the deprotonation of phosphate groups and then followed by direct analysis using liquid sample desorption electrospray ionization mass spectrometry (DESI-MS).
Phosphorylation is one of the most common post-translational modifications (PTMs) of proteins and it plays an important role in biological processes such as signal transduction.1 Nowadays mass spectrometry (MS) has become a powerful technology for phosphoprotein analysis.2 However, a grand challenge in this regard is that the phosphopeptide signal in the positive ion mode is severely suppressed when a phosphoprotein digest is ionized by traditional ionization methods such as electrospray ionization (ESI)3 in a commonly used “bottom-up” approach. Many elegant methods involving purification and enrichment of phosphopeptides prior to MS analysis have been designed to solve this problem.4 However, as separation/enrichment could be time-consuming, a direct, rapid and effective method for ionizing phosphopeptides in mixtures would be instrumental to facilitating their characterization.
Desorption electrospray ionization (DESI)5 is a recent advance in the field of MS, which allows direct ionization of analytes with little or no sample preparation.6 Sample ionization by DESI occurs via the interactions with charged micro-droplets generated in a pneumatically assisted electrospray of an appropriate solvent. In addition to analysing solid samples, DESI has been used to directly ionize liquid samples in our and other laboratories and demonstrated applications including the coupling of MS with chromatography,7 microfluidics,8 and electrochemistry,7,9 and developing submillisecond time-resolved MS.10
One intrinsic cause for the aforementioned suppression of phosphopeptide ionization is that the phosphate groups of phosphopeptides tend to lose protons to carry negative charges, decreasing the phosphopeptide ionization efficiency (another cause could be due to low-stoichiometry of phosphopeptides in the presence of large amounts of unphosphorylated peptides11). Therefore, one possible solution would be to add a stronger acid than phosphoric acid into the sample solution so that phosphate deprotonation can be inhibited. A similar methodology has been adopted in chromatographic separation of acidic analytes and in the previously reported fast-atom bombardment MS experiment.12 However, ESI-compatible inorganic acids such as acetic acid are weaker than phosphoric acid (pKa1: 2.12). Strong acids are typically not used for ESI due to the concern of possible damage to MS instruments. Our strategy to tackle this problem is to use the liquid sample DESI approach. The rationale is that regular ESI-like spray solvents such as methanol/water/acetic acid can be used for DESI spray while samples are acidified with strong acids. When the sample is impinged by DESI spray during ionization, the instrument corrosion by strong acids would be alleviated due to the mixing of the sample with the DESI spray solvent. With the strong acid additives in the sample, phosphopeptides would be charged as positive ions in solution which could be quickly transferred from solution to the gas phase by DESI. In this study, α-casein, β-casein and ovalbumin digest samples (all protein sequences shown in Fig. 1S;† the subscript “p” indicates phosphorylated residues) were used to testify this new concept. Indeed, 100% coverage of major phosphopeptides was enabled by DESI-MS. Most of the phosphopeptides of low stoichiometry in the α-casein digest were also directly detected by this approach, with phosphorylation site coverage comparable to or better than those methods employing separation or enrichment treatment. In addition, phosphopeptide ion charge states could be enhanced, which is of value for tandem MS analysis. This method also turns out to be a general approach for analysing other acidic biomolecules such as sulfated peptides.
Detailed DESI apparatus (Fig. 2S†) and experimental conditions of this study are described in the ESI.† First, as a proof-of-principle experiment, an amino acid mixture of O-phospho-l-tyrosine and l-tyrosine (molar ratio 3 : 1) in MeOH/H2O/HOAc (50 : 50 : 1, v/v, pH = 3.3) was ionized by electrosonic spray ionization13 (ESSI, a variant form of ESI which employs an ESI source with supersonic nebulization gas for better desolvation effect), the corresponding protonated species were observed at m/z 262 and 182, respectively (Fig. 3S-a†). The intensity ratio of m/z 262 to m/z 182 is 0.4 although O-phospho-l-tyrosine is 3 times more concentrated than l-tyrosine, showing the suppression of the phosphorylated amino acid signal. Interestingly, when the mixture was acidified with HCl to pH 2 and ionized by DESI with a spray solvent of MeOH/H2O/HOAc, the signal intensity of m/z 262 exceeded m/z 182 (Fig. 3S-b†). In addition, the absolute intensity of m/z 262 in the DESI-MS spectrum (1.3 × 10⁶, arbitrary units, Fig. 3S-b†) is higher than that in the ESSI-MS spectrum (4.5 × 10⁵, Fig. 3S-a†). Presumably, the addition of HCl suppresses the deprotonation of the phosphate group of O-phospho-l-tyrosine so that it can be more easily ionized by DESI.
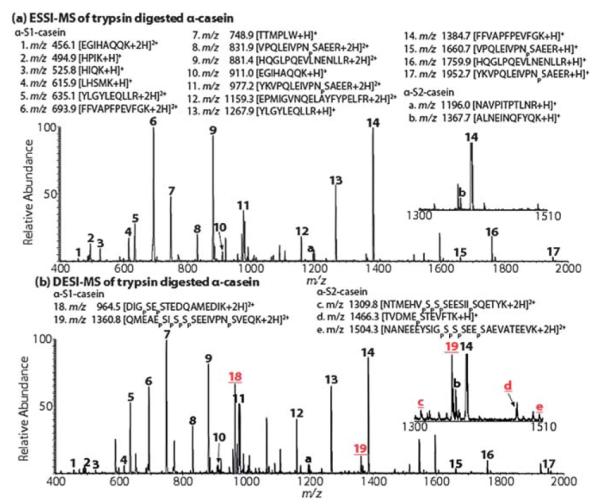
We thus examined phosphoprotein digests with this DESI approach. α-Casein, a phosphoprotein containing a major component α-S1-casein and a minor component α-S2-casein (molar ratio: ~4 : 114), was trypsin digested and tested. In a comparative experiment using ESSI, among 17 peptide ions identified based on the acquired MS spectrum (Fig. 1a; the inset shows the list of identified peptide ions), four phosphopeptide ions at m/z 832, m/z 977, m/z 1661, and m/z 1953 were detected, covering only one phosphorylation site of the α-S1-casein protein that has eight phosphate groups in total. In stark contrast, when the sample was acidified by HCl to pH 2 and analyzed by DESI, besides the 17 peptide ions seen in the ESSI-MS spectrum, two additional phosphopeptide ions at m/z 965 and 1361 were detected (denoted as peaks 18 and 19, Fig. 1b), covering all eight phosphorylation sites of the α-S1-casein. In particular, the successful visualization of the highly acidic phosphopeptide QMEAEpSIpSpSpSEEIVPNpSVEQK is remarkable as it carries 5 phosphates. Upon collision-induced dissociation (CID), m/z 965 gives rise to fragment ions y4–y6, y8 along with characteristic phosphate losses (Fig. 4S-a†) and m/z 1361 dissociates into b5, b7, b13, b14, y5, y7–y10, and y14 plus H3PO4 loss (Fig. 4S-b†), confirming their structures. Similarly, when α-casein was digested with another enzyme Glu-C, a highly acidic peptide from α-S1-casein, AEpSIpSpSpSEEIVPNpSVE carrying 5 phosphates, 4 acidic glutamic acid residues without any basic residues, was generated. While ESSI failed to detect it (Fig. 5S-a†), it was successfully detected using DESI at low pH (seen as a +2 ion at m/z 1039; Fig. 5S-b†), emphasizing the strength of this DESI method. Upon CID, m/z 1039 produces y5–y8, y12, b10, b11 along with phosphate losses (Fig. 5S-c†).
Fig. 1.

(a) ESSI-MS spectrum of α-casein tryptic digest at pH 3.8 and (b) DESI-MS spectrum of α-casein tryptic digest at pH 2.0. The underlined numbers in red indicate the phosphopeptides detected by DESI which are not detected by ESSI. Insets show zoomed-in spectra for clarity.
In addition, we examined the phosphopeptides resulted from trypsin digestion of the minor component of α-S2-casein present in α-casein. While there was no such phosphopeptide ion seen in the ESSI spectrum (Fig. 1a), 3 phosphopeptide ions from α-S2-casein were observed in the DESI spectrum (denoted as peaks c, d and e in the inset of Fig. 1b; sequences shown in the list of Fig. 1b). Their CID spectra (Fig. 6S†) are characterized with phosphate losses and backbone cleavages. The detection of these three phosphopeptide ions covers 9 out of 11 possible phosphorylation sites in α-S2-casein. This coverage is comparable to or higher than other methods that employed methyl esterification of phosphopeptides15 (9 out of 11) or phosphopeptide enrichment16 (3 out of 11). This result suggests the capability of DESI in directly ionizing phosphopeptides of low stoichiometry in mixtures. In this regard, the advantage of DESI is that it is fast without derivatization, separation or enrichment. In this DESI experiment, 5 pmol of α-casein trypsin digest was injected for ionization to acquire the DESI-MS spectra using a Thermo Finnigan LCQ-DECA instrument, suggesting a reasonably good sensitivity of the method.
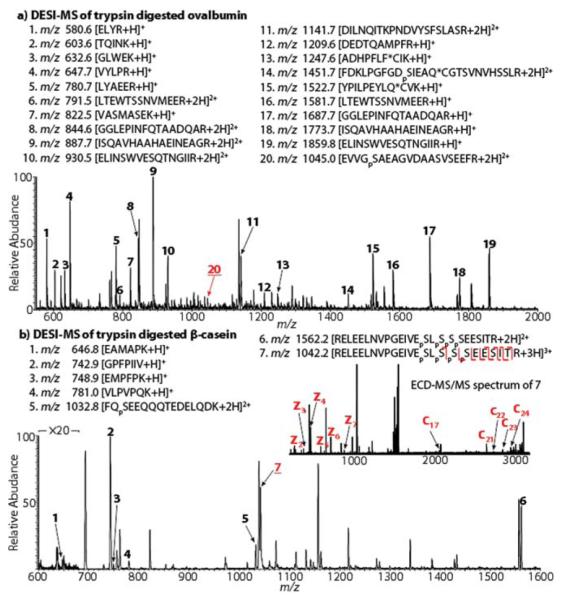
Ovalbumin, a phosphoprotein containing two phosphorylated sites and one disulfide bond was also examined. After DTT reduction and iodoacetamide protection, the protein was trypsin digested and subject to ESSI and DESI analyses. Indeed, only one phosphopeptide ion at m/z 1452 appeared in the ESSI-MS spectrum (Fig. 7S-a†). By DESI, another phosphopeptide ion at m/z 1045 was also successfully detected (Fig. 2a), covering both phosphate-carrying residues in the protein. CID of m/z 1045 gives rise to y5, y6, y8, y10, and y12–y14, in line with its structure.
Fig. 2.
DESI-MS spectra of (a) ovalbumin tryptic digest and (b) β-casein tryptic digest at pH 2.0. *C indicates the protected cysteine residue. The inset in (b) shows the ECD spectrum of m/z 1042.
Besides efficiently ionizing phosphopeptides, phosphopeptide charges could be enhanced by DESI. For instance, in the case of β-casein tryptic digest, only +2 ion at m/z 1562 was observed for phosphopeptide RELEELNVPGEIVEpSLpSpSp-SEESITR in the ESSI-MS spectrum (Fig. 7S-b†). However, abundant +3 ion at m/z 1042 was generated by DESI (Fig. 2b). The increased charge state is valuable in providing increased sequence coverage via electron-based tandem MS analysis such as electron-capture dissociation (ECD).17 Indeed, ECD of m/z 1042 gives rise to fragment ions of z2–z7, c17, c21–c24 (Fig. 2b, inset), from which pSer18 and pSer19 of the protein can be clearly located. In contrast, ECD of m/z 1562 does not provide fragment ions from backbone cleavages (Fig. 7S-b,† inset).
The corrosion effect of HCl used in DESI to the instrument was evaluated in a separate experiment. A piece of stainless steel (316 S.S) was chosen to block the instrument inlet capillary to receive the sprayed liquids from DESI. When a sample of MeOH/H2O with pH adjusted to 2 by HCl was injected to undergo DESI ionization for 30 min (both the flow rates and the DESI spray solvent were kept the same as in the analysis of phosphopeptide samples), no detectable damage was noted (Fig. 8S-a†). While the same sample (pH 2) was sprayed by ESSI for 30 min, some traces of black marks on the stainless steel surface were seen, indicating the occurrence of corrosion (Fig. 8S-b†). This result shows the advantages of DESI in analyzing low pH samples. Sulfuric acid, another strong acid, was chosen to replace HCl for the DESI experiments; however, the ionization of the phosphopeptides failed, probably because SO42− anions form adducts with positively charged peptide ions.18 HCl, a volatile acid, appears to be the ideal choice for such a DESI experiment.
In terms of the mechanism for the enhanced phosphopeptide ionization by DESI, it is likely that strong acid HCl, unlike acetic acid, can suppress the phosphate group deprotonation. Thus, phosphopeptides are positively charged in solution and therefore are able to compete with non-phosphorylated peptides to produce ions, which accounts for the contrast observed above. Indeed, in a separate experiment, when the α-casein tryptic digest was further acidified by HCl from pH 2 to lower pHs, including 1.7, 1.5, and 1.2, the doubly charged phosphopeptide QMEAEpSIpSpSpSEEIVPNpSVEQK (m/z 1361) showed enhanced intensity with decreasing pH (Fig. 9S†). Note that sample solutions with pH less than 2 could lead to instrument corrosion, which depends on the sample injection flow rate. In the case of the pH 1.2 experiment, we reduced the sample flow rate from 5 to 2 μL min−1 to avoid instrument corrosion. Furthermore, it is likely that phosphopeptides positively charged in solution can be rapidly transferred into the gas phase by DESI. Evidence for this hypothesis is that, when the α-casein tryptic digest sample was mixed with the DESI spray solvent (1 : 2 by volume, mimicking the mixing in the DESI ionization process) and then was analyzed by ESSI, m/z 1361 was not observed (data not shown). Presumably, m/z 1361 survived the spray/sample solution mixing process in DESI because of the very short DESI ionization time scale (~few ms)10 that favors the preservation of positively charged phosphopeptides during the ionization.
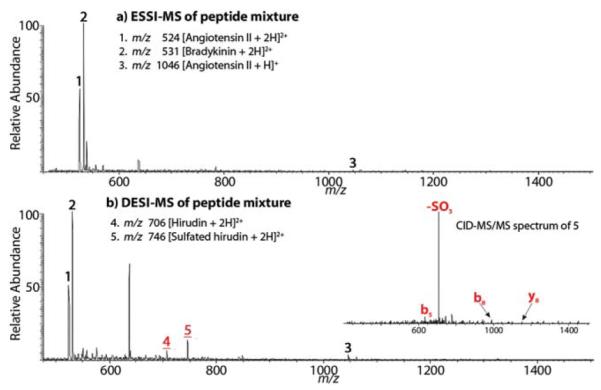
This DESI method is also applicable to the analysis of acidic sulfated peptides. Using a mixture containing sulfated hirudin (sequence DFEEIPEE-Y(SO3H)-LQ), bradykinin (sequence RPPGFSPFR), and angiotensin II (sequence DRVYIHPF) as a test sample (1 : 10 : 10 by moles), the sulfated hirudin was suppressed and no corresponding peptide ion was observed in the ESSI-MS spectrum (Fig. 3a). In contrast, the doubly charged sulphated hirudin (m/z 746) arose via DESI ionization (Fig. 3b) and its structure was confirmed by CID (Fig. 3, inset). This result shows the possibility for detecting sulfopeptides of low stoichiometry by DESI, analogous to the detection of the α-S2-casein phosphopeptides mentioned above. Interestingly, there is a peak at m/z 706 in Fig. 3b, which corresponds to the doubly charged hirudin probably arising from acidic hydrolysis, in-source CID or both. However, no hydrolysis of phosphopeptides was observed in all DESI experiments in this study. This contrast provides a simple way to differentiate phosphorylated peptides from sulfated peptides.19
Fig. 3.

(a) ESSI-MS spectrum of a peptide mixture of bradykinin, angiotensin II and sulfated hirudin (1 : 10 : 10 by moles) at pH 3.2; and (b) DESI-MS spectrum of the peptide mixture at pH 2.0. The inset in (b) shows the CID spectrum of m/z 746.
This study presents a novel approach for solving the critical ion signal suppression problem associated with phosphopeptide (and also sulfopeptides) ionization. The DESI methodology is general, fast and effective, which should potentially have an impact on high throughput phosphoproteomics research. In addition, it provides a new mass spectrometric method for ionizing or examining species in low pH environments.
Supplementary Material
Acknowledgments
This work is supported by NSF Career Award (CHE-1149367). We thank Prof. Michael L. Gross for the access to National Center for Research Resources (5P41RR000954-35).
Footnotes
Electronic supplementary information (ESI) available: Supporting spectra and related discussion. See DOI: 10.1039/c3an36737a
Notes and references
- 1.Hunter T. Cell. 2000;100:113–127. doi: 10.1016/s0092-8674(00)81688-8. [DOI] [PubMed] [Google Scholar]
- 2 (a).Palumbo AM, Smith SA, Kalcic CL, Dantus M, Stemmer PM, Reid GE. Mass Spectrom. Rev. 2011;30:600–625. doi: 10.1002/mas.20310. [DOI] [PubMed] [Google Scholar]; (b) Aebersold R, Goodlett DR. Chem. Rev. 2001;101:269–296. doi: 10.1021/cr990076h. [DOI] [PubMed] [Google Scholar]; (c) McLachlin DT, Chait BT. Curr. Opin. Chem. Biol. 2001;5:591–602. doi: 10.1016/s1367-5931(00)00250-7. [DOI] [PubMed] [Google Scholar]
- 3.Fenn JB, Mann M, Meng CK, Wong SF, Whitehouse CM. Science. 1989;246:64–71. doi: 10.1126/science.2675315. [DOI] [PubMed] [Google Scholar]
- 4 (a).Gronborg M, Kristiansen TZ, Stensballe A, Andersen JS, Ohara O, Mann M, Jensen O, Pandey A. Mol. Cell. Proteomics. 2002;1:517–527. doi: 10.1074/mcp.m200010-mcp200. [DOI] [PubMed] [Google Scholar]; (b) Hu L, Iliuk A, Galan J, Hans M, Tao WA. Angew. Chem., Int. Ed. 2011;50:4133–4136. doi: 10.1002/anie.201006459. [DOI] [PMC free article] [PubMed] [Google Scholar]; (c) Kweon HK, Håkansson K. Anal. Chem. 2006;78:1743–1749. doi: 10.1021/ac0522355. [DOI] [PubMed] [Google Scholar]
- 5.Takats Z, Wiseman JM, Gologan B, Cooks RG. Science. 2004;306:471–473. doi: 10.1126/science.1104404. [DOI] [PubMed] [Google Scholar]
- 6 (a).Wiseman JM, Puolitaival SM, Takats Z, Cooks RG, Caprioli RM. Angew. Chem., Int. Ed. 2005;44:7094–7097. doi: 10.1002/anie.200502362. [DOI] [PubMed] [Google Scholar]; (b) Denes J, Katona M, Hosszu A, Czuczy N, Takats Z. Anal. Chem. 2009;81:1669–1675. doi: 10.1021/ac8024812. [DOI] [PubMed] [Google Scholar]
- 7.Zhang Y, Yuan Z, Dewald HD, Chen H. Chem. Commun. 2011;47:4171–4173. doi: 10.1039/c0cc05736c. [DOI] [PubMed] [Google Scholar]
- 8.Ma X, Zhao M, Lin Z, Zhang S, Yang C, Zhang X. Anal. Chem. 2008;80:6131–6136. doi: 10.1021/ac800803x. [DOI] [PubMed] [Google Scholar]
- 9 (a).Li J, Dewald HD, Chen H. Anal. Chem. 2009;81:9716–9722. doi: 10.1021/ac901975j. [DOI] [PubMed] [Google Scholar]; (b) Zhang Y, Cui W, Zhang H, Dewald HD, Chen H. Anal. Chem. 2012;84:3838–3842. doi: 10.1021/ac300106y. [DOI] [PMC free article] [PubMed] [Google Scholar]
- 10.Miao ZX, Chen H, Liu PY, Liu Y. Anal. Chem. 2011;83:3994–3997. doi: 10.1021/ac200842e. [DOI] [PubMed] [Google Scholar]
- 11.Steen H, Jebanathirajah JA, Rush J, Morrice N, Kirschner MW. Mol. Cell. Proteomics. 2006;5:172–181. doi: 10.1074/mcp.M500135-MCP200. [DOI] [PubMed] [Google Scholar]
- 12.Poulter L, Ang SG, Williams DH, Cohen P. Biochim. Biophys. Acta. 1987;929:296–301. doi: 10.1016/0167-4889(87)90256-4. [DOI] [PubMed] [Google Scholar]
- 13.Takáts Z, Wiseman JM, Gologan B, Cooks RG. Anal. Chem. 2004;76:4050–4058. doi: 10.1021/ac049848m. [DOI] [PubMed] [Google Scholar]
- 14.Eigel WN, Butler JE, Ernstrom CA, Farrell HM, Jr, Harwalkar VR, Jenness R, Whitney R. McL. J. Dairy Sci. 1984;67:1599–1631. [Google Scholar]
- 15.Xu C-F, Lu Y, Ma J, Mohammadi M, Neuber TA. Mol. Cell. Proteomics. 2005;4:809–818. doi: 10.1074/mcp.T400019-MCP200. [DOI] [PubMed] [Google Scholar]
- 16 (a).Cuccurullo M, Schlosser G, Cacace G, Malorni L, Pocsfalvi G. J. Mass Spectrom. 2007;42:1069–1078. doi: 10.1002/jms.1238. [DOI] [PubMed] [Google Scholar]; (b) Li S-S, Wang J-Q, Wei H-Y, Yang Y-X, Bu D-P, Zhang L-Y, Zhou L-Y. J. Integr. Agric. 2012;11:439–445. [Google Scholar]
- 17.Zubarev RA, Kelleher NL, McLafferty FW. J. Am. Chem. Soc. 1998;120:3265–3266. [Google Scholar]
- 18.Chowdhury SK, Katta V, Beavis RC, Chait BT. J. Am. Soc. Mass Spectrom. 1990;1:382–388. doi: 10.1016/1044-0305(90)85018-H. [DOI] [PubMed] [Google Scholar]
- 19.Bossio RE, Marshall AG. Anal. Chem. 2002;74:1674–1679. doi: 10.1021/ac0108461. [DOI] [PubMed] [Google Scholar]
Associated Data
This section collects any data citations, data availability statements, or supplementary materials included in this article.


