

Abstract
Adipose-derived stem cells (ASCs) are a widely investigated type of mesenchymal stem cells with great potential for musculoskeletal regeneration. However, the use of ASCs is complicated by their cellular heterogeneity, which exists at both the population and single-cell levels. This study demonstrates a live-cell assay to investigate gene expression in ASCs undergoing osteogenesis using fluorescently tagged DNA hybridization probes called molecular beacons. A molecular beacon was designed to target the mRNA sequence for alkaline phosphatase (ALPL), a gene characteristically expressed during early osteogenesis. The percentage of cells expressing this gene in a population was monitored daily to quantify the uniformity of the differentiation process. Differentiating ASC populations were repeatedly measured in a nondestructive fashion over a 10-day period to obtain temporal gene expression data. Results showed consistent expression patterns for the investigated osteogenic genes in response to induction medium. Peak signal level, indicating when the most cells expressed ALPL at once, was observed on days 3–5. The differentiation response of sample populations was generally uniform when assessed on a well-by-well basis over time. The expression of alkaline phosphatase is consistent with previous studies of osteogenic differentiation, suggesting that molecular beacons are a viable means of monitoring the spatiotemporal gene expression of live, differentiating ASCs.
Introduction
Stem cell-based therapies hold immense promise for treating myriad diseases, and researchers across multiple fields have dedicated themselves to exploring this potential.1 Tissue engineers frequently use stem cell populations that are induced with biochemical and/or biomechanical stimuli to generate tissues of interest, such as muscle or bone. Adipose-derived stem cells (ASCs) are especially attractive because of their relative abundance and nonimmunogenicity and have shown good potential for use in musculoskeletal regeneration.2–4 However, experiments using ASCs are often confounded by heterogeneity, which can negatively affect cellular differentiation and matrix production. Single-cell and subpopulation effects are often obscured by the whole-population assays that are typically used by researchers.5 A new method that is capable of nondestructively assessing stem cell differentiation and heterogeneity in populations over time would alleviate many of the issues currently faced by researchers in the field.
Mesenchymal stem cell heterogeneity exists at multiple levels. First, cell populations harvested from stromal tissues are nonuniform, containing a mixture of differentiated and undifferentiated cell types that can respond to environmental conditions in dramatically different fashions.6 Second, the stem/progenitor cells themselves possess disparate differentiation capabilities (unipotency, bipotency, multipotency, and pluripotency).7–9 This heterogeneity is problematic for both basic science experiments and translational applications, because individual cells can only respond according to their capabilities. Understanding the degree of uniformity in differentiating populations is critical for identifying important subpopulations that hold the key to regenerating tissues and treating diseases.
This study establishes a live-cell analysis approach using fluorescently tagged DNA hybridization probes called molecular beacons to determine gene expression patterns in osteogenically differentiating ASCs. Molecular beacons are hairpin-shaped nucleic acid probes that are functionalized with a fluorophore and a quencher on opposing ends.10 The loop region of the probe is complementary to a nucleic acid sequence of interest. In the absence of the target sequence, the probe retains its stem-loop structure and fluorescence is quenched. When the target sequence is bound by the loop region, the stem unfolds, affording fluorescence. Molecular beacons have been used in many capacities, including single nucleotide polymorphism detection, real-time polymerase chain reaction (PCR) applications, and many live cell imaging applications.11–16
For this study, a molecular beacon was designed to target mRNA molecules coding for alkaline phosphatase (ALPL), a gene characteristically expressed during early osteogenesis.17,18 By delivering this novel beacon to differentiating and nondifferentiating cell populations, we were able to investigate the uniformity of osteogenesis in living samples and identify spatiotemporal patterns of expression, which would not be possible using standard, destructive gene expression analysis techniques.
The goal of this study was to analyze temporal gene expression patterns in living cells during osteogenic differentiation at the population and subpopulation levels. Human ASC populations were chemically induced along the osteogenic lineage over a 10 day period, and gene expressions were quantified using a custom-designed molecular beacon. This experimental approach marks the first time that an investigation of gene expression patterns in living mesenchymal stem cells has been performed in a repeatable, nondestructive fashion.
Materials and Methods
Cell culture
All cells were maintained in a humidified incubator at 37°C and 5% CO2. MG-63 and HEK-293 cell lines (ATCC, Manassas, VA) were cultured in growth medium containing phenol red-free MEM (CellGro, Manassas, VA) that was supplemented with 10% fetal bovine serum (FBS), 1% penicillin/streptomycin, 100 mM Glutamax, and 100 mM sodium pyruvate (ThermoFisher Scientific, Waltham, MA). Cells were passaged at 80% confluence using 0.25% trypsin-EDTA (ThermoFisher Scientific). For molecular beacon experiments, cells were seeded into 96-well plates at a density of ∼25,000 cells/cm2.
ASCs derived from subcutaneous adipose tissue, originally harvested from seven, healthy, nondiabetic donors between the ages of 18 and 60 years, were purchased from Zen-Bio, Inc. (Research Triangle Park, NC; superlot #36). Cells were grown in expansion medium containing DMEM/F-12 (ThermoFisher Scientific), 10% FBS (Zen-Bio), 1% penicillin/streptomycin, 0.25 ng/mL transforming growth factor-β1, 5 ng/mL epidermal growth factor, and 1 ng/mL fibroblast growth factor (R&D Systems, Minneapolis, MN).19 All ASCs used for experiments were at passage 4.
Beacon development and design
A custom-designed beacon was developed corresponding to alkaline phosphatase mRNA (ALPL), a common gene expression and protein marker of early osteogenesis (Table 1). The beacon was functionalized with a 6-FAM (Ex: 492 nm/Em: 517 nm) fluorophore on the 3′ end and a Black Hole Quencher-1 on the 5′ end. A nucleic acid folding program, mfold, was used to model the secondary structures of the target mRNA molecule based on thermodynamic stability.20,21 The five structures with the lowest Gibbs' free energy were analyzed for regions of largely unpaired or looped secondary structure. A 20–30 base sequence was chosen and assessed using NCBI BLAST to ensure uniqueness.22,23 The ALPL beacon was highly specific to its target sequence (E-values 104 smaller than the next sequence match). The stem region of the beacon was designed to give the probe an optimal melting temperature of ∼70°C.24 The folding of the beacon sequence was also assessed to ensure that a hairpin structure existed. All beacons were manufactured and HPLC purified via a commercial source (MWG Operon, Huntsville, AL).
Table 1.
Molecular Beacon and Target Sequences for Reference and Osteogenic mRNA
| Gene | Beacon sequence 5′→3′ |
|---|---|
| GAPDH27 | CGACGGAGTCCTTCCACGATACCACGTCG |
| ALPL | CGCTCCAGAGTGTCTTCCGAGGAGGTCAAGGAGCG |
| ALPL target | TTGACCTCCTCGGAAGACACTCT |
Stem regions are underlined. Remainder of oligonucleotide forms the loop region, which is complementary to the gene of interest. A 6-FAM fluorophore and BHQ1 quencher were attached to 5′ and 3′ ends, respectively. ALPL target is the reverse complement of the loop region of the ALPL beacon.
Molecular beacon hybridization assay
Validation of hybridization efficiency was done by measuring the fluorescence of fixed concentrations of beacon hybridization to varying concentrations of target sequence (Supplementary Fig. S1; Supplementary Data are available online at www.liebertpub.com/tea). ALPL molecular beacon in pH 7.4 1× Tris-EDTA buffer (ThermoFisher Scientific; 100 μM solution) was added to wells in an opaque 96-well plate at a final beacon concentration of 5 μM/well. Stepwise concentrations of ALPL target sequence (DNA, 0.5–5.0 μM) were then added to the wells. Controls included wells containing only beacon and Tris buffer, only target and Tris buffer, and only Tris buffer. Sample plates were incubated at 37°C for 10 min, and fluorescence was read with a spectrofluorometer (Spectramax Plus 384, Ex: 492 nm, Em: 517 nm; Molecular Devices, Sunnyvale, CA) every 10 min for a total of 270 min.25
Beacon validation and testing
MG-63 cells, which highly express osteogenic genes,26 and HEK-293 cells, which do not, were seeded at a density of 50,000–60,000 cells per well in a 24-well plate. Two nanogram of ALPL molecular beacon (2 μL of 100 μM solution in Tris-EDTA buffer, pH 7.4) was encapsulated in 4 μL xtremeGENE HP reagent (1:2 ratio beacon:reagent; Roche Biotech, Pleasanton, CA) and suspended in 100 μL base medium (MEM) according to product instructions. The complex was delivered to wells at a concentration of 0.5 μM to ensure that the molecular beacon would be in great excess of the mRNA transcripts (∼6×10¹²–10×1012 beacons/well).27 A previously published molecular beacon for the housekeeping gene glyceraldehyde-3-phosphate dehydrogenase (GAPDH) was encapsulated and delivered in the same way for use as a positive control.28 After beacon treatment, cells were allowed an uptake period of at least 2 h before being imaged on a Nikon Eclipse Ti-U epifluorescent microscope (Nikon Instruments, Inc., Melville, NY). Images were captured with a scope-mounted QICAM 12-bit digital camera (Qimaging, Surrey, BC, Canada). Signal intensity for presented figures was uniformly thresholded to minimize background levels and assist in visualization.
Real-time quantitative PCR osteogenic gene expression verification
mRNA was isolated from MG-63 cells and HEK-293 cells using the RNAqueous Kit (Ambion, Austin, TX) according to the manufacturer's instructions. Real-time quantitative polymerase chain reaction (RT-qPCR) was conducted using the DNA Engine Opticon 2 (Bio-Rad, Hercules, CA) using the QuantiTect SYBR Green PCR kit (Qiagen, Valencia, CA). For RT-qPCR, 0.5 μg of RNA was reverse transcribed using iScript cDNA Synthesis Kit (Bio-Rad) according to the manufacturer's instructions. Species-specific primer pairs were used to compare the transcript levels of two osteogenic genes (collagen 1 and osteocalcin) in MG-63 and HEK-293 cells. This was done to confirm the suitability of these cell lines as positive and negative controls for osteogenic genes. Calculations were done using the delta delta Ct (ΔΔCt) method, normalized to rRNA 18S expression.
Osteogenic differentiation of ASCs
ASCs were chemically induced for osteogenesis following established protocols.29 Control medium contained DMEM/F-12 (ThermoFisher Scientific), 10% FBS (Zen-Bio), and 1% antibiotic/antimycotic. Osteogenic induction medium included the addition of 1 nM dexamethasone, 21.6 mg/mL β-glycerophosphate, 50 μg/mL ascorbate-2-phosphate, and 10 μg/mL vitamin D3 (Sigma-Aldrich, St. Louis, MO). Two separate, 96-well plates were seeded with 30,000 cells/well in 8 wells per plate using control medium. All cells were treated with 1 ng/mL Hoechst dye to visualize nuclei (Sigma-Aldrich). After 24 h, four wells were given 180 μL osteogenic medium while the remaining four wells were given 180 μL control medium. Ninety percent of the medium was changed every other day for 10 days. This experiment was conducted twice to account for any potential run-to-run error.
Beacon treatment and imaging of differentiating ASCs
mRNA-specific beacons were introduced to cells during the 10 day differentiation process. From days 2 to 10, four osteogenic wells and four control wells were treated with ALPL beacon as described earlier and imaged daily. For both iterations of the experiment, three to four fields of view in each well were taken of Hoechst-stained nuclei, fluorescent beacon signals, and bright field images of cells at 10× magnification. Cells were treated with ALPL beacons on days 2, 5, and 7 to maintain saturating intracellular concentrations. This re-treatment schedule was chosen based on a beacon persistence assay in living cells which indicated that the signal was diminished by the fourth day (Supplementary Fig. S2).
Image processing and analysis
CellProfiler image analysis software was used to generate an MATLAB-based algorithm that relates “child” fluorescent signals to “parent” Hoechst-stained nuclei.30,31 This relation of fluorescence signal to parent nuclei is valid, as no extracellular fluorescence was observed in any of the images. The software set thresholding parameters for each image by first identifying the mode for pixel intensities in a local region for each image, then defining all pixel intensities below twice that value as background (“Background Adaptive”). The program analyzed each set of images by first counting Hoescht-stained nuclei, which were recognized as ellipsoidal objects with a major axis between 5 and 50 μm (10 and 100 pixels). An area encompassing the nuclear/perinuclear region (ellipsoid with an axes expansion of 5 μm) was defined when monitoring fluorescent signals in each cell. Individual fluorescence events were identified by pixel and grouped with the nearest nucleus, thus defining a cell as displaying a positive signal or not (Fig. 1). The number of total fluorescing cells was divided by the total number of cells per image, giving a percentage of positively signaling cells for each sample well. Likely sources of error for this method included classifying weak signals as background, attributing signals to the incorrect cell due to overlapping nuclei, discarding signals that were outside the analysis area, and including false-positive signals due to background noise or debris. Despite these sources, however, the error rate between automated counting and manual counting was only±8%, which is tolerable based on the differences observed between osteogenic and control samples. This analysis relied heavily on a pre-existing modification to the CellProfiler program offered by the Broad Institute. The program and its modifications can be viewed at www.cellprofiler.org, and www.cellprofiler.org/CPmanual/RelateObjects.html. Lastly, it should be noted that selection of the thresholding algorithm can dramatically affect how stringently the image analysis will recognize the beacon signal in a system. The current approach is highly not only lenient when recognizing single-pixel signals, likely resulting in overestimation of positive cells, but also more stringent than past approaches when setting background thresholds.32 Refinement of these techniques should result in more accurate, positive cell counts.
FIG. 1.
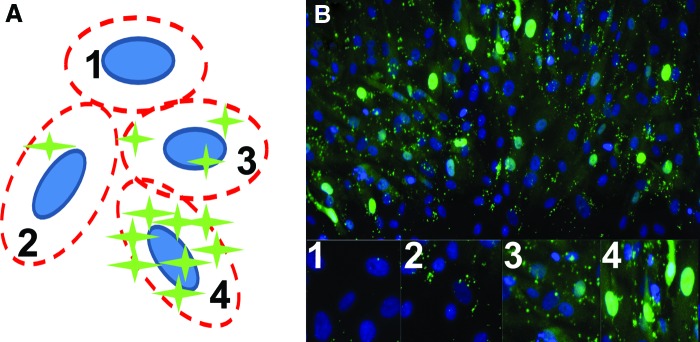
The percentage of cells with positive signals for ALPL was calculated using image analysis algorithms. A cartoon representation of the analysis is shown illustrating the basic concept (A). Fluorescence signals were assigned to the nearest Hoescht-stained nuclei, establishing parent-child relationships between the two images (B, merged for illustration purposes). “Low/no-signal” cells exhibited no fluorescence events in the region of interest above a minimum threshold value (A1, B1). “Positive” signals varied in type and intensity and included point signals (A2, B2), punctate, compressed speckling (A3, B3), and widespread fluorescence throughout the perinuclear region (A4, B4). All of these categories were included when calculating the percentage of positive cells. ALPL, alkaline phosphatase. Color images available online at www.liebertpub.com/tea
Verification of osteogenesis
Alkaline phosphatase activity in differentiating ASCs was determined according to instructions for the BioVision alkaline phosphatase assay kit (Mountain View, CA). Briefly, four induced and four control wells per plate were either treated with ALPL molecular beacon or left untreated. After 7 days, these cells were lysed in 200 μL lysis buffer. Lysate was stored at −80°C until testing. For analysis, lysates were thawed and centrifuged at 13,000 rpm for 5 min. Fifty microliter of the resulting solutions were transferred into individual wells of a 96-well plate and brought to volume with 110 μL of lysis buffer. The remaining 50 μL from each sample were transferred into separate wells on the same plate, brought to volume, and then treated with 20 μL stop solution to act as background controls. A standard curve using 0–0.5 mM alkaline phosphatase was made for the quantification of samples. All wells were treated with 10 μL of 5 mM methylumbelliferone-4-phosphate solution for detection. The wells were covered and incubated at room temperature for 30 min, after which stop solution was added to all wells except the background controls. A spectrofluorometer (Spectramax Plus 384; Molecular Devices) determined the fluorescence of each well at 360 nm/440 nm.
Alizarin Red-S (ARS; Sigma-Aldrich) staining was done for both control and osteogenically induced wells to examine calcified matrix production after 21 days of differentiation. ARS (2% in distilled water) was pH adjusted (4.1–4.3) and filtered through a 0.2 μm pore filter before use. On day 21, beacon-treated wells were fixed with 3.7% paraformaldehyde in PBS (ThermoFisher Scientific). The fixed cell monolayers were washed in distilled water for 5 min, stained with 2% ARS for 20 min, and then thoroughly rinsed. After staining was complete, wells were imaged at 20× magnification using bright field microscopy and a scope-mounted digital camera (Labomed TCM 400; Labomed, Culver City, CA). ARS dye was then eluted with 10% cetylpyridinium chloride (ThermoFisher Scientific) overnight at 4°C, and the optical densities were measured at 540 nm with a spectrofluorometer (Spectramax Plus 384; Molecular Devices).
Statistical analysis
Gene expression patterns for ALPL were determined using percent expression in differentiating ASC populations over two iterations of the experiment (n=4–8 sample wells). Data were analyzed using two-factor ANOVA (treatment, time; α=0.05) with Fisher's LSD post-hoc analysis. Osteogenic protein depositions were analyzed using a Student's t-test to detect differences between control (n=4) and induced (n=4) samples.
Results
Molecular beacon hybridization assay
A 5 μM concentration of ALPL molecular beacon was used to assess hybridization to set concentrations of target sequence. At lower concentrations, the fluorescence intensity increased rapidly, while at the highest concentration, the binding was saturated (R2=0.98). Average fluorescence values increased three-fold over a target concentration range from 0.5 to 5 μM (Supplementary Fig. S1). A signal-to-noise ratio of 24:1 was calculated based on these measurements, which is consistent with previous studies using molecular beacons.33
Beacon validation and testing
After the administration of GAPDH beacon to MG-63 and HEK-293 cells, 97–99% of cells in each sample population displayed positive signals. MG-63 and HEK-293 cells were treated with molecular beacons corresponding to ALPL to determine signal levels in positive and negative control populations, respectively. Ninety-five to 99% of treated MG-63 cells showed robust positive signals for all three beacons (Fig. 2). In treated HEK-293 cells, only 1–2% of cells showed positive signals. All cells displayed typical morphology and remained spread over a 72-h observation period. MG-63 cells have been previously shown to express the osteogenic genes alkaline phosphatase, collagen 1, and osteocalcin.26,34 To verify the characteristics of our positive and negative control cell populations, we performed RT-qPCR to quantify the mRNA levels of osteogenic genes in beacon-treated MG-63 and HEK-293 cells. Both collagen 1 and osteocalcin mRNA levels were greatly increased in MG-63 cells versus HEK-293 cells (Supplementary Fig. S3).
FIG. 2.

The molecular beacon for ALPL was tested in MG-63 (A, positive control) and HEK-293 (B, negative control) cells to ensure functionality and specificity. Fluorescence signals were observed throughout the MG-63 cells, while no signals were observed in HEK-293 cells. Color enhanced for presentation purposes. Scale bars: 100 μm. Insets show phase contrast image of sample. Color images available online at www.liebertpub.com/tea
Molecular beacon signaling in differentiating ASCs
ASCs undergoing osteogenic differentiation were treated with molecular beacons for ALPL assessed daily for 10 days. Percentages of positively signaling cells were calculated to monitor temporal gene expression patterns (Fig. 3). ALPL beacon-treated ASCs showed consistent positive signals in osteogenic samples for the entire experiment, starting at 21% on day 2, increasing to 64–82% by days 3–5 (p<0.0001), and coming back down slightly to 40–70% for days 6–10. A dip in expression existed at day 8; however, this was driven primarily by low signal percentages in one iteration of the experiment. The other iteration showed constant ALPL expression percentages of 50–70% for the entire 10-day period. Control ASCs that were not induced for osteogenesis showed significantly less fluorescence at all matched time points (p<0.0001). Expression percentages typically remained below 20%, with the exception being day 7, which again was driven by a disproportionately strong response from one iteration of the experiment.
FIG. 3.
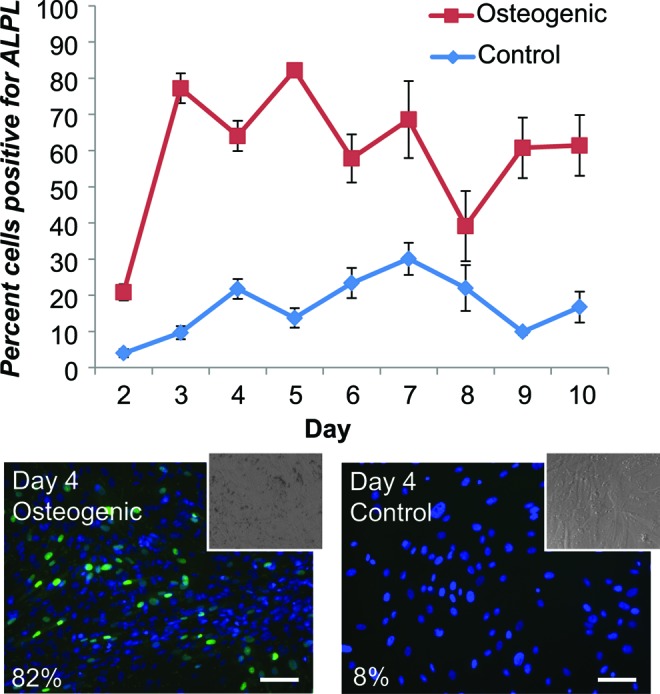
Percentage of ASCs expressing ALPL, measured daily from days 2–10. Higher percentages indicate days when most of the cells in a sample displayed positive signals for ALPL. These values can also be used as a measure of stem cell differentiation capacity, as positively differentiating cells should express osteogenic genes to a greater degree than nondifferentiating cells. The expression percentages cited earlier reflect the expected gene expression profiles for differentiating and control ASCs. Control populations show a higher-than-expected ALPL signal, although still significantly lower than the differentiated populations (p<0.0001). Representative images for osteogenic and control samples on day 4 are shown along with their calculated percentage expression (insets, brightfield images of same sample). Data collected from two iterations of the 10-day experiment (n=8). Mean±standard error. Color levels enhanced for presentation purposes. Scale bars: 100 μm. ASCs, adipose-derived stem cells. Color images available online at www.liebertpub.com/tea
Verification of osteogenesis
On day 7 of osteogenesis, both beacon-treated and untreated induced ASC samples had ∼300 U of alkaline phosphatase activity per cell, while all control ASCs had ∼5–10 U of activity per cell (Fig. 4, p<0.0001). On day 21, the optical density of Alizarin Red S dye eluted from osteogenically induced cells was thrice higher than in control samples (Fig. 5A, p<0.0001). Imaging of stained cells revealed a bright crimson color in osteogenically induced samples, while control samples retained little of the dye (Fig. 5B, C).
FIG. 4.

Alkaline phosphatase activity in control and induced ASC populations were significantly different, regardless of beacon presence (*p<0.0001). Activity in control samples was near zero, while activity in induced samples was two orders of magnitude higher. There were no significant differences in activity between beacon-treated and untreated samples undergoing osteogenesis, serving as both a signal of successful differentiation and evidence for uninterrupted protein synthesis in the presence of molecular beacons. Mean±standard deviation. Color images available online at www.liebertpub.com/tea
FIG. 5.
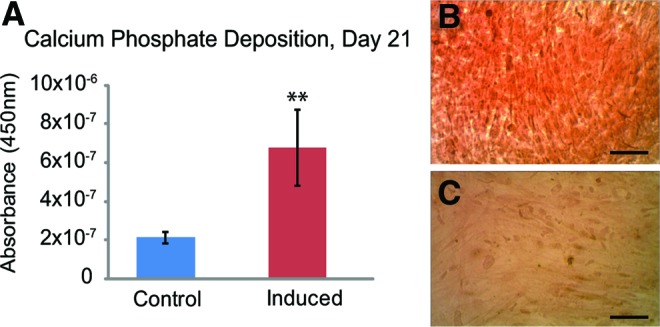
Chemically induced ASCs successfully underwent osteogenesis over 21 days. Absorbance values for eluted Alizarin Red S dye indicated that induced samples deposited thrice more calcified matrix than control samples (A, **p<0.0001). Induced (B) and control (C) ASCs stained with Alizarin Red S for 30 min showed clear, qualitative differences in calcified matrix deposition. Mean±standard deviation. Scale bars: 100 μm. Color images available online at www.liebertpub.com/tea
Discussion
This study marks the first time that temporal gene expression patterns in living ASCs undergoing osteogenesis have been measured and quantified. Results show that clear differences in live-cell gene expression can be detected using molecular beacons. ASCs, such as other mesenchymal stem cells, display considerable heterogeneity in their ability to differentiate in a uniform fashion, and a few methods exist that investigate this behavior.9 The goal of this study was to assess gene expression patterns during osteogenic differentiation at the subpopulation and population levels, thereby establishing a technique for investigating heterogeneity in differentiating ASC cultures. Differentiating ASC populations displayed dynamic expression patterns for an early osteogenic gene, ALPL, assessed by measuring the percentage of positively signaling cells over a 10 day period.
These experiments establish a technique to elucidate gene expression patterns and the degree of uniformity during osteogenesis. By testing our system in established cell lines, MG-63 and HEK-293, and using a housekeeping gene, GAPDH, we were able to verify specificity and uptake of the beacon into >97% of the cells in a population. Unlike standard gene transfection approaches, which rely on incorporating DNA into the genetic framework of the cell, “success” could be achieved simply by delivering the beacons into the cytoplasm, which is why the efficiency was so high. Subsequent measurement of the percentage of fluorescent, and therefore expressing, cells in the differentiating ASC populations showed a distinct pattern of up-regulation followed by a nominal steady-state expression of the gene from day 3 to 10. Initial expression levels began at ∼25% for ALPL in osteogenic samples at day 2 but rose quickly to a peak of ∼80% by days 3–5 and remained just below that level for the rest of the experiment. This ramped increase in percent ALPL expression was observed in multiple pilot studies as well, suggesting that the up-regulation of ALPL over the course of 3 days is nonuniform. Instead, individual ASCs began expressing ALPL on different days, with approximately one fifth of the cells exhibiting a positive signal starting at day 2, increasing to three quarters by day 3. This jump was observed for each of the samples measured those 2 days. An important point to note about the live-cell molecular beacon approach is that although the same samples were imaged each day, cellular proliferation and migration made it difficult to assess expression levels in the exact same cells over time. Hence, the “peak” in gene expression seen with our experiments reflects the day when the most cells were expressing ALPL at one time, but it is possible that some cells could have expressed ALPL earlier and then ceased expression. Cell-by-cell tracking would need to be done to determine those types of temporal changes.
Notably, each cell appears to be on its own track during differentiation. Some cells express the genes of interest very early on; for example, around 20% of cells express ALPL on day 2, though the peak percentage of cells expressing ALPL occurs on days 3–5. Cells that express genes early may also stop expressing genes sooner, which would explain the slight, gradual decrease from the peak percentage as opposed to a steep drop. In addition, when expression percentages are analyzed on a well-to-well basis, the variation in expression patterns is largest later in the experiment (days 6–10). The most uniform expression percentage is seen at the peak (days 3–5). The early expression heterogeneity can be explained by different initial responses to the osteogenic induction media, with some cells differentiating more quickly than others. The later expression heterogeneity can be explained, in part, by more noise in the system, with cellular “debris” being much more apparent on these days than early on. The debris (see brightfield images in Fig. 3) made it more difficult to obtain clear fluorescence patterns, and, in some cases, resulted in higher or lower background threshold levels when conducting image analysis. These expression patterns, especially for the early time points, serve as additional evidence for the heterogeneity of stem cell populations, as they relate to differentiation response and rate. In addition, it is important to note the possibility that even when nearly every cell in a population is differentiating, not all of them so do in the same timeframe.
The use of molecular beacons can be complicated by a number of possible artifacts. A common concern is false signals due to nonspecific binding, probe instability, probe background noise, and probe degradation.13,19,31,33–35 Nonspecific binding, or binding of probes to unintended targets, was not apparent in negative control HEK-293 cells. Likewise, noninduced ASCs treated with beacons showed almost no fluorescence, further indicating the absence of false-positive signals. While we feel these experiments are convincing evidence that nonspecific binding did not occur in our systems, time points beyond the 10-day experiment exhibited highly increased levels of false-positive signals in osteogenic cultures.32 This is hypothesized to be due, in part, to the cellular deposition of collagen and calcified matrix, which may interact with the lipid-based nanosomes and/or beacons to produce positive signals in the absence of mRNA binding. While early time points did not have this problem, studies with longer culture periods should be carefully monitored to determine true and false signals. Artifacts due to probe instability, background noise, and degradation were also not observed in the negative control cells (HEK-293 cells). If the probes were unstable or degrading, a signal would be noticeable, either as a point source or by elevated background levels. Positive signal intensities were much higher in the positive control samples (MG-63 cells) than in any of the negative controls.35 Independent of live-cell experiments, the beacon hybridization assay measured the background signal of probe alone, and data were normalized to this value, which was negligible compared with positive signals obtained in the same assay.
To confirm that osteogenic differentiation was successful, protein activity and deposition tests were performed on experimental samples. The alkaline phosphatase activity assay revealed protein activity that was two orders of magnitude higher in osteogenic samples than for controls, in both beacon-treated and untreated samples. There were no significant differences in activity between treated and untreated, induced samples, indicating that beacon hybridization to mRNA did not interfere with protein synthesis. In addition, optical densities of eluted ARS dye showed thrice higher levels in osteogenic samples compared with controls, and the imaging of ARS-stained cells revealed a scarlet coloring in osteogenic samples while control samples remained uncolored. ARS staining for calcified matrix is a commonly used and well-established method for assessing osteogenic differentiation. Staining with ARS and testing for activity with the alkaline phosphatase assay were meant to ensure that differentiation had, indeed, successfully occurred, which would not have been possible had significant gene knockdown occurred.
While these methods are commonly used to assess success rates of osteogenic differentiation, they possess pertinent limitations that our molecular beacon-based analyses overcome. Both of these assays collect data from the differentiating population as a whole, meaning that whether an individual cell has successfully differentiated or not, it is lumped into the analysis. These nondifferentiated cells obscure contributions from differentiating cells and can yield unclear data. In addition, the quantification of the data is oversimplified by reporting each parameter on a per-cell basis; this again makes the incorrect assumption that all cells are contributing equally to the assay. The use of molecular beacons to quantify the rate of differentiation enables us to make accurate subpopulation and population-based observations in a study by accounting for the heterogeneity present in the samples.
A practical limitation of this technique is its inability to quantify gene copy numbers within individual cells, akin to “gold standard,” real-time PCR analyses. Theoretically, the signal intensity from a beacon corresponding to an up-regulated gene could be compared with the fluorescence intensity of a beacon for a housekeeping gene such as 18S rRNA or GAPDH, but intensities of different fluorophores vary and are difficult to compare from cell to cell. Other limitations include the slight false positive rate, indicated by the 1–2% positive signal seen in HEK-293 cells, and the false negative rate, indicated by the 1–2% negative signal seen in MG-63 cells. These may be delivery method dependent, and, thus, could be solved for more sensitive assays. However, false positive and negative rates of 1–2% were sufficiently small for the current study and had a minimal impact on the interpretation of the results.
A comparison between RT-qPCR and beacon data provides interesting insights into the strengths and weaknesses of both techniques. Many studies have been performed that assess the RT-qPCR-based gene expression patterns of osteogenically differentiating ASCs.36–38 One of the strengths of RT-qPCR is that it enables quantitative comparisons among groups, whereas our molecular beacon approach only provides semi-quantitative comparisons that are associated with the number of cells expressing a given gene. However, RT-qPCR cannot describe how that gene expression is distributed across a sample cell population. Molecular beacons, while not providing hard mRNA copy numbers, can visually indicate which portions of a population are expressing the gene of interest. In addition, beacons can be used to repeatedly assess the same cell population over time. This is also not possible for RT-qPCR, which requires lysing of the sample to obtain mRNA for reverse transcription. Well-to-well variations in RT-qPCR data of heterogeneous samples could also be problematic, as they cannot easily distinguish among disparate differentiation behaviors for separate sample groups over time. Information associated with the well-specific data at each time point may be lost. In the current study, well-to-well data were used to monitor the amount of error present in the system and to attempt to assign that error to either the testing procedure or biological variation. In Figure 3, the error bars associated with each data point increase noticeably after day 5. This is shown more explicitly by plotting just the standard errors in a Supplementary Figure S4. Interestingly, the within-well standard error, that is, variations among images for a single well, remained relatively constant over the entire experiment at ∼5%. This suggests that the analysis technique is consistent over time. The well-to-well standard error, which reflects sample variability, shows an increase from ∼3% error to ∼8% error. We attribute the larger error observed in later time points partly to a divergence of individual samples along more or less osteogenic paths and partly to increased background signals caused by a more complex monolayer structure. Not only are more cells present due to proliferation, but there is also an accumulation of matrix that can exhibit autofluorescence. Analyses such as these require repeated measurements on the same sample, something that molecular beacons can achieve whereas conventional methods often cannot.
Increases in signal were attributed to up-regulation of ALPL, while decreases were attributed to a cessation or down-regulation of gene expression for ALPL. However, other possibilities exist. Beacon degradation was previously discussed as one but was shown to be only a possible contributor based on the low false positive rates observed in HEK-293 cells. A second possibility involves cellular proliferation; as cells divide, the cytoplasmic concentration of beacons decreases, resulting in less fluorescence per cell. To counter this, cells were treated with beacons at multiple time points, not just initially, to ensure sufficient beacon concentration in all cells. Interestingly, other groups have reported the persistence of nondegraded, chemically modified molecular beacons for approximately 21 days after treatment, indicating their potential resiliency.39
The uniformity of differentiation apparent from the results indicates that the cell population used in this study contained only modest levels of heterogeneity. Freshly isolated stromal vascular fractions, which contain ASCs, exhibit more heterogeneity and lower differentiation capability than serially passaged populations, such as the one used in this study.40 As a result, the peak percentages of cells expressing ALPL during differentiation are higher in passaged cells than might be expected, ∼80%. In freshly isolated, unpurified populations of stromal vascular cells, heterogeneity is likely more prevalent, which would yield peak percentages lower than those seen here, as fewer cells would be capable of differentiating along the osteogenic lineage.
The current study revealed dynamic gene expression patterns for the early osteogenic gene ALPL and established a method by which gene expression can be assessed in live cells over extended periods, findings that are useful for both continued studies of differentiation and elucidation of uniformity in differentiating populations. Molecular beacons can be developed for genes that are characteristic of other lineages to generate similar gene expression timelines. In addition, stem cell populations from diverse sources could be monitored in this way to compare their heterogeneity and differentiation capability. Likewise, these beacons could also be used to determine the effectiveness of other differentiation media or stimulation techniques in live-cell, experimental designs.
Conclusion
Stem cell heterogeneity continues to be a research obstacle for both basic science experiments and clinical applications. Tissue-engineered constructs that rely on stem cells face this problem regularly, though it is largely undefined. This study proposes a novel approach to investigate gene expression in stem cell populations, which can be applied to assessments of uniformity in these populations. Live, osteogenically differentiating ASCs were assessed repeatedly over a 10 day period to obtain temporal gene expression data that help elucidate up- and down-regulation of an early osteogenic marker in response to induction medium. In addition, the percentage of actively differentiating cells in a population was quantified, providing a novel method to measure and define heterogeneity in stem cell populations. The demonstrated molecular beacon technology enables the acquisition of live-cell, gene expression data to clarify aspects of heterogeneity in these potentially transformative cell populations.
Supplementary Material
Author Contributions
E.M.D. and H.V.D. designed the study, analyzed all molecular beacon and protein deposition data, and wrote this article. H.V.D. conducted all live-cell molecular beacon and protein deposition experiments. I.S.V. conducted and analyzed the in vitro hybridization assay. Q.C. and C.J. designed and analyzed all RT-qPCR experiments.
Acknowledgments
The authors thank Kian Adabi, Olivia S. Beane, Vera C. Fonseca, Manisha Kanthilal, and Nicholas R. Labriola for helpful discussions and contributions. This work was supported in part by National Institutes of Health grants R00AR054673 and P20GM104937.
Disclosure Statement
No competing financial interests exist.
References
- 1.Donizetti-Oliveira C., Semedo P., Burgos-Silva M., Cenedeze M.A., Malheiros D.M., Reis M.A., et al. . Adipose tissue-derived stem cell treatment prevents renal disease progression. Cell Transplant 21,1727, 2012 [DOI] [PubMed] [Google Scholar]
- 2.Gimble J.M., Grayson W., Guilak F., Lopez M.J., and Vunjak-Novakovic G.Adipose tissue as a stem cell source for musculoskeletal regeneration. Front Biosci (Schol Ed) 3,69, 2011 [DOI] [PMC free article] [PubMed] [Google Scholar]
- 3.Guilak F., Lott K.E., Awad H.A., Cao Q., Hicok K.C., Fermor B., et al. . Clonal analysis of the differentiation potential of human adipose-derived adult stem cells. J Cell Physiol 206,229, 2006 [DOI] [PubMed] [Google Scholar]
- 4.Guilak F., Estes B.T., Diekman B.O., Moutos F.T., and Gimble J.M.2010 Nicolas Andry Award: Multipotent adult stem cells from adipose tissue for musculoskeletal tissue engineering. Clin Orthop Relat Res 468,2530, 2010 [DOI] [PMC free article] [PubMed] [Google Scholar]
- 5.Locke M., Feisst V., and Dunbar P.R.Concise review: human adipose-derived stem cells: separating promise from clinical need. Stem Cells 29,404, 2011 [DOI] [PubMed] [Google Scholar]
- 6.Yoshimura K., Shigeura T., Matsumoto D., Sato T., Takaki Y., Aiba-Kojima E., et al. . Characterization of freshly isolated and cultured cells derived from the fatty and fluid portions of liposuction aspirates. J Cell Physiol 208,64, 2006 [DOI] [PubMed] [Google Scholar]
- 7.Gimble J.M., Guilak F., Nuttall M.E., Sathishkumar S., Vidal M., and Bunnell B.A.In vitro differentiation potential of mesenchymal stem cells. Transfus Med Hemother 35,228, 2008 [DOI] [PMC free article] [PubMed] [Google Scholar]
- 8.Zuk P.A., Zhu M., Mizuno H., Huang J., Futrell J.W., Katz A.J., et al. . Multilineage cells from human adipose tissue: Implications for cell-based therapies. Tissue Eng 7,211, 2001 [DOI] [PubMed] [Google Scholar]
- 9.Russell K.C., Phinney D.G., Lacey M.R., Barrilleaux B.L., Meyertholen K.E., and O'Connor K.C.In vitro high-capacity assay to quantify the clonal heterogeneity in trilineage potential of mesenchymal stem cells reveals a complex hierarchy of lineage commitment. Stem Cells 28,788, 2010 [DOI] [PubMed] [Google Scholar]
- 10.Tyagi S., and Kramer F.R.Molecular beacons: probes that fluoresce upon hybridization. Nat Biotechnol 14,303, 1996 [DOI] [PubMed] [Google Scholar]
- 11.Manganelli R., Tyagi S., and Smith I.Real time PCR using molecular beacons: a new tool to identify point mutations and to analyze gene expression in Mycobacterium tuberculosis. Methods Mol Med 54,295, 2001 [DOI] [PubMed] [Google Scholar]
- 12.Mhlanga M.M., Vargas D.Y., Fung C.W., Kramer F.R., and Tyagi S.tRNA-linked molecular beacons for imaging mRNAs in the cytoplasm of living cells. Nucleic Acids Res 33,1902, 2005 [DOI] [PMC free article] [PubMed] [Google Scholar]
- 13.Rhee W.J., and Bao G.Simultaneous detection of mRNA and protein stem cell markers in live cells. BMC Biotechnol 9,30, 2009 [DOI] [PMC free article] [PubMed] [Google Scholar]
- 14.Santangelo P.J., Nix B., Tsourkas A., and Bao G.Dual FRET molecular beacons for mRNA detection in living cells. Nucleic Acids Res 32,e57, 2004 [DOI] [PMC free article] [PubMed] [Google Scholar]
- 15.Tsourkas A., and Bao G.Shedding light on health and disease using molecular beacons. Brief Funct Genomics Proteomics 1,372, 2003 [DOI] [PubMed] [Google Scholar]
- 16.Baker M.B., Bao G., and Searles C.D.In vitro quantification of specific microRNA using molecular beacons. Nucleic Acids Res 40,e13, 2012 [DOI] [PMC free article] [PubMed] [Google Scholar]
- 17.Kim E.K., Lim S., Park J.M., Seo J.K., Kim J.H., Kim K.T., et al. . Human mesenchymal stem cell differentiation to the osteogenic or adipogenic lineage is regulated by AMP-activated protein kinase. J Cell Physiol 227,1680, 2012 [DOI] [PubMed] [Google Scholar]
- 18.Abrahamsson C.K., Yang F., Park H., Brunger J.M., Valonen P.K., Langer R., et al. . Chondrogenesis and mineralization during in vitro culture of human mesenchymal stem cells on three-dimensional woven scaffolds. Tissue Eng Part A 16,3709, 2010 [DOI] [PMC free article] [PubMed] [Google Scholar]
- 19.Estes B.T., Diekman B.O., and Guilak F.Monolayer cell expansion conditions affect the chondrogenic potential of adipose-derived stem cells. Biotechnol Bioeng 99,986, 2008 [DOI] [PMC free article] [PubMed] [Google Scholar]
- 20.Mathews D.H., Turner D.H., and Zuker M.RNA secondary structure prediction. In: Beaucage S.L., et al., eds. Current Protocols in Nucleic Acid Chemistry. Chapter 28:11.2.1–11.12.17, 2007 [DOI] [PMC free article] [PubMed] [Google Scholar]
- 21.Zuker M.Mfold web server for nucleic acid folding and hybridization prediction. Nucleic Acids Res 31,3406, 2003 [DOI] [PMC free article] [PubMed] [Google Scholar]
- 22.Mount D.W.Using the basic local alignment search tool (BLAST). CSH Protoc 2007, pdb.top17, 2007 [DOI] [PubMed] [Google Scholar]
- 23.Altschul S.F., Gish W., Miller W., Myers E.W., and Lipman D.J.Basic local alignment search tool. J Mol Biol 215,403, 1990 [DOI] [PubMed] [Google Scholar]
- 24.Bao G., Rhee W.J., and Tsourkas A.Fluorescent probes for live-cell RNA detection. Annu Rev Biomed Eng 11,25, 2009 [DOI] [PMC free article] [PubMed] [Google Scholar]
- 25.Bratu D.P., Catrina I.E., and Marras S.A.Tiny molecular beacons for in vivo mRNA detection. Methods Mol Biol 714,141, 2011 [DOI] [PubMed] [Google Scholar]
- 26.Rothem D.E., Rothem L., Soudry M., Dahan A., and Eliakim R.Nicotine modulates bone metabolism-associated gene expression in osteoblast cells. J Bone Miner Metab 27,555, 2009 [DOI] [PubMed] [Google Scholar]
- 27.Mueller S.M., and Glowacki J.Age-related decline in the osteogenic potential of human bone marrow cells cultured in three-dimensional collagen sponges. J Cell Biochem 82,583, 2001 [DOI] [PubMed] [Google Scholar]
- 28.Santangelo P.J., Nitin N., and Bao G.Direct visualization of mRNA colocalization with mitochondria in living cells using molecular beacons. J Biomed Opt 10,44025, 2005 [DOI] [PubMed] [Google Scholar]
- 29.Bunnell B.A., Estes B.T., Guilak F., and Gimble J.M.Differentiation of adipose stem cells. Methods Mol Biol 456,155, 2008 [DOI] [PubMed] [Google Scholar]
- 30.Lamprecht M.R., Sabatini D.M., and Carpenter A.E.CellProfiler: free, versatile software for automated biological image analysis. BioTechniques 42,71, 2007 [DOI] [PubMed] [Google Scholar]
- 31.Carpenter A.E., Jones T.R., Lamprecht M.R., Clarke C., Kang I.H., Friman O., et al. . CellProfiler: image analysis software for identifying and quantifying cell phenotypes. Genome Biol 7,R100, 2006 [DOI] [PMC free article] [PubMed] [Google Scholar]
- 32.Desai H.V., Voruganti I.S., Jayasuriya C., Chen Q., and Darling E.M.Live-cell, temporal gene expression analysis of osteogenic differentiation in adipose-derived stem cells. Tissue Eng Part A 19,40, 2013 [DOI] [PMC free article] [PubMed] [Google Scholar] [Retracted]
- 33.Vet J.A., and Marras S.A.Design and optimization of molecular beacon real-time polymerase chain reaction assays. Methods Mol Biol 288,273, 2005 [DOI] [PubMed] [Google Scholar]
- 34.Agis H., Schrockmair S., Skorianz C., Fischer M.B., Watzek G., and Gruber R.Platelets increase while serum reduces the differentiation and activity of osteoclasts in vitro. J Orthop Res 31,1561, 2013 [DOI] [PubMed] [Google Scholar]
- 35.Rothem D.E., Rothem L., Dahan A., Eliakim R., and Soudry M.Nicotinic modulation of gene expression in osteoblast cells, MG-63. Bone 48,903, 2011 [DOI] [PubMed] [Google Scholar]
- 36.Frank O., Heim M., Jakob M., Barbero A., Schafer D., Bendik I., et al. . Real-time quantitative RT-PCR analysis of human bone marrow stromal cells during osteogenic differentiation in vitro. J Cell Biochem 85,737, 2002 [DOI] [PubMed] [Google Scholar]
- 37.Pittenger M.F., Mackay A.M., Beck S.C., Jaiswal R.K., Douglas R., Mosca J.D., et al. . Multilineage potential of adult human mesenchymal stem cells. Science 284,143, 1999 [DOI] [PubMed] [Google Scholar]
- 38.Zuk P.A., Zhu M., Ashjian P., De Ugarte D.A., Huang J.I., Mizuno H., et al. . Human adipose tissue is a source of multipotent stem cells. Mol Biol Cell 13,4279, 2002 [DOI] [PMC free article] [PubMed] [Google Scholar]
- 39.King F.W., Liszewski W., Ritner C., and Bernstein H.S.High-throughput tracking of pluripotent human embryonic stem cells with dual fluorescence resonance energy transfer molecular beacons. Stem Cells Dev 20,475, 2011 [DOI] [PMC free article] [PubMed] [Google Scholar]
- 40.Estes B.T., Wu A.W., Storms R.W., and Guilak F.Extended passaging, but not aldehyde dehydrogenase activity, increases the chondrogenic potential of human adipose-derived adult stem cells. J Cell Physiol 209,987, 2006 [DOI] [PubMed] [Google Scholar]
Associated Data
This section collects any data citations, data availability statements, or supplementary materials included in this article.