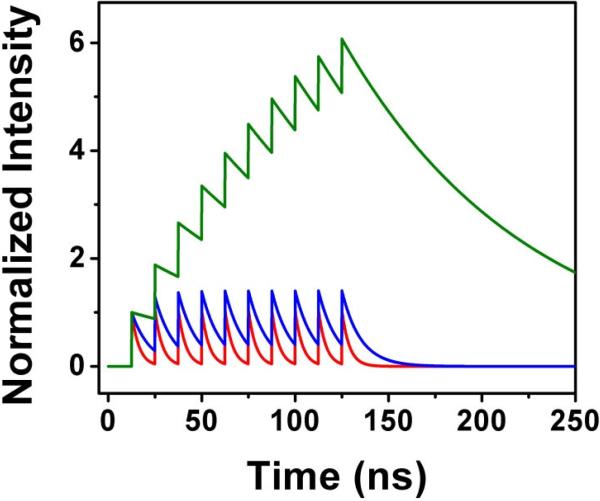
Figure 2.
Model of fluorescence decay from bursts of 10 excitation pulses. The red line shows the calculated decay curve for a fluorophore with a 4 ns lifetime, the blue line for 10 ns, and the green line for 100 ns. The repetition rate for the pulses within the burst was 80 MHz, or 12.5 ns between pulses.

