SUMMARY
Mitochondrial stress results in changes in mitochondrial function, morphology and homeostasis (biogenesis, fission/fusion, mitophagy) and may lead to changes in mitochondrial subpopulations. While flow cytometric techniques have been developed to quantify features of individual mitochondria related to volume, Ca2+ concentration, mtDNA content, respiratory capacity and oxidative damage, less information is available concerning the identification and characterization of mitochondrial subpopulations, particularly in epithelial cells. Mitochondria from rabbit kidneys were stained with molecular probes for cardiolipin content (nonyl acridine orange, NAO) and membrane potential (tetramethylrhodamine, TMRM) and analyzed using flow cytometry. We validated that side scatter was a better indicator of volume and that as side scatter (SSC) decreased mitochondrial volume increased. Furthermore, those mitochondria with the highest NAO content had greater side scattering and were most highly charged. Mitochondria with average NAO content were of average side scattering and maintained an intermediate charge. Those mitochondria with low NAO content had minimal side scattering and exhibited minimal charge. Upon titration with the uncoupler carbonylcyanide-4-(trifluoromethoxy)-phenylhydrazone (FCCP), it was found that the high NAO content subpopulations were more resistant to uncoupling than lower NAO content populations. Ca2+-induced swelling of mitochondria was evaluated using probability binning (PB) analyses of SSC. Interestingly, only 30% of the mitochondria showed changes in response to Ca2+, which was blocked by cyclosporine A. In addition, the small, high NAO content mitochondria swelled differentially in response to Ca2+ over time. Our results demonstrate that flow cytometry can be used to identify mitochondrial subpopulations based on high, mid and low NAO content and/or volume/complexity. These subpopulations showed differences in membrane potential, volume, and responses to uncoupling and Ca2+-induced swelling.
Keywords: mitochondria, heterogeneity, flow cytometry, kidney, subpopulations
INTRODUCTION
While mitochondrial heterogeneity exists within cells and tissues, little advancement in examining this heterogeneity has been achieved because of technological limitations. Electron microscopy was used to examine mitochondrial heterogeneity historically and newer multi-photon confocal microscopes and mitochondrial stains have enabled fluorescent measurements along multiple z-planes and sophisticated 3-dimensonal reconstructions of individual mitochondria [1]. However, these techniques are limited to small regions of interrogation and limited sampling of functional heterogeneity.
Two examples of mitochondrial heterogeneity that have been well studied are found in cardiomyocytes and skeletal muscle [1, 2]. In both cases, two distinct types of mitochondria exist, interfibrillar (IFM) and subsarcolemmal (SSM) and these populations can be physically separated [1]. SSM are located beneath the sarcolemma in cardiac and skeletal muscle, while IFM are located between the myofibrils in cardiac and skeletal muscle. It’s been suggested that the location of these two types of mitochondria define their role within the cell [2, 3]. In cardiac mitochondria, functional differences between the two types are mainly seen in Ca2+ content and membrane potential [1, 4]. IFM usually have higher respiration rates, higher Ca2+ levels and higher protein content [1, 3, 5, 6]. Enzymatic activity and respiration of IFM also have been reported to decline with aging [7], while SSM have higher membrane cardiolipin content [3, 5, 6]. Studies of skeletal muscle mitochondria also identified differences between IFM and SSM. Skeletal muscle IFM have increased protein import and protein synthesis, higher respiration, higher ATP content, increased complex IV and F0F1-ATP synthase activities, and increased enzymatic activities (e.g. succinate/dehydrogenase activity) [8–13]. SSM express more UCP3, oxidative flavoproteins, adenine nucleotide transferase and aconitase, and have higher fractional cardiolipin and Ca2+ content [9, 12, 14, 15]. Skeletal SSM are less tightly coupled compared to IFM [9, 12, 14, 15].
A growing amount of evidence indicates that mitochondrial fusion-fission and mitophagy have a role in mitochondrial heterogeneity via regulation of mitochondrial function, shape and number [1, 16, 17]. Fusion is likely to protect mitochondrial function by providing an opportunity for mitochondria to mix their contents to maintain functional mitochondria within the cell. Disruption of fusion results in increased heterogeneity of membrane potentials and reduced respiratory capacity [1, 17]. Fission acts to facilitate equal segregation of mitochondria into daughter cells during cell division and to isolate damaged segments of mitochondria and promote their autophagy [16]. In the absence of stress, fission events occur as a part of fusion-fission cluster, while under stress, fission events will occur independently to help segregate and eliminate dysfunctional units [16, 18]. Consequently, conditions that affect mitochondrial dynamics and autophagy can lead to increased heterogeneity [1].
A major challenge to the study mitochondrial functional heterogeneity is the need for techniques to isolate, quantify and characterize subpopulations. Recently, flow cytometry in combination with fluorescent probes, such as nonyl-acridine orange (NAO) and tetramethylrhodamine methyl ester (TMRM) that stain for cardiolipin content and membrane potential, respectively, have been used to study mitochondrial function and morphology. Advantages of flow cytometry include the ability to use crude preparations, small sample sizes, and the potential to identify subpopulations throughout the entire sample population via multiparametric analyses [19–21]. However, little has been done to characterize subpopulations and investigate their potential roles in pathologies.
Two groups have reported subpopulations of rat liver mitochondria distinguished by differences in membrane potentials as measured with Rhodamine 123 staining via flow cytometry [22, 23]. Another group reported that the addition of FCCP depolarized all but a small cluster of mitochondria that maintained a high membrane potential [5]; however, these subpopulations were not further characterized. The goal of this study was to use flow cytometry with probability binning analyses to characterize subpopulations of renal epithelial mitochondria during homeostasis and stress.
EXPERIMENTAL PROCEDURES
Isolation of mitochondria
Kidneys were obtained using blunt dissection from New Zealand White female rabbits and immediately placed in mitochondrial isolation buffer (0.27 M sucrose, 5 mM Tris-HCl, 1 mM EGTA, pH=7.4). The cortex was cut off, diced into smaller pieces, homogenized in isolation buffer and mitochondria were isolated using differential centrifugation at 4°C as previously described [24, 25]. Briefly, the homogenate was centrifuged at 1,400 g for 10 min and the resulting supernatant was subjected to 10,000 g for 5 min. The mitochondrial pellet was resuspended in isolation buffer and spun again at 10,000 g for 5 min. The resulting pellet was resuspended and spun at 1,000 g for 10 min to remove any remaining debris and the supernatant was spun at 7,400 g for 10 min to obtain mitochondria. The final pellet was resuspended in mitochondrial isolation buffer with 0.1% BSA added to reduce aggregation.
Flow Cytometry
The mitochondria were diluted to a concentration of ~ 60 µg/mL in analysis buffer (250 mM sucrose, 20 mM MOPS, 10 mM Tris-Base, 100 µM Pi(K), 0.5 mM MgCl2, pH=7.0) containing 5 mM succinate and 0.1 µg/µL rotenone [19]. Mitochondria were stained with NAO (200 nM) and TMRM (200 nM) for 10 min at room temperature. 10,000 events were collected for each run.
To examine mitochondrial swelling, mitochondria in the swelling buffer (130 mM KCl, 9 mM Tris-PO4, 9 mM Tris-HCl, 1 mM EGTA, pH=7.4) containing 5 mM malate and 5 mM pyruvate on ice were incubated with NAO (200 nM) and TMRM (200 nM) and exposed to Ca2+ (0 µM, 200 µM) with and without cyclosporine A (1 µM). Cyclosporine A was added after 5 min of staining with NAO and TMRM. After incubating for another 5 min, Ca2+ was added and data were collected from eight sequential runs, approximately 2 min apart.
UV-Vis Analysis of Mitochondrial Swelling
After the final spin, the mitochondrial pellet was resuspended in mitochondrial isolation buffer and four 125 µL aliquots were removed and re-pelleted. The mitochondria were resuspended in mitochondrial swelling buffer. Mitochondria in the swelling buffer were added to a 96-well plate and exposed to Ca2+(Cl2) (0 µM, 200 µM total) with and without the addition of cyclosporine A (1 µM). Cyclosporine A (CsA) was added 5 min prior to Ca2+ addition.
Data Analysis
Flow cytometry data were collected on a Becton Dickinson FACScan using CellQuest software (version 3.3, Becton Dickinson). Data were further analyzed using FlowJo software (Version 7.6.1, TreeStar, Ashland, OR). Subpopulations of control mitochondria were established using gates with differing intensities of NAO fluorescence and then means and geometric means of staining for TMRM, side scatter (SSC) and forward scatter (FSC) were analyzed.
Swelling data were analyzed on the gated population and probability binning on SSC (bin = 1000) was done using the population comparison tool in FlowJo. This analysis method evaluates statistically significant differences between sample and control populations. The control population data are divided into n-rectangles each containing the same number of data points [26]. The resulting grid of bins is applied to all sample populations and the rectangles that contain a statistically significant increase in data points are identified. If there was no statistically significant increase in a rectangle, then the space remains empty. Because this technique only accounts for an increase in data points, the binning was done in two sequences. First, the initial pre-Ca2+ addition data were used as the control, and all datasets acquired post Ca2+ addition were used as samples – the analysis thus quantifies increased intensities relative to the pre-Ca2+ control sample. Second, each time point was binned individually using the previous or following time point as the control – the analysis thus quantifies increased intensities relative to the previous time point and decreased intensities relative to the following time point. Means and geometric means were calculated for SSC and NAO for each time point and each binning difference.
Polystyrene particle scattering
Polystyrene particles produced via emulsion polymerization were obtained from Spherotech (Lake Forest, IL). The size of the particles as determined via laser particle sizing and/or scanning electron microscopy were 0.2–0.3 µm, 0.4–0.6 µm, and 0.7–0.9 µm. The SSC and FSC were measured with the FACScan using the same detector settings used for mitochondria. Angular scattering intensity was calculated assuming simple spherical particles with the average radii of the particles, an incident λ = 488 nm, medium nD = 1.33, and particle nD = 1.59. The scattering was calculated via solutions to Maxwell’s equations using MieCalc (http://www.lightscattering.de/MieCalc/eindex.html).
RESULTS
Correlated morphological and staining properties suggest subpopulations
Isolated mitochondria, in the presence of the metabolic substrate succinate and the complex 1 inhibitor rotenone, were analyzed by flow cytometry using NAO and TMRM stains. Although mitochondria can be purified via sucrose or Percoll gradients, doing so may result in the loss mitochondria and/or specific subpopulations. Thus, purification was not used prior to flow cytometry analyses. Mitochondria were stained with NAO to quantify cardiolipin, a lipid found in high concentrations in mitochondrial membrane [27, 28]. A normally distributed population of 10,000 events was observed and particles staining below 2 units of relative fluorescence were defined as debris and not included in the final analyses.
FSC and SSC are used routinely to characterize particle volume and granularity, respectively, although FSC and SSC have been used interchangeably to characterize the volume of very small particles such as bacteria and mitochondria [19–22, 29–32]. TMRM is a potentiometric dye that accumulates in the mitochondrial matrix based on inner-membrane potential [19]. Figure 1 illustrates the gating schematic for control mitochondria in the presence of succinate/rotenone. The data were first plotted using FSC and SSC, which reveal size and complexity. The data were re-plotted using SSC and NAO and a gate was used to remove debris along the axes. The data were re-plotted again using FSC and TMRM. Again, debris along the axes was removed using a gate.
FIGURE 1.
Gating schematic for mitochondria. Mitochondria were stained with NAO (200 nM) and TMRM (200 nM), subjected to flow cytometry, and 10,000 data points collected for each sample (A). Debris located along the axes was gated out (B, C). A representative histogram of NAO staining after gating (D). The ‘high’ gate was set at 400 – 3000 fluorescence units (~14% of the population). The ‘medium’ gate is 120 – 200 fluorescence units (~14% of the population). The ‘low’ gate is 20 – 50 fluorescence units ~8% of the population. Fluorescence units < 20 was defined as debris. Representative data from 10 experiments.
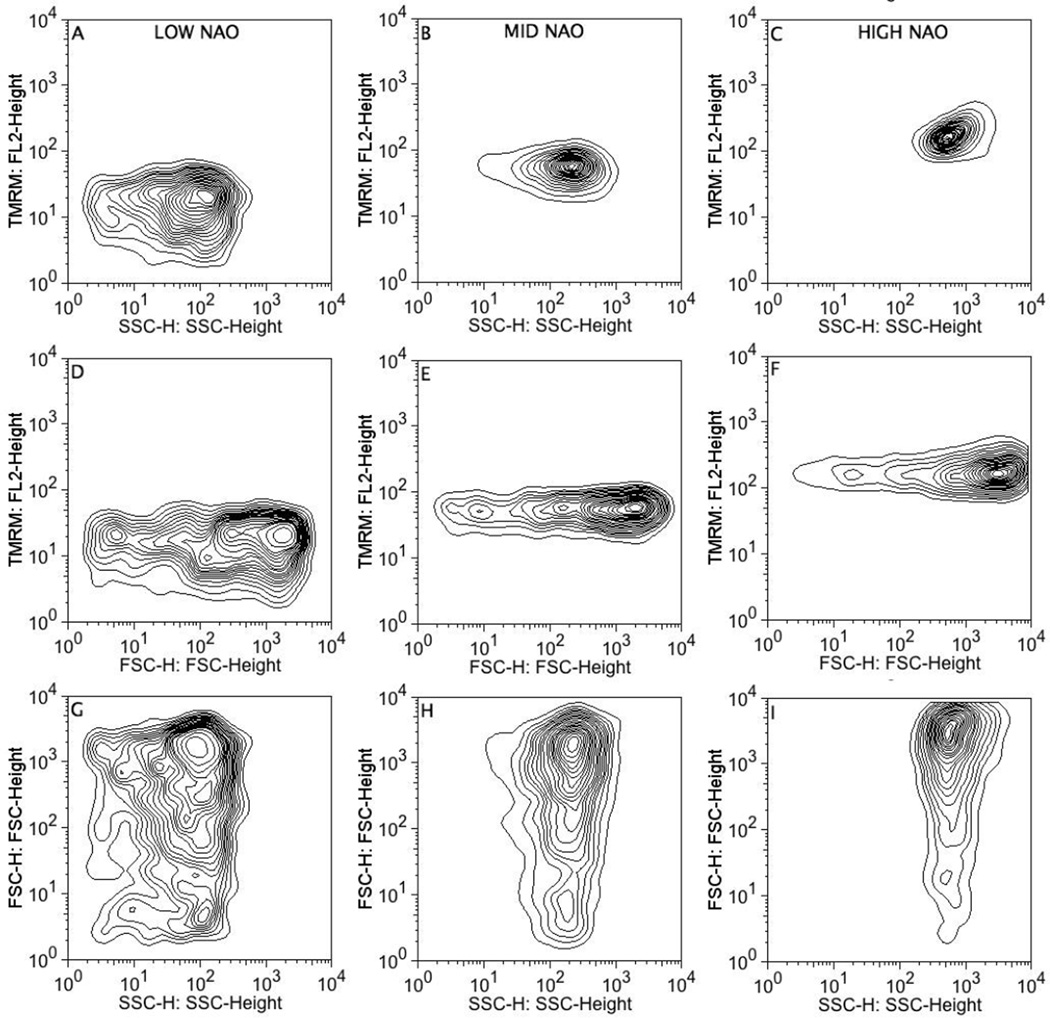
To evaluate potential subpopulations within the mitochondria, NAO staining was gated based on ‘low’, ‘medium’, and ‘high’ NAO fluorescence, representing 8–14 percent of the population per gate (Fig. 1D), and TMRM, SSC, and FSC were examined. TMRM and SSC were tightly correlated among low, medium and high NAO subpopulations (Fig. 2A–C). For example, mitochondria in the high NAO population exhibited high SSC and high TMRM fluorescence (Fig. 2C). Conversely, mitochondria in the low NAO population exhibited low SSC and low TMRM fluorescence, and overall greater variance (Fig. 2A). In contrast, FSC values were spread broadly across all three NAO subpopulations whether plotted against SSC or TMRM (Fig. 2D–I). The FSC dispersion indicates that FSC values are not well correlated with SSC, NAO or TMRM. In summary, mitochondrial subpopulations based on cardiolipin content were identified and defined by SSC and membrane potential.
FIGURE 2.
Correlations between mitochondrial TMRM staining, SSC and FSC after gating on cardiolipin content (NAO). Mitochondria were stained with NAO (200 nM) and TMRM (200 nM), subjected to flow cytometry, 10,000 data points were collected for each sample, and gated as described in Fig. 1. Representative data from 10 experiments.
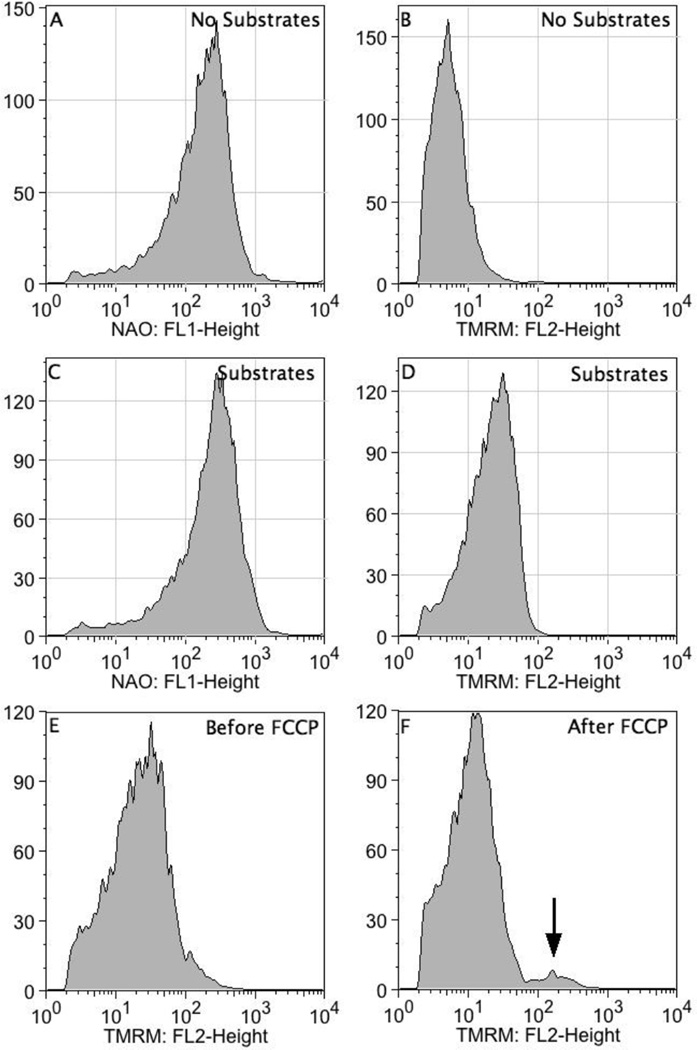
Although NAO binds to cardiolipin-containing membranes, it is also a positively charged and therefore has the potential to accumulate in mitochondria based on the inner-membrane potential [27, 28]. To address the possibility we measured NAO fluorescence in polarized (succinate + rotenone) and non-polarized mitochondria (no substrate). While TMRM staining increased in polarized mitochondria, NAO exhibited similar staining in polarized and non-polarized mitochondria, providing evidence that mitochondrial NAO fluorescence primarily reflects cardiolipin content, not inner-membrane potential (Fig. 3A–D).
FIGURE 3.
NAO staining is not the result of mitochondrial membrane potential. Mitochondria in the presence and absence of substrates (succinate + 0.1 µg/µL rotenone) were stained with NAO (200 nM) and TMRM (200 nM). In the upper and middle panels are representative data for NAO and TMRM in the absence and presence of substrates, respectively. In the bottom panels, polarized mitochondria were treated with 0.5 µM FCCP to dissipate the proton gradient. It should be noted that a small fraction of mitochondria were resistant to FCCP (see arrow). Representative data from 4 experiments.
We also examined TMRM staining in polarized mitochondria in the presence and absence of different concentrations of the protonophore FCCP (0.5 µM and 3 µM). FCCP (0.5 µM) produced a pronounced decrease in TMRM staining, although a small population remained polarized (Fig. 3F). At the 3 µM concentration of FCCP, the 0.5 µM FCCP-resistant subpopulation depolarized and was not observed (data not shown).
FSC and SSC intensities are related to particle volume, refractive index, and internal complexity for heterogeneous particles. For cells and many bacteria where the wavelength of the incident laser is smaller than the particle, FSC is primarily a measure of particle volume and SSC is more a measure of refractive index and complexity. However, the wavelengths of flow cytometer lasers are similar in size to sub-cellular organelles and both FSC and SSC have been reported to be measures of mitochondrial volume [22 – 24]. The relationship between absolute FSC and SSC intensities and particle volume is dependent upon the specific angular cross-section captured by each detector, the extent of signal attenuation between the flow cell and detectors, the incident laser intensities and corresponding detector types (e.g, photodiode, photomultiplier, etc). To calibrate the FACScan FSC and SSC intensities to particle volume within the anticipated volume regions, scattering intensities of monodisperse polypropylene beads with defined diameters were measured.
Ultrastructural studies of isolated mitochondria, as assessed via transmission electron microscopy, indicate that the particles are approximately spherical with diameters ranging from 300 – 1000 nm [33–35]. The median diameter estimated from several microscopic studies is approximately 500 nm and the overall distribution of sizes has the characteristics of a Weibull distribution with a standard error of kurtosis of 1.25 (normalized median) and an abrupt cutoff at about 250 nm. The abrupt cutoff at smaller volumes is consistent with the low thermodynamic stability of lamellar vesicle with high radii of curvature [36]. A previous study that used coulter counting to measure mitochondria volumes found the mean diameter of mitochondria from rat kidney cortex to be approximately 760 nm [37]. The lower limit of detection was 480 nm so it is possible that these data were skewed from detection of smaller mitochondria.
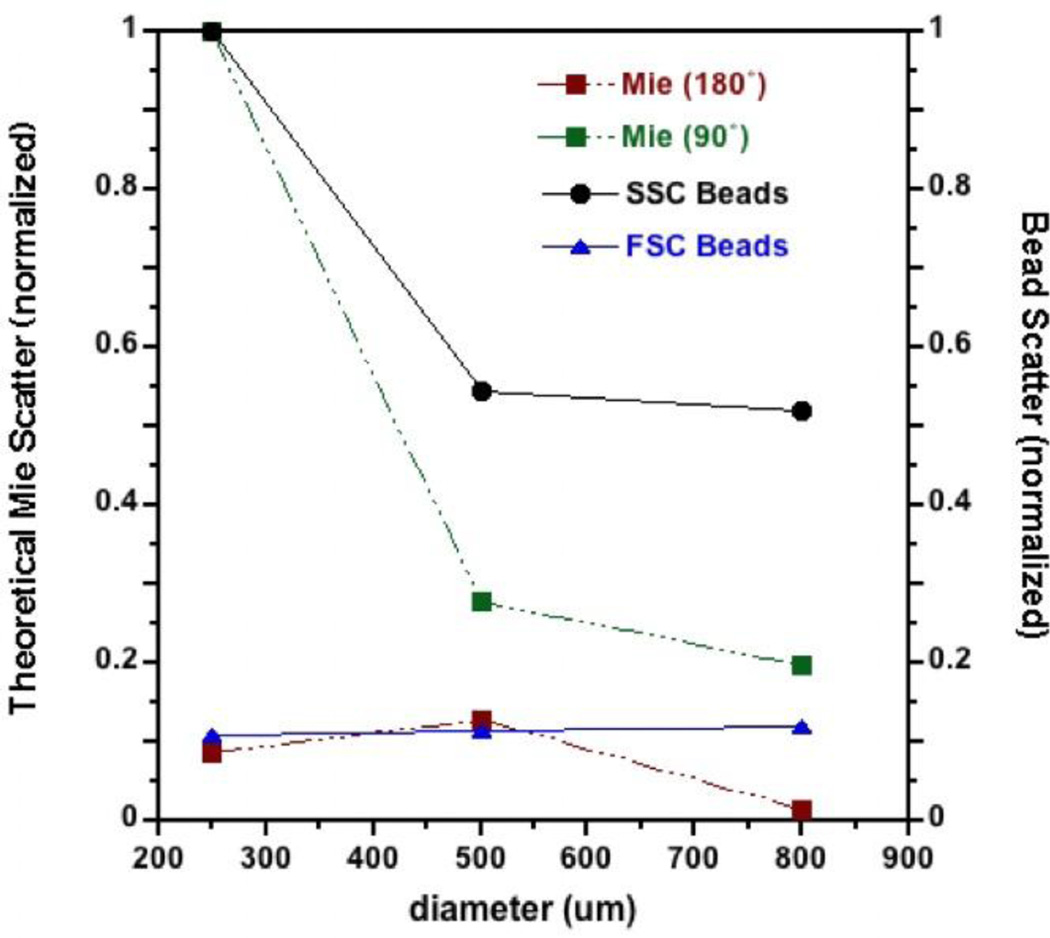
Monodisperse polypropylene beads with average diameters of 250, 500, and 800 nm were characterized for FSC and SSC using the same detector gain settings used for analyses of mitochondria. Because the absolute values of scattering intensities are instrument specific, the measured intensities were normalized to the SSC values for the 250 nm beads. The FSC intensities exhibited little change over this range of volumes whereas the SSC intensities decreased approximately 50% between 250 and 500 nm and did not decrease further at 800 nm (Fig. 4). Theoretical scattering intensities at 180° and 90° (representing FSC and SSC, respectively) that were calculated with Mie theory and normalized to the calculated SSC values for 250 nm beads, exhibited similar trends as the direct measurements. We suggest that SSC is the better estimate of particle volume for mitochondria and that it is difficult to discriminate the volumes of large mitochondria.
FIGURE 4.
Mitochondrial volume is best represented by SSC. FSC and SSC intensities for monodisperse polypropylene beads with diameters 200 – 300 nm, 400 – 600 nm, and 700 – 900 nm were measured using the same flow cytometer gain settings used for mitochondria. Theoretical scattering intensities at 180° and 90° from the incident beam (i.e., theoretical FSC and SSC, respectively) for particles with the same volumes as calculated via Mie theory. The scattering intensities for both measured and theoretical intensities are normalized to the SSC values for 250 nm diameter particles.
Mitochondrial Swelling
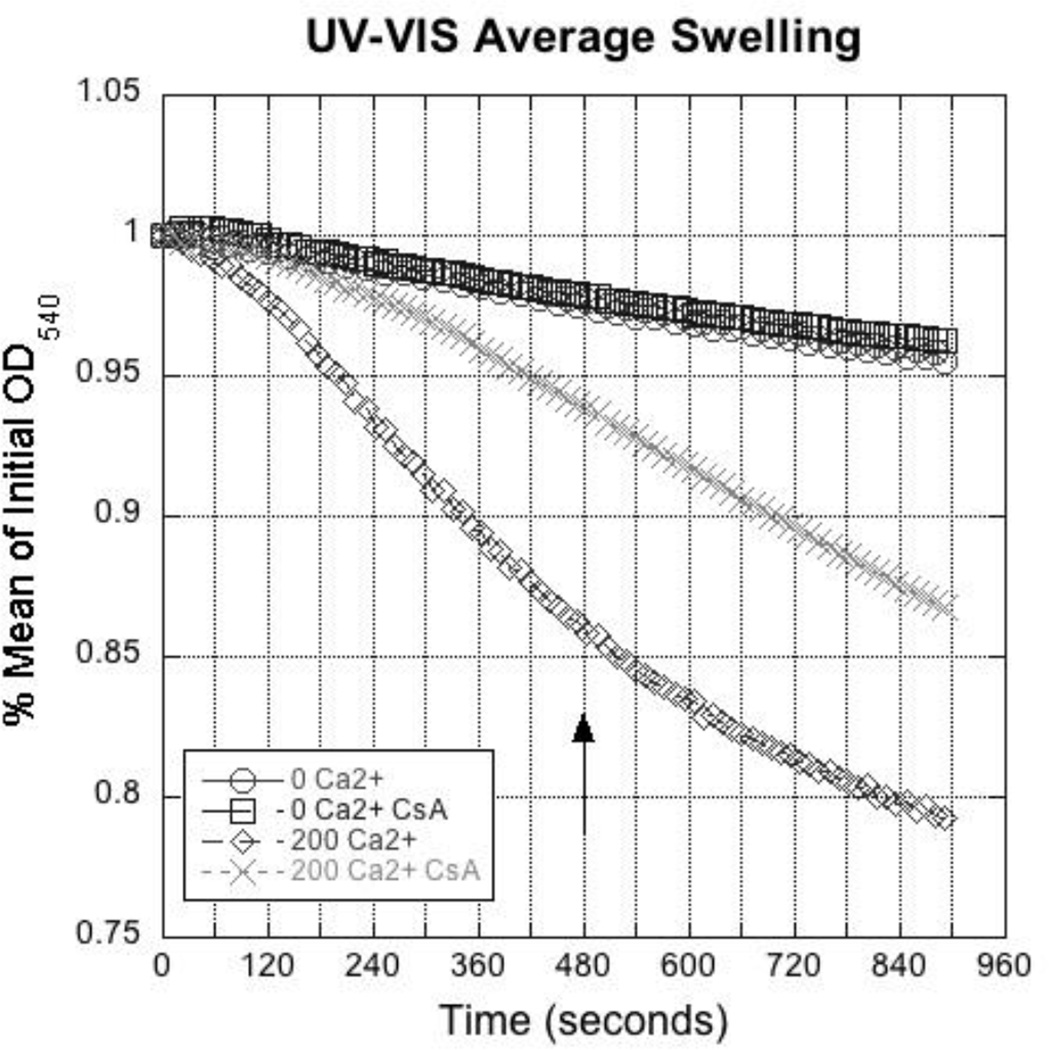
A number of stressors can initiate mitochondrial swelling and a common assay involves adding Ca2+ to a suspension of mitochondria to increase potassium ion permeability [37]. As the mitochondria increase in volume, the dilution of enclosed proteins and cristae unfolding reduce the effective refractive index, which can be easily measured as a decrease in absorbance using a spectrophotometer. Isolated renal mitochondria were treated with 200 µM Ca2+ and swelling was measured as a decrease in optical density at 540 nm (Fig. 5). Ca2+ decreased optical density (% absorbance at time = 0 min) approximately 15% after 8 min (Fig. 5, arrow). Pretreatment with cyclosporine A (CsA, 1 µM), an inhibitor of mitochondrial permeability transition pore opening, protected from swelling for the first 4 min, but not at later times. Similar kinetics and magnitudes of swelling have previously been observed in renal mitochondria and mitochondria from other tissues [38].
FIGURE 5.
Ca2+-induced mitochondrial swelling using UV-Vis spectrometry. Isolated mitochondria were exposed 0 or 200 µM Ca2+, and swelling was measured as a decrease in absorbance at 540 nm (mean % of initial OD540). The mitochondrial cyclophillin and permeability transition inhibitor CsA (1 µM) was added 5 min prior to Ca2+ addition. Representative data from 10 experiments.
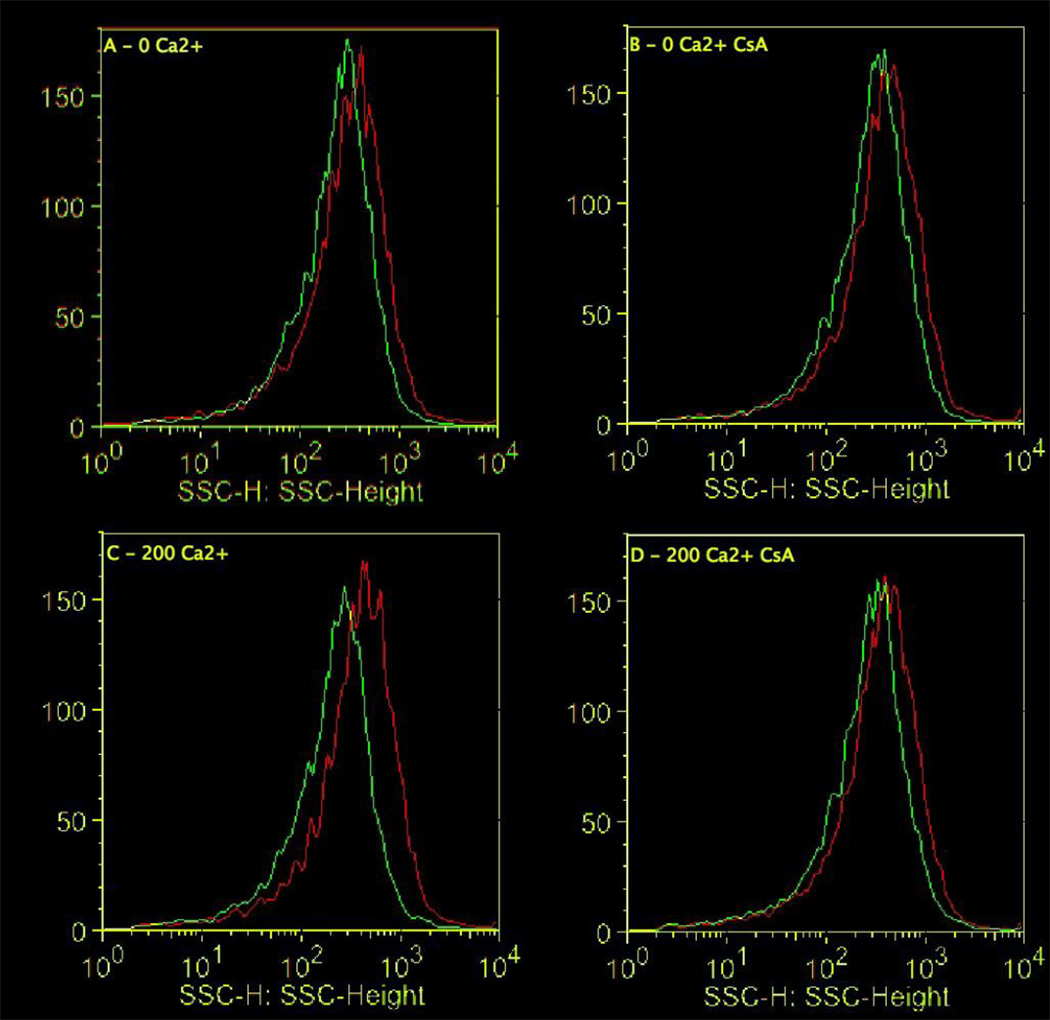
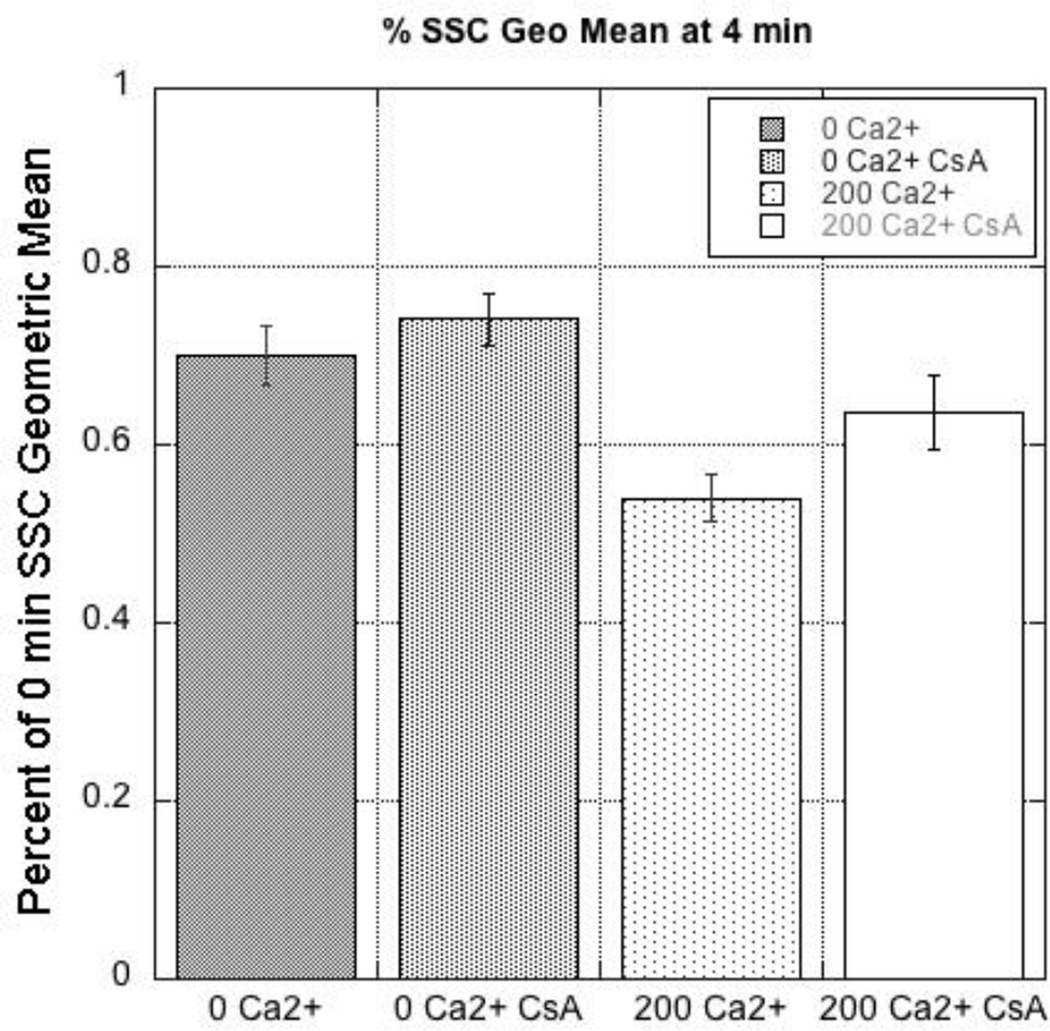
To evaluate the Ca2+-induced swelling via flow cytometry, mitochondria were stained with NAO and TMRM to identify polarized mitochondria. SSC decreased following a 4 min treatment with 200 µM Ca2+ and pretreatment with CsA (1 µM) attenuated the decrease in SSC (Fig. 6, 7). The magnitudes of these shifts are comparable to Ca2+-induced decreases in absorbance (Fig. 5). While these data are indicative of swelling and demonstrate the protective effects of CsA, little information on mitochondria heterogeneity can be extracted from these analyses. The observation that the mitochondria are only experiencing a 20–30% change swelling indicates that either a small amount of swelling is occurring in all mitochondria, or that only 20–30% of all mitochondria are swelling.
FIGURE 6.
Ca2+-induced mitochondrial swelling decreases SSC using flow cytometry. Shown are representative histograms of SSC at time = 0 min (red line) and time = 4 min (green line). No added Ca2+ (0 µM Ca2+), no added Ca2+ + 1 µM CsA (0 µM Ca2+ + CsA), 200 µM Ca2+ (200 µM Ca2+), 200 µM Ca2+ + CsA (200 µM Ca2+ + CsA).
FIGURE 7.
Quantification of the SSC geometric mean. Quantification of percent change of SSC geometric mean from time = 0 minutes to time = 4 min after exposure to either 0 or 200 µM Ca2+ with or without the pretreatment of CsA as shown in Fig 6.
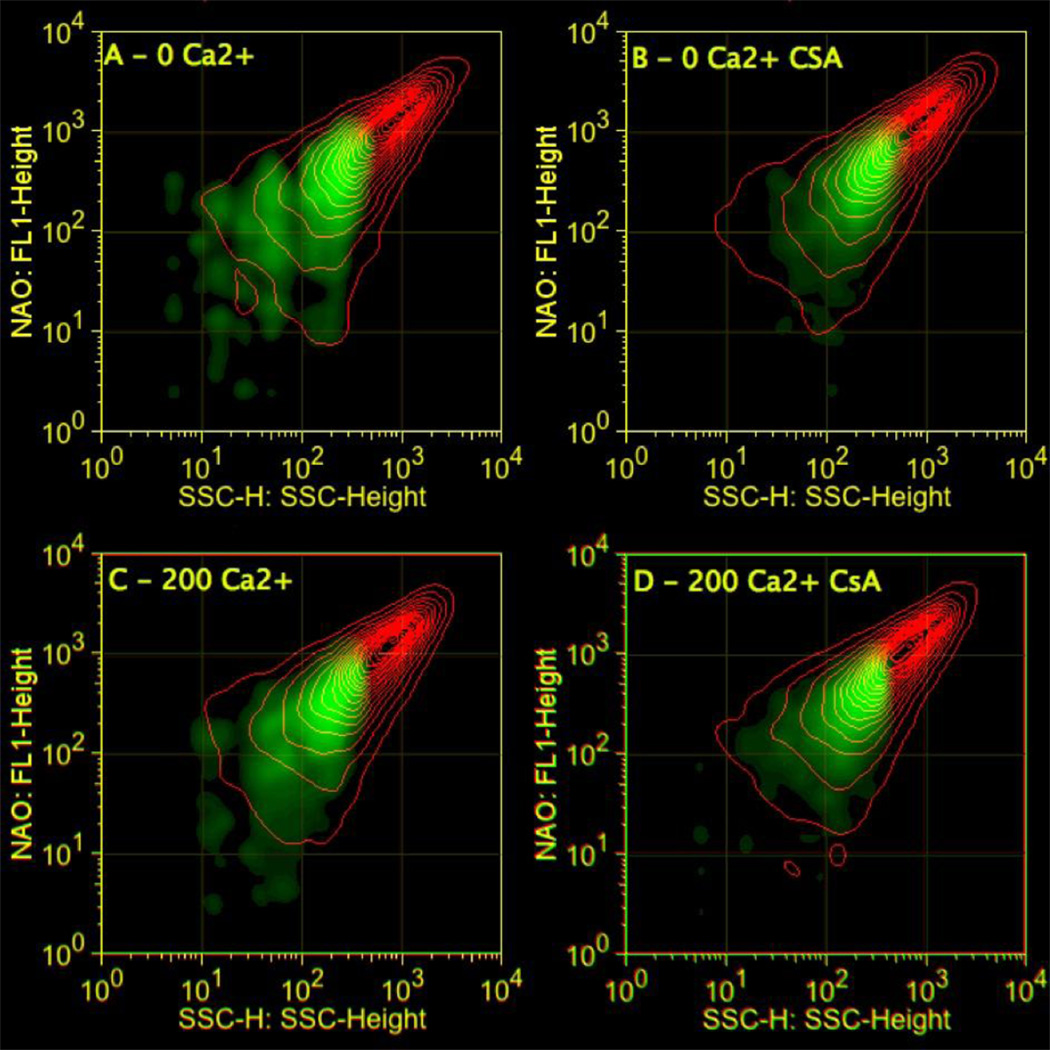
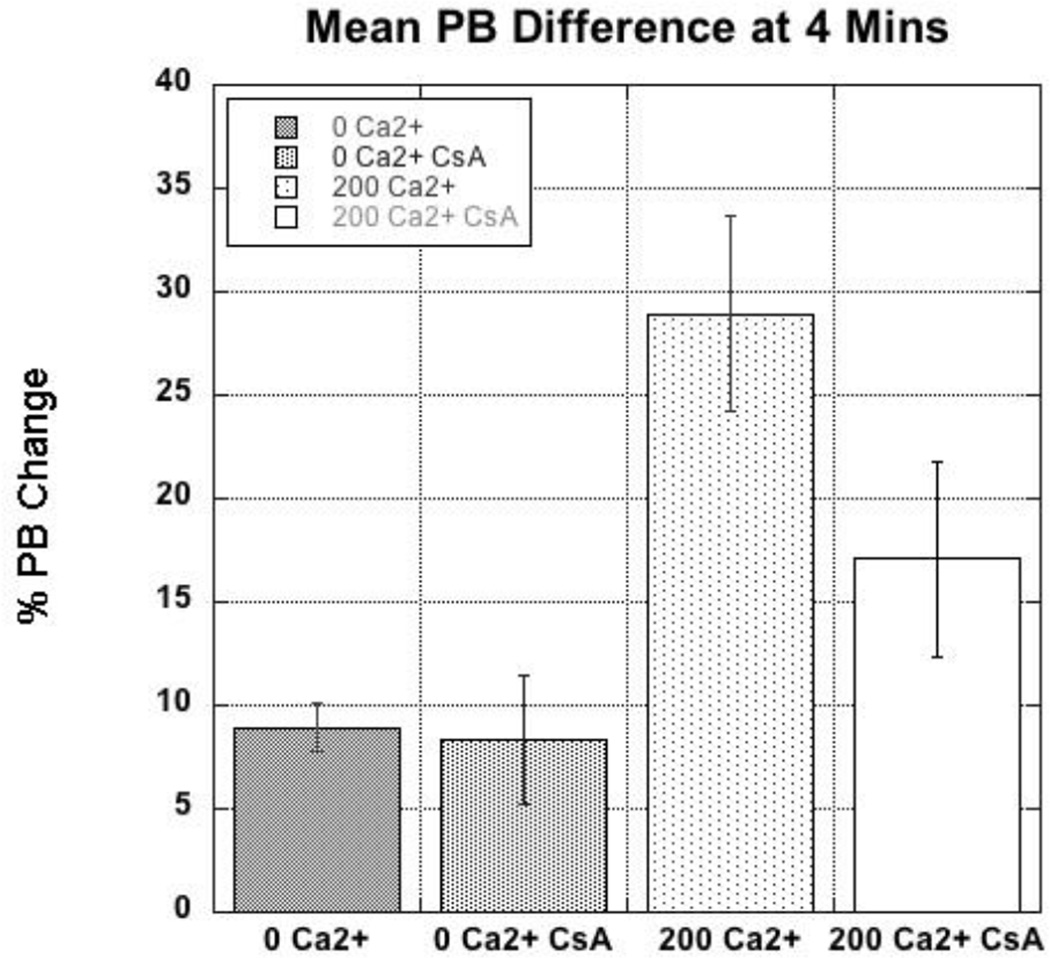
To address swelling heterogeneity, we analyzed the multivariate data of flow cytometry using probability binning [26]. As above, the data were collected and gated so that only mitochondria that stained for NAO and TMRM were used in the analyses. The SSC data at different times pre- and post-Ca2+ addition were then compared via probability binning to identify populations that had decreased in SSC (i.e. those that had swollen). In the first approach, SSC data at 4 min after addition of Ca2+ were compared to data collected prior to Ca2+ addition. Shown in Fig. 8 are the initial (time = 0 min) NAO vs. SSC data as red contour plots. These data were broken up into 1000 bins of equal numbers of data points and then the bins were applied to datasets acquired 4 min after addition of Ca2+. The green density overlay in Fig. 8 illustrates increases in populations within bins present at time = 4 min. In mitochondria with no added Ca2+, there are a number of distinct subpopulations that decreased in SSC at the 4 min (10 % of the total population). These populations exhibit dim to intermediate NAO intensities. The observation that CsA attenuates the populations with decreased SSC suggests that some populations of mitochondria are swelling in the absence of added Ca2+. However, following the addition of 200 µM Ca2+, the number of populations with lower SSC at 4 min are significantly increased (21% of the total population) and, again, addition of CsA prior to Ca2+ attenuated the population increases, indicating that the decreased SSC arises from mitochondrial permeability transition pore (MPTP)-mediated swelling. Quantifications of the population changes for replicate samples (N = 8) are shown in Fig. 9. After 4 min, approximately 20% of the mitochondria had swollen as indicated by decreases in SSC while in controls less than 10% had been affected. These data provide evidence that only a fraction (20–25%) of the mitochondria undergo swelling in response to Ca2+.
FIGURE 8.
Probability binning identifies mitochondrial subpopulations in response to Ca2+. Shown are SSC vs NAO contours (red) at time = 0 min with PB density overlay at time = 4 min (green). Mitochondria were exposed to either 0 or 200 µM Ca2+ (A,C). Mitochondria were also pre-treated with CsA 5 min prior to Ca2+addition (B,D). The green PB overlay shows an increase in mitochondria with lower SSC, lower NAO at 4 min compared to 0 min.
FIGURE 9.
Quantification of the mitochondria with decreased SSC 4 min after Ca2+ treatment. Shown are average fractional population differences determined from PB analyses of SSC at time = 4 min after exposure to Ca2+ with or without pre-incubation with CsA, as shown in Fig 8.
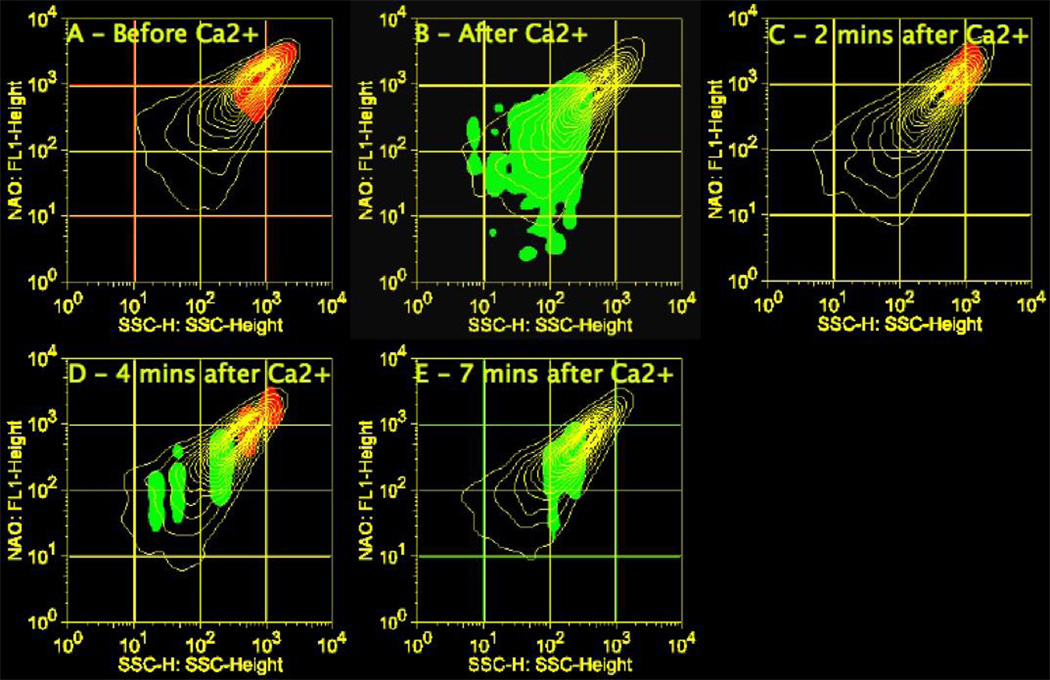
To determine if the SSC-NAO intensity changes at 4 min (Fig. 8 and 9) were due to swelling of high-SSC, high-NAO staining mitochondria in the upper right high quadrant of the contour plot, or if the changes were due to alterations in complexity or refractive index among mitochondria in the lower quadrants, a “backwards” binning approach was used. For example, the time = 4 min data were binned as the control and data collected at an earlier time point, time = 2 min was compared. This approach identifies populations that were present in one SSC-NAO region at 2 min but no longer present in the same region at 4 min. The data obtained from backwards binning were combined with the data from the forward binning to identify populations of mitochondria with a given range of SSC-NAO that traversed to another region during swelling (Fig 10). In Fig. 10, the yellow contour plots show the SSC-NAO data at sequential time points. Two general trends are observed; first, the high-SSC, high-NAO populations decrease following Ca2+ addition, particularly at 4 and 7 min. Second, there is an overall loss in intensity of NAO staining and SSC decreases. The red and green shading identify populations that differ between successive time-points. For example, the red shading indicates populations that are absent in the following time point while green shading indicates populations present that were not present in the prior time point. For example, a small population that is high-SSC, high-NAO prior to Ca2+ addition (Fig. 10A, red shading) is no longer present immediately after Ca2+ addition. Likewise, immediately following addition of Ca2+ there are increased populations of mitochondria with lower NAO and SSC intensities (Fig. 10B, green shading) that were not present prior to Ca2+ addition. A separate subset of the high-SSC, high-NAO staining mitochondria that were still present at 2 min following Ca2+ addition are absent from the same region by 4 min (Fig 10C, red shading). At 4 min there have been distinct increases in populations with lower SSC and NAO intensities (Fig 10D, green shading) and there are still two distinct populations with relatively high SSC-NAO intensities that will be lost at 7 min (Fig 10D, red shading). Finally, between 4 and 7 min there has been an increase in populations with mid-range SSC-NAO intensities (Fig 10E, green shading). Changes past 7 min were not tracked.
FIGURE 10.
An overlay of forward and backwards probability binning illustrates transgressions of mitochondrial populations in response to 200 µM Ca2+. A representative experiment of mitochondrial changes over 7 min following 200 µM Ca2+ addition. A snapshot of the data was taken every 2–3 min. The yellow contour plots shows changes in mitochondria following Ca2+ addition sequentially. The red shading indicates populations that are absent in the following time point. The green shading indicates populations that have appeared over the same time period.
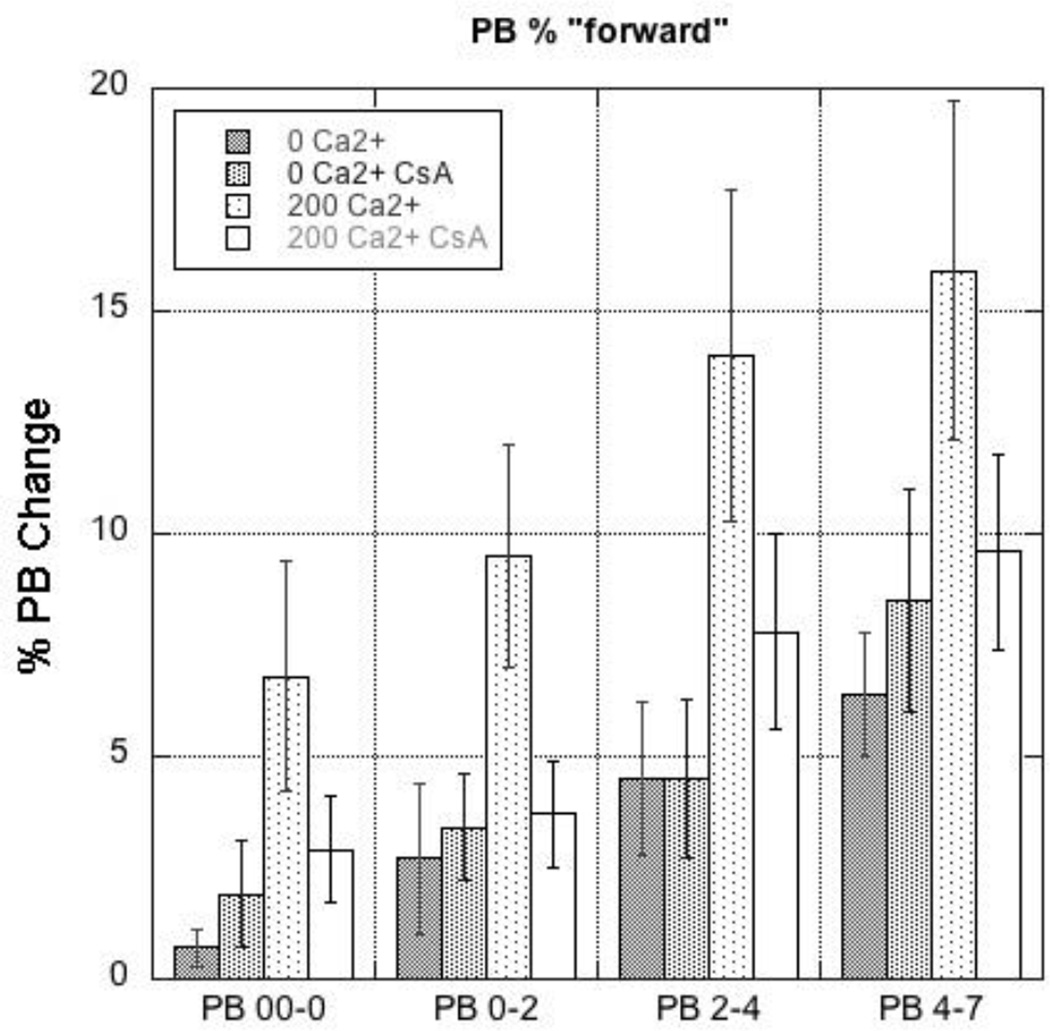
Populations that were increased following each time point shown as the green shaded regions in Fig. 10 are representative data from a single mitochondrial preparation. Replicate experiments (N = 8) were analyzed and the data are shown in Fig. 11. It was found that Ca2+ addition caused a significant increase in populations with diminished SSC-NAO intensities at all time points and that pretreatment with CsA blocked the Ca2+ mediated population increases.
FIGURE 11.
Quantification of changes in mitochondrial subpopulations over time. Shown are the PB-determined changes in mitochondrial subpopulations at each time point illustrated in Fig. 10 for all four treatment groups. Note that each time point represents changes only between each period, not a cumulative change. For example, the fraction of mitochondria in the 200 µM Ca2+ group that shifted at time = 4 min compared to time = 2 min was on average ~ 15% as determined from PB difference. The 200 µM Ca2+ CsA group showed a PB difference of ~10% for the same time frame, while the 0 mM Ca2+ groups had PB differences less than 5%.
DISCUSSION
Mitochondria heterogeneity is reflected in morphology, lipid and protein content, and function. After characterizing isolated mitochondria from renal cortex using cardiolipin content, membrane potential and volume/complexity, specific trends were observed. Specifically, about 14% of the population with the highest cardiolipin content had the highest SSC and exhibited the highest membrane potential. Mitochondria with average cardiolipin content were intermediate in SSC and exhibited a lower membrane potential compared to mitochondrial with the highest cardiolipin content. Those mitochondria with the lowest cardiolipin content had the smallest SSC and exhibited the lowest in membrane potential and exhibited the greatest diversity of sizes and membrane potentials. Thus, there are a number of mitochondrial subpopulations isolated from renal epithelial cells.
To confirm that the NAO staining was not dependent on membrane charge, mitochondria were stained with NAO and TMRM in the presence and absence of metabolic substrates. There was no difference in NAO staining, providing evidence that NAO staining is not dependent on membrane potential despite the presence of a positive charge. Furthermore, the addition of FCCP to mitochondria incubated with metabolic substrates, resulted in the loss of TMRM staining but NAO staining remained intact (data not shown).
It was also shown that a small population with high NAO staining and membrane potential was resistant to depolarization in the presence of low concentrations of FCCP. Higher concentrations of FCCP completely depolarized the mitochondria. Another study reported similar findings that a small population of mitochondria remained polarized in the presence of FCCP [23]. One possible explanation for these results is the high packing density of cardiolipin. The presence of high levels of cardiolipin within the inner mitochondrial membrane is associated with reduced basal proton leak at high potentials. As such, cardiolipin functions as an insulator to maintain inner membrane integrity at high electromotive potentials [39, 40].
A few studies [19, 29, 30] that did swelling experiments on isolated mitochondria using flow cytometry were divided on whether to use FSC or SSC as a measurement of volume. Traditionally, FSC is used as a measurement of volume in cells and the studies that used FSC as a measurement of volume in mitochondria used that argument. Groups that used SSC as a measurement of swelling, initially looked at changes in both FSC and SSC and concluded that SSC had greater changes and therefore was the better measurement of swelling. Some attributed the changes in SSC to changes in membrane structure during swelling but did not offer any further support.
Likewise studies performed to characterize bacteria morphology with flow cytometry also debated on whether FSC or SSC was the best measurement for cell size. Robertson et al used FSC as a measurement of size and the Rayleigh-Gans theory was invoked to relate bacterial biomass to light scatter intensity [41]. They calculated the size of the bacteria using Mie theory and the results were calibrated with polystyrene spheres. The correlation between polystyrene sphere FSC intensity and particle size gave a polynomial that was compared with microscopic measurements of bacteria size. The method generally led to an underestimate of bacterial cell volume mostly due to the difference in scattering between cells and the polystyrene spheres. To account for the difference in scattering between calibrator spheres and bacteria, Hammes et al and Foladori et al chose to use silica microspheres as a calibrator of size since silica microspheres have a refractive index more similar to bacterial cells than polystyrene spheres [32, 42].
We evaluated the scattering of monodisperse polypropylene beads in the range of 250 – 1000 nm diameter and found that FSC in the FACSan instrument show little changes for particles in these volume ranges. However, the SSC values decreased with increasing diameter up until about 500 nm diameter at which point the SSC changed little through ~1000 nm. These results support the idea that SSC changes better estimate volume changes, with the caveat that both FSC and SSC also have significant contributions from refractive index and/or complexity.
The above results were used to identify subpopulations that respond to a functional change, Ca2+ swelling. Initially, we used absorbance spectrophotometry to quantify loss in transmitted light due to scattering. While this is a common technique, it only measures the average changes for all mitochondria. When the spectrophotometric results were compared to swelling measured with flow cytometry using SSC and histogram analysis, the results were similar. However, the spectrophotometry technique cannot provide any information about mitochondrial subpopulations.
To identify subpopulations, populations with statistical differences in SSC intensities over time were calculated with probability binning and the changes were plotted as SSC versus NAO. SSC intensities at the 0 min time point were used as controls and population differences were calculated at the 4 min post-Ca2+ addition time points. More populations of Ca2+-treated mitochondria decreased in SSC between 0 and 4 min than the untreated samples and the decreases were blunted in the presence of CsA, which reduces the frequencies of MPT events. These data reveal that the numbers of mitochondria undergoing density changes (swelling) are limited to 10% in controls and 30% in the presence of Ca2+.
Mitochondria pre-treated with CsA prior to Ca2+ addition did not undergo as much swelling as the mitochondria treated with Ca2+ without CsA pretreatment. Interestingly, addition of CsA to the untreated mitochondria did not inhibit the swelling observed, but did inhibit Ca2+-induced swelling in the treated mitochondria group. This indicated that mitochondria left alone over time would still undergo swelling that was not Ca2+-induced. The swelling observed in the untreated mitochondria was probably due to the fact that the mitochondria had been removed from their natural cellular environment.
While these analyses identified subpopulations that increased over time, it did not provide the progression among populations. The data were binned individually between each consecutive time point “forwards” and “backwards” (Fig. 10). In response to Ca2+, the amount of mitochondria in the upper right corner that are high SSC and high NAO fluorescence decreased between consecutive time points while low SSC mitochondria with decreased NAO fluorescence in the lower left region increased over time. The combined population analyses indicate that the mitochondrial subpopulations are defined by temporal segregation of multiple populations in the high SSC, high NAO fluorescence mitochondria. The most susceptible of these populations experience changes immediately after Ca2+ addition. The large negative charge inside the high SSC, high NAO fluorescence mitochondria would theoretically attract more Ca2+ than the less polarized mitochondria. Another factor could be the amount of Ca2+ used to treat the mitochondria might not have been a high enough concentration to induce swelling changes in the low SSC, less polarized mitochondria. Greater changes were seen when a concentration of 800 µM Ca2+ was used (data not shown).
Two papers that used flow cytometry to analyze mitochondria, reported subpopulations based on Rh-123 fluorescence, which is indicative of membrane potential. Both Lopez-Mediaville et al [22] and Pepit et al [21] used Percoll gradients to purify liver mitochondria after isolation and stained the mitochondria with Rh-123 prior to flow cytometric analysis. However, the groups used different parameters for identifying subpopulations. Lopez-Mediaville used a Percoll gradient to identify three subpopulation fractions based on density and then stained each population with Rh-123, while Petit et al used a single purified mitochondria fraction and identified three subpopulations based on high, medium and low Rh-123 staining. While each group further characterized each subpopulation to look for functional differences, these analyses mostly consisted of enzymatic assays [22, 23] and respiration studies rather than further functional analysis using flow cytometry.
Similarly, Petit et al [21] identified two subpopulations based on FSC in the isolated mitochondria that were not purified via Percoll gradient. The smaller FSC population of the mitochondria isolated via centrifugation disappeared when the mitochondria were purified by Percoll gradient. They also saw that mitochondria purified by Percoll gradient appeared more uniform, which suggests that heterogeneity is decreased or lost when using a Percoll gradient.
The subpopulations described in these papers were defined mostly based on mitochondrial density and membrane potential. While enzyme activities were also looked at, there was no morphological characterization of the mitochondria. In our studies, a Percoll gradient was not used, as weaker mitochondrial subpopulations were more likely to be lost and the populations analyzed would be less heterogeneous. We also further characterized mitochondrial subpopulations using flow cytometry. Mitochondrial morphology was characterized by NAO staining, FSC and SSC while mitochondrial function was characterized by TMRM staining. Response to mitochondrial stressors, FCCP and Ca2+ was likewise studied by looking at changes in TMRM and SSC, respectively. In our studies, we were able to characterize multiple parameters of the whole population while also characterizing multiple parameters of individual mitochondrial subpopulations and their responses to mitochondrial stressors.
Our results suggest that the heterogeneity of mitochondria reflects volume, lipid content, function, and ultrastructural features. The latter has been observed via microscopy but flow cytometry enables better quantification, particularly during dynamic processes such as calcium-induced swelling (ie, the mitochondrial permeability transition). As stated previously, SSC was found to be a better indicator of volume in the Ca2+-induced swelling studies. While our study examined both morphological and functional subpopulations of mitochondrial, there are limitations. The limitation of using isolated mitochondria is that mitochondria can be altered during the isolation process, and that mitochondria are lost during the isolation process and cannot be analyzed. Nevertheless, some experiments can’t be done in vivo or in cells. Flow cytometry is a reasonable approach to analyze subpopulations of mitochondria and we have applied the use of probability binning analyses to expand the type and depth of analysis.
We have shown that both morphological and functional subpopulations exist in control renal mitochondria. Morphological subpopulations defined by correlated cardiolipin content, size, and membrane potential also exhibit distinct functional characteristics in response to stressors such as FCCP and Ca2+. We hypothesize that changes in these populations will correlate with pathological states.
ACKNOWLEDGMENTS
This study was supported by NIH Grant GM 084147, the NIM/NIEHS Training Program in Environmental Stress Signaling T32ES012878-05 and NIH/NHLBI Training to Improve Cardiovascular Therapies T32HL007260-34, and by the Biomedical Laboratory Research and Development Program of the Department of Veterans Affairs. Animal facilities were funded by NIH grant C06 RR-015455
Footnotes
DISCLAIMER
The contents of this manuscript do not represent the views of the Department of Veteran Affairs or the United States Government.
REFERENCES
- 1.Wikstrom JD, Twig G, Shirihai OS. What can mitochondrial heterogeneity tell us about mitochondrial dynamics and autophagy? Int J Biochem Cell Biol. 2009;41(10):1914–1927. doi: 10.1016/j.biocel.2009.06.006. [DOI] [PubMed] [Google Scholar]
- 2.Kuznetsov AV, Margreiter R. Heterogeneity of Mitochondria and Mitochondrial Function within Cells as Another Level of Mitochondrial Complexity. Int J Mol Sci. 2009;10(4):1911–1129. doi: 10.3390/ijms10041911. [DOI] [PMC free article] [PubMed] [Google Scholar]
- 3.Palmer JW, Tandler B, Hoppel CL. Biochemical properties of subsarcolemmal and interfibrillar mitochondria isolated from rat cardiac muscle. J Biol Chem. 1977;252(23):8731–8739. [PubMed] [Google Scholar]
- 4.Bowser DN, et al. Role of mitochondria in calcium regulation of spontaneously contracting cardiac muscle cells. Biophys J. 1998;75(4):2004–2014. doi: 10.1016/S0006-3495(98)77642-8. [DOI] [PMC free article] [PubMed] [Google Scholar]
- 5.Palmer JW, Tandler B, Hoppel CL. Biochemical differences between subsarcolemmal and interfibrillar mitochondria from rat cardiac muscle: effects of procedural manipulations. Arch Biochem Biophys. 1985;236(2):691–702. doi: 10.1016/0003-9861(85)90675-7. [DOI] [PubMed] [Google Scholar]
- 6.Palmer JW, Tandler B, Hoppel CL. Heterogeneous response of subsarcolemmal heart mitochondria to calcium. Am J Physiol. 1986;250(5 Pt 2):H741–H748. doi: 10.1152/ajpheart.1986.250.5.H741. [DOI] [PubMed] [Google Scholar]
- 7.Fannin SW, et al. Aging selectively decreases oxidative capacity in rat heart interfibrillar mitochondria. Arch Biochem Biophys. 1999;372(2):399–407. doi: 10.1006/abbi.1999.1508. [DOI] [PubMed] [Google Scholar]
- 8.Bizeau ME, Willis WT, Hazel JR. Differential responses to endurance training in subsarcolemmal and intermyofibrillar mitochondria. J Appl Physiol. 1998;85(4):1279–1284. doi: 10.1152/jappl.1998.85.4.1279. [DOI] [PubMed] [Google Scholar]
- 9.Cogswell AM, Stevens RJ, Hood DA. Properties of skeletal muscle mitochondria isolated from subsarcolemmal and intermyofibrillar regions. Am J Physiol. 1993;264(2 Pt 1):C383–C389. doi: 10.1152/ajpcell.1993.264.2.C383. [DOI] [PubMed] [Google Scholar]
- 10.Krieger DA, et al. Populations of rat skeletal muscle mitochondria after exercise and immobilization. J Appl Physiol. 1980;48(1):23–28. doi: 10.1152/jappl.1980.48.1.23. [DOI] [PubMed] [Google Scholar]
- 11.Lombardi A, et al. Characterisation of oxidative phosphorylation in skeletal muscle mitochondria subpopulations in pig: a study using top-down elasticity analysis. FEBS Lett. 2000;475(2):84–88. doi: 10.1016/s0014-5793(00)01633-1. [DOI] [PubMed] [Google Scholar]
- 12.Mollica MP, et al. Heterogeneous bioenergetic behaviour of subsarcolemmal and intermyofibrillar mitochondria in fed and fasted rats. Cell Mol Life Sci. 2006;63(3):358–366. doi: 10.1007/s00018-005-5443-2. [DOI] [PMC free article] [PubMed] [Google Scholar]
- 13.Takahashi M, Hood DA. Protein import into subsarcolemmal and intermyofibrillar skeletal muscle mitochondria. Differential import regulation in distinct subcellular regions. J Biol Chem. 1996;271(44):27285–27291. doi: 10.1074/jbc.271.44.27285. [DOI] [PubMed] [Google Scholar]
- 14.Jimenez M, et al. Expression of uncoupling protein-3 in subsarcolemmal and intermyofibrillar mitochondria of various mouse muscle types and its modulation by fasting. Eur J Biochem. 2002;269(12):2878–2884. doi: 10.1046/j.1432-1033.2002.02953.x. [DOI] [PubMed] [Google Scholar]
- 15.Kuznetsov AV, et al. Mitochondrial subpopulations and heterogeneity revealed by confocal imaging: possible physiological role? Biochim Biophys Acta. 2006;1757(5–6):686–691. doi: 10.1016/j.bbabio.2006.03.014. [DOI] [PubMed] [Google Scholar]
- 16.Chen H, Chan DC. Mitochondrial dynamics--fusion, fission, movement, and mitophagy--in neurodegenerative diseases. Hum Mol Genet. 2009;18(R2):R169–R176. doi: 10.1093/hmg/ddp326. [DOI] [PMC free article] [PubMed] [Google Scholar]
- 17.Detmer SA, Chan DC. Functions and dysfunctions of mitochondrial dynamics. Nat Rev Mol Cell Biol. 2007;8(11):870–879. doi: 10.1038/nrm2275. [DOI] [PubMed] [Google Scholar]
- 18.Twig G, Hyde B, Shirihai OS. Mitochondrial fusion, fission and autophagy as a quality control axis: the bioenergetic view. Biochim Biophys Acta. 2008;1777(9):1092–1097. doi: 10.1016/j.bbabio.2008.05.001. [DOI] [PMC free article] [PubMed] [Google Scholar]
- 19.Mattiasson G. Flow cytometric analysis of isolated liver mitochondria to detect changes relevant to cell death. Cytometry A. 2004;60(2):145–154. doi: 10.1002/cyto.a.20024. [DOI] [PubMed] [Google Scholar]
- 20.Cossarizza A, Ceccarelli D, Masini A. Functional heterogeneity of an isolated mitochondrial population revealed by cytofluorometric analysis at the single organelle level. Exp Cell Res. 1996;222(1):84–94. doi: 10.1006/excr.1996.0011. [DOI] [PubMed] [Google Scholar]
- 21.Petit PX, et al. Analysis of the membrane potential of rat- and mouse-liver mitochondria by flow cytometry and possible applications. Eur J Biochem. 1990;194(2):389–397. doi: 10.1111/j.1432-1033.1990.tb15632.x. [DOI] [PubMed] [Google Scholar]
- 22.Lopez-Mediavilla C, et al. Identification by flow cytometry of two distinct rhodamine-123-stained mitochondrial populations in rat liver. FEBS Lett. 1989;254(1–2):115–120. doi: 10.1016/0014-5793(89)81020-8. [DOI] [PubMed] [Google Scholar]
- 23.Medina JM, Lopez-Mediavilla C, Orfao A. Flow cytometry of isolated mitochondria during development and under some pathological conditions. FEBS Lett. 2002;510(3):127–132. doi: 10.1016/s0014-5793(01)03260-4. [DOI] [PubMed] [Google Scholar]
- 24.Schnellmann RG, Cross TJ, Lock EA. Pentachlorobutadienyl-L-cysteine uncouples oxidative phosphorylation by dissipating the proton gradient. Toxicol Appl Pharmacol. 1989;100(3):498–505. doi: 10.1016/0041-008x(89)90297-4. [DOI] [PubMed] [Google Scholar]
- 25.Arrington DD, Van Vleet TR, Schnellmann RG. Calpain 10: a mitochondrial calpain and its role in calcium-induced mitochondrial dysfunction. Am J Physiol Cell Physiol. 2006;291(6):C1159–C1171. doi: 10.1152/ajpcell.00207.2006. [DOI] [PubMed] [Google Scholar]
- 26.Roederer M, et al. Probability binning comparison: a metric for quantitating multivariate distribution differences. Cytometry. 2001;45(1):47–55. doi: 10.1002/1097-0320(20010901)45:1<47::aid-cyto1143>3.0.co;2-a. [DOI] [PubMed] [Google Scholar]
- 27.Jacobson J, Duchen MR, Heales SJ. Intracellular distribution of the fluorescent dye nonyl acridine orange responds to the mitochondrial membrane potential: implications for assays of cardiolipin and mitochondrial mass. J Neurochem. 2002;82(2):224–333. doi: 10.1046/j.1471-4159.2002.00945.x. [DOI] [PubMed] [Google Scholar]
- 28.Rodriguez ME, et al. Targeting of mitochondria by 10-N-alkyl acridine orange analogues: role of alkyl chain length in determining cellular uptake and localization. Mitochondrion. 2008;8(3):237–246. doi: 10.1016/j.mito.2008.04.003. [DOI] [PMC free article] [PubMed] [Google Scholar]
- 29.Umegaki T, et al. Flow cytometric analysis of ca-induced membrane permeability transition of isolated rat liver mitochondria. J Clin Biochem Nutr. 2008;42:35–44. doi: 10.3164/jcbn.2008006. [DOI] [PMC free article] [PubMed] [Google Scholar]
- 30.Lecoeur H, et al. Real-time flow cytometry analysis of permeability transition in isolated mitochondria. Exp Cell Res. 2004;294(1):106–117. doi: 10.1016/j.yexcr.2003.10.030. [DOI] [PubMed] [Google Scholar]
- 31.Poot M, Pierce RH. Detection of changes in mitochondrial function during apoptosis by simultaneous staining with multiple fluorescent dyes and correlated multiparameter flow cytometry. Cytometry. 1999;35(4):311–317. doi: 10.1002/(sici)1097-0320(19990401)35:4<311::aid-cyto3>3.3.co;2-5. [DOI] [PubMed] [Google Scholar]
- 32.Hammes F, Egli T. Cytometric methods for measuring bacteria in water: advantages, pitfalls and applications. Anal Bioanal Chem. 397(3):1083–1095. doi: 10.1007/s00216-010-3646-3. [DOI] [PubMed] [Google Scholar]
- 33.Butler WH, Judah JD. Ultrastructural studies on mitochondrial swelling. Biochem J. 1970;118(5):883–886. doi: 10.1042/bj1180883. [DOI] [PMC free article] [PubMed] [Google Scholar]
- 34.Goyer RA, Krall R. Ultrastructural transformation in mitochondria isolated from kidneys of normal and lead-intoxicated rats. J Cell Biol. 1969;41(2):393–400. doi: 10.1083/jcb.41.2.393. [DOI] [PMC free article] [PubMed] [Google Scholar]
- 35.O'Toole JF, et al. Decreased cytochrome c mediates an age-related decline of oxidative phosphorylation in rat kidney mitochondria. Biochem J. 427(1):105–112. doi: 10.1042/BJ20091373. [DOI] [PMC free article] [PubMed] [Google Scholar]
- 36.Lichtenberg D, et al. Effect of surface curvature on stability, thermodynamic behavior, and osmotic activity of dipalmitoylphosphatidylcholine single lamellar vesicles. Biochemistry. 1981;20(12):3462–3467. doi: 10.1021/bi00515a024. [DOI] [PubMed] [Google Scholar]
- 37.Halestrap AP, Davidson AM. Inhibition of Ca2(+)-induced large-amplitude swelling of liver and heart mitochondria by cyclosporin is probably caused by the inhibitor binding to mitochondrial-matrix peptidyl-prolyl cis-trans isomerase and preventing it interacting with the adenine nucleotide translocase. Biochem J. 1990;268(1):153–160. doi: 10.1042/bj2680153. [DOI] [PMC free article] [PubMed] [Google Scholar]
- 38.Kinsey GR, et al. Role of Ca2+-independent phospholipase A2gamma in Ca2+-induced mitochondrial permeability transition. J Pharmacol Exp Ther. 2007;321(2):707–715. doi: 10.1124/jpet.107.119545. [DOI] [PubMed] [Google Scholar]
- 39.Jastroch M, et al. Mitochondrial proton and electron leaks. Essays Biochem. 47:53–67. doi: 10.1042/bse0470053. [DOI] [PMC free article] [PubMed] [Google Scholar]
- 40.Porter RK, Hulbert AJ, Brand MD. Allometry of mitochondrial proton leak: influence of membrane surface area and fatty acid composition. Am J Physiol. 1996;271(6 Pt 2):R1550–R1560. doi: 10.1152/ajpregu.1996.271.6.R1550. [DOI] [PubMed] [Google Scholar]
- 41.Robertson BR, Button DK, Koch AL. Determination of the biomasses of small bacteria at low concentrations in a mixture of species with forward light scatter measurements by flow cytometry. Appl Environ Microbiol. 1998;64(10):3900–3909. doi: 10.1128/aem.64.10.3900-3909.1998. [DOI] [PMC free article] [PubMed] [Google Scholar]
- 42.Foladori P, Quaranta A, Ziglio G. Use of silica microspheres having refractive index similar to bacteria for conversion of flow cytometric forward light scatter into biovolume. Water Res. 2008;42(14):3757–3766. doi: 10.1016/j.watres.2008.06.026. [DOI] [PubMed] [Google Scholar]
- 43.Bouvier T, et al. Using light scatter signal to estimate bacterial biovolume by flow cytometry. Cytometry. 2001;44(3):188–194. doi: 10.1002/1097-0320(20010701)44:3<188::aid-cyto1111>3.0.co;2-c. [DOI] [PubMed] [Google Scholar]


