

Abstract
The mechanisms that coordinate the final mitotic divisions of terminally differentiated bone marrow erythroid cells with components of their structural and functional maturation program remain largely undefined. We previously identified phenotypes resembling those found in early-stage myelodysplastic syndromes, including ineffective erythropoiesis, morphologic dysplasia, and hyper-cellular bone marrow, in a knock-in mouse model in which cyclin E mutations were introduced at its two Cdc4 phosphodegrons (CPDs) to ablate Fbw7-dependent ubiquitination and degradation. Here we have examined the physiologic consequences of cyclin E dysregulation in bone marrow erythroid cells during terminal maturation in vivo. We found cyclin E protein levels in bone marrow erythroid cells are dynamically regulated in a CPD-dependent manner and that disruption of Fbw7-dependent cyclin E regulation impairs terminal erythroid cell maturation at a discrete stage prior to enucleation. At this stage of erythroid cell maturation, CPD phosphorylation of cyclin E regulates both cell cycle arrest and survival. We also found normal regulation of cyclin E restrains mitochondrial reactive oxygen species accumulation and expression of genes that promote mitochondrial biogenesis and oxidative metabolism during terminal erythroid maturation. In the setting of dysregulated cyclin E expression, p53 is activated in bone marrow erythroid cells as part of a DNA damage response-type pathway, which mitigates ineffective erythropoiesis, in contrast to the role of p53 induction in other models of dyserythropoiesis. Finally, cyclin E dysregulation and ROS accumulation induce histone H3 lysine 9 hyper-methylation and disrupt components of the normal terminal erythroid maturation gene expression program. Thus, ubiquitin-proteasome pathway control of G1-to-S-phase progression is intrinsically linked to regulation of metabolism and gene expression in terminally differentiating bone marrow erythroid cells.
Keywords: cyclin E, Fbw7, erythropoiesis, reactive oxygen species, p53
Introduction
Antagonism between cell proliferation and differentiation is recognized in cells of diverse lineages, though the mechanistic basis for the apparent opposition between these states remains incompletely defined. In work performed over twenty years ago using murine leukemia cells with erythroid differentiation potential, enforced expression of the c-myc oncogene, which drives both cell growth and proliferation, was found to inhibit globin gene expression, supporting the paradigm that excessive pro-proliferative signaling disrupts normal hematopoietic differentiation.1 On the other hand, differentiation of erythroid progenitor cells appears to require active cell division, as the CFU-erythroid-to-proerythroblast transition requires DNA synthesis for removal of repressive histone marks from bivalent chromatin.2 Moreover, the E2F transcription factors have essential functions in supporting both expansion and maturation of erythroid progenitors.3,4
Presumably, the activity of proliferation-promoting factors must be limited to ensure both expansion of the erythroid progenitor pool and timely exit from the mitotic cell cycle. Supporting this concept are observations made from retinoblastoma (Rb) knockout models.5,6 Cyclin E over-expression subverts Rb pathway function, promoting E2F activation and cell cycle progression past Rb-imposed G1 checkpoint controls.7 Cyclin E protein abundance is negatively regulated by ubiquitin-mediated proteolysis, and the SCFFbw7 ubiquitin ligase targets Cdk2-bound, phosphorylated cyclin E for proteasomal destruction.8 Fbw7-mediated ubiquitination and proteolysis of Cdk2-bound cyclin E is triggered by multi-site phosphorylation of cyclin E within motifs called Cdc4-phosphodegrons (CPDs): in mouse cyclin E1, one N-terminal CPD centered on threonine-74 (T74) and a C-terminal CPD including threonine-393 (T393).8,9 Fbw7 regulation of its substrates, including cyclin E, can be disrupted by mutations in Fbw7, transcriptional and translational repression, and possibly in myelodysplastic syndromes, by hyper-methylation of the FBXW7 gene.10–13
To study the consequences of disabled cyclin E ubiquitination in vivo, we generated a knock-in mouse strain in which the wild-type cyclin E1 gene (Ccne1) was targeted by a dual phosphodegron mutation (cyclin ET74A T393A). We previously found that cyclin ET74A T393A mice are anemic and their bone marrow erythroid cells exhibit hyper-proliferation, impaired maturation, and dysplastic morphologies.9 In this study, we have examined in detail the consequences of dysregulated cyclin E upon erythroid differentiation in vivo. We demonstrate that regulation of cyclin E has functions extending beyond proliferation control during terminal erythroid maturation, including restraining oxidative metabolism and reactive oxygen species (ROS) accumulation in late-stage bone marrow erythroid precursor cells. Dysregulated cyclin E during erythroid cell maturation is associated with p53 activation, histone H3 lysine 9 hyper-methylation, and altered erythroid gene expression. Thus, ubiquitin ligase pathway control of cyclin E expression integrates proliferation control with metabolic and transcriptional regulatory mechanisms during terminal cell differentiation.
Results
Cyclin E protein levels are dynamically regulated during terminal erythroid maturation in vivo
To determine the temporal relationship of Fbw7-dependent cyclin E regulation to bone marrow erythroid cell maturation in vivo, we compared wild-type and CPD-mutated cyclin E protein levels in distinct morphologic subpopulations, defined first using Ter119 and CD71 (Figure 1a). We also used a recently described strategy for monitoring bone marrow erythroid cells using expression of CD44 vs. forward scatter (FSC), permitting improved separation of terminal maturation stages and demonstrating abnormal ratio of earlier to later stage cells as we observed previously with use of CD71 and Ter1119 (Figure 1b).9,14 In wild-type mice, cyclin E protein expression increases significantly from the proerythroblast (R0/1 or I) to basophilic erythroblast stage (R2 or II/III). With further maturation towards orthochromatic erythroblasts we observe reduced cyclin E protein levels. The rise and subsequent modulation during terminal erythroid cell maturation of cyclin E protein expression are not accompanied by significant alteration in cyclin E mRNA levels (Supplemental Figure 1a and 1b). In contrast to wild-type cyclin E, we observe that high cyclin ET74A T393A protein levels are retained throughout terminal erythroid maturation (Figure 1a and 1c), without a significant increase in Ccne1 message compared to wild-type cells (Supplemental Figure 1c). Together, these data are consistent with the concept that the Fbw7 ubiquitin ligase pathway, which requires phosphorylations at threonines 74 and 393 to maintain normal periodicity of cyclin E expression,9 regulates cyclin E expression during terminal erythroid maturation.
Figure 1. Cyclin E protein regulation during terminal erythroid maturation is phosphorylation dependent.

(A) Left - bone marrow cells were sorted based upon expression of CD71 and Ter119 and subpopulations collected for immunoblot and RNA analyses as shown in subsequent panels. Right - lysates were prepared from the indicated bone marrow erythroid cells pooled from two wild-type mice and immunoblotted as shown. HDAC2 expression is used as a nuclear protein control for comparing the relative abundance of the cyclin E nucleoprotein in the different erythroid cell subpopulations, given the presence of enucleated cells within the R4 gate. (B) Bone marrow erythroid cells were isolated based on CD44 vs. Ter119 expression or CD44 expression vs. forward scatter (FSC) within the Ter119-positive subset,14 with relative abundances indicated for a representative, age- and sex-matched pair. (C) Cyclin E protein levels were determined in sorted CD44/Ter119 or CD44/FSC erythroid cell subsets shown in (B) by immunoblot (top) and quantified relative to HDAC2 (bottom).
Cyclin E dysregulation impairs cell cycle arrest and cell survival at a discrete stage during terminal erythroid maturation
To determine how impaired Fbw7-mediated cyclin E regulation alters cell cycle kinetics during terminal erythroid maturation, we utilized Hoechst 33342 co-staining with CD44/Ter119/FSC. We observed that wild-type cells within population IV (orthochromatic erythroblasts, the final stage of nucleated erythroid cells) are arrested in G1-phase, whereas significant numbers of cyclin ET74A T393A cells within this gate remained in S/G2-phase (Figure 2a). In addition to abnormal cell cycle kinetics, significant numbers of cyclin E knock-in cells within population IV were apoptotic (Figure 2b), consistent with the relative reduction in numbers of these cells and bone marrow reticulocytes (population V), which we enumerated in a separate assay employing thiazole orange and Hoechst 33342 staining (Figure 2c). Therefore, inability to appropriately down-regulate cyclin E protein expression specifically during the final stage of nucleated erythroid cell maturation results in defective cell cycle arrest and increased cell death.
Figure 2. Cell cycle arrest and survival during terminal erythroid maturation requires Fbw7-dependent cyclin E regulation.

(A, B) Cell cycle distributions (A) and apoptotic populations using Annexin V staining (B) were measured in bone marrow erythroid cells gated based on CD44/Ter119/FSC as in Figure 1B. Averaged data from six wild-type and cyclin E knock-in mice are displayed. Error bars indicate standard deviation. ** - p-value<0.05; n.s. – p-value>0.05. (C) Bone marrow reticulocytes were identified based on thiazole orange and Hoechst 33342 staining. Data are shown from two representative wild-type and cyclin ET74A T393A pairs, with significantly reduced numbers of cyclin E knock-in bone marrow reticulocytes (retic).
Disruption of Fbw7-dependent cyclin E regulation activates p53 in vivo
To understand the consequences of dysregulated cyclin E to erythroid cell gene expression in vivo, we first conducted microarray analyses of Ter119-positive (Ter119+), CD71-high bone marrow cells isolated from cyclin ET74A T393A mice and wild-type littermate controls. In unsupervised analysis of the most significant gene expression changes comparing knock-in to wild-type cells and using Gene set enrichment analysis (GSEA, Broad Institute15), we identified prominent evidence of p53 activation (Supplemental Figure 2). These findings were corroborated by immunoblot analyses performed in bone marrow Ter119+ cells (Figure 3a), demonstrating induction of p53 and p21, associated with increased serine 345-phosphorylated Chk1 and serine 15-phosphorylated p53, which together with increased γH2AX phosphorylation (Figure 3b), resemble the oncogene-induced DNA damage response.16,17 Using quantitative real-time PCR (RT-PCR), we observed induction of canonical p53 gene targets promoting cell cycle arrest and apoptosis in cyclin ET74A T393A Ter119+ CD71-high cells, as well as increased expression of target genes involved in the response to oxidative stress, including those encoding the sestrin oxidoreductase proteins (Figure 3c).18,19
Figure 3. Dysregulated cyclin E in bone marrow erythroid progenitor cells activates p53 and the DNA damage response pathway.

(A) Immunoblot analyses for cyclin E and components of the p53-dependent DNA damage response were performed using primary bone marrow cell lysates prepared after immunomagnetic separation based on Ter119 expression. HSC70 is shown as loading control; phospho-Chk1 detection was performed using same lysates as rest of immunoblot, but these were electrophoresed separately. (B) DNA damage foci were enumerated in primary Ter119+ bone marrow cells of the indicated genotypes using serine 139-phosphorylated H2AX (γH2AX) detection by flow cytometry. Shown is a representative comparison from two independent experiments. (C) Expression of the indicated p53 gene targets in Ter119+ CD71-high erythroid cells was measured by RT-PCR. Each colored bar represents averaged value of triplicate RT-PCR assays from a single knock-in mouse, expressed relative to expression in cells from age- and sex-matched wild-type controls. (D) Erythroid maturation was studied in ten wild-type recipient mice transplanted with 1×10⁶ cells of the indicated genotypes and 5×10⁵ wild-type (CD45.1) bone marrow cells. Five weeks following engraftment (equivalent for wild-type and knock-in donor cells), half the recipient mice were treated with pIpC, and sixteen weeks later, recipients were euthanized for study. Ter119 vs. CD71 immunophenotyping profiles from bone marrows are shown for two representative sets of mice along with PCR genotyping (far right) of bone marrow cells demonstrating efficient excision of floxed p53 allele following pIpC injections (* - non-specific amplicon generated by PCR). The p-values are calculated from paired t test comparing ratios of low CD71-, Ter119+ and high CD71-, Ter119+ erythroid progenitors. (E) Mean peripheral red blood cell counts and hemoglobin concentrations are shown for recipients of purified hematopoietic stem cells isolated from donor mice, three months following transplantation (n=24). Engraftment measured by peripheral blood CD45.2-positive cell enumeration was found to be comparable across all donor HSC groups (70–87%).
With expression of ribosomal protein gene mutations to model those found in Diamond-Blackfan anemia, p53 is activated and has been shown to increase apoptosis and impair maturation of erythroid cells.20,21 Thus, we hypothesized that activated p53 may mediate cyclin E-associated dyserythropoiesis. To test this, we bred a conditional, floxed p53 allele (p53fl)22 into cyclin E knock-in mice as well as the Mx1-Cre transgene, enabling p53 inactivation in bone marrow progenitor cells by polyinosinic/polycytidylic acid (pIpC) treatment, following adoptive transfer to syngeneic, irradiated, wild-type recipients to ensure study of cell-autonomous phenotypes related to expression of the cyclin E knock-in allele. Unexpectedly, we found that acute p53 deletion in vivo worsened terminal maturation of cyclin ET74A T393A bone marrow erythroid cells, as measured by proportion of Ter119+ CD71-high versus Ter119+ CD71-low cell populations (Figure 3d). In contrast, cyclin E wild-type recipients with acutely deleted p53 demonstrated no impairment of bone marrow erythroid cell maturation (Supplemental Figure 3). In a separate adoptive transfer experiment in which wild-type and cyclin E knock-in donor hematopoietic stem cells (HSCs) bearing germline deletion of Trp53 or the wild-type allele were transplanted into wild-type recipients, we found that engrafted cyclin ET74A T393A; p53-null HSC recipients had significantly fewer numbers of peripheral red blood cells and lower blood hemoglobin concentrations compared to recipients of cyclin ET74A T393A; p53-intact HSCs (Figure 3e). Our findings suggest that p53 activation promotes compensated erythropoiesis in cyclin ET74A T393A mice, rather than directly mediating the dyserythropoiesis phenotype associated with cyclin E deregulation.
Cyclin E dysregulation induces reactive oxygen species accumulation in bone marrow erythroid cells
Several p53-regulated genes with anti-oxidant functions are induced in cyclin ET74A T393A bone marrow erythroid cells (Figure 3c). Thus, we reasoned that cyclin ET74A T393A erythroid cells might contain elevated reactive oxidative species (ROS), and further, that the more severe defects in terminal erythroid maturation we found with p53-loss combined with dysregulated cyclin E could be related to exacerbated ROS levels (Figures 3d, 3e). We first measured oxygen consumption rates (OCR) directly in bone marrow Ter119+ cells isolated from cyclin ET74A T393A and wild-type mice and found increased OCR coupled to ATP production in the knock-in cells, indicative of increased oxidative metabolism (Figure 4a). Retinoblastoma (Rb)-E2F complexes repress genes that promote mitochondrial oxidative metabolism,23 including Tfam, which encodes a regulator of mitochondrial genome transcription that also maintains mitochondrial DNA (mtDNA) copy number.24 We identified increased expression of Tfam in Ter119+, CD71-high cyclin ET74A T393A bone marrow erythroid cells, in which we find Rb hyper-phosphorylated compared to wild-type cells. In these cells, we also find high expression of Nrf1, which encodes a master regulator of mitochondrial function and biogenesis previously reported as highly expressed in Rb-null erythroid cells (Figure 4b).6,25
Figure 4. Oxidative metabolism and mitochondrial ROS are increased in cyclin ET74A T393A erythroid cells.

(A) Oxidative consumption rates coupled to mitochondrial ATP production were assayed in primary Ter119+ cells from three sets of mice of the indicated genotypes using a Seahorse Extracellular Flux Analyzer. (wt= wild-type, T74A T393A= cyclin ET74A T393A cells; ** - 4×10⁵, * - 3×10⁵ cells analyzed in independent assays). Error bars indicate standard error with four replicates per sample. (B) Expression of the indicated genes in purified Ter119+ CD71-high erythroid cells was measured by RT-PCR. Each grey bar represents averaged value of triplicate assays from a single knock-in mouse, expressed relative to expression in cells from age- and sex-matched wild-type controls. Inset shows total and phospho-Rb expression from similarly isolated cells primary erythroid cells. (C) Left column - bone marrow Ter119+ cells were subdivided into distinct morphologic subpopulations (II–V) based on CD71 expression vs. forward scatter (FSC)14, with relative abundances indicated. Right columns - intracellular reactive oxygen species were measured in the indicated erythroid cell subsets using cell-permeable 2′,7′-dichlorodihydrofluorescein diacetate (H2DCFDA), enabling detection by flow cytometry. Comparisons between mean fluorescence signals for bone marrow erythroid cells of four mice from each of the indicated genotype groups were made and p-values calculated using paired t-tests. (D) Left – Representative comparison is shown of mitochondrial superoxide levels measured in bone marrow erythroid cells from three pairs of mice at the indicated stage of maturation based on CD44/FSC, using Mitosox Red superoxide indicator. Right –100x micrographs of May-Grunwald/Giemsa-stained orthochromatic erythroblasts isolated using the gating employed for the Mitosox assays. (E) Top – ethidium bromide staining of the indicated mitochondrial DNA (mtDNA) amplification products, resolved on agarose gels, is shown. The mtDNA templates were obtained from Ter119+ bone marrow cells isolated from two mice of each of the indicated genotypes. Bottom – quantification of Ter119+ cell mtDNA amplification for three pairs of mice, performed using PicoGreen reagent, expressed relative to wild-type mtDNA amplification. Derivation of the calculation of for the increase in mtDNA lesions per 10kb is previously described,26 using normalization to 117 base-pair (bp) mtDNA amplification product for mitochondrial copy number.
We next tracked cytosolic ROS levels in subsets of Ter119+ bone marrow erythroid cells, using either CD71 (Figure 4c) or CD44/FSC (Supplemental Figure 4) expression to define distinct maturation compartments.14 We found that wild-type erythroid cells exhibit steadily declining ROS levels during terminal maturation. In contrast, cyclin E knock-in bone marrow erythroid cells retain abnormally high ROS levels, prominently within the Ter119/CD44/FSC subpopulation (IV) comprised largely of reticulocytes and orthochromatic erythroblasts.14 We also observed higher ROS levels with concomitant p53-deletion (Figure 4c), consistent with the hypothesis that p53-loss potentiates the increased ROS associated with dysregulated cyclin E.
Because ROS normally decline during terminal erythroid cell maturation (Figure 4c), our findings of increased OCR and ROS levels in cyclin ET74A T393A bone marrow cells could potentially represent skewing of maturation within specific subpopulations. To exclude this possibility, we measured mitochondrial ROS levels specifically in the nucleated cell fractions within population IV and verified both increased mitochondrial superoxide in cyclin ET74A T393A cells as well comparable orthochromatic erythroblast morphologies in sorted cells from both genotypes (Figure 4d). Finally, we assayed mitochondrial DNA (mtDNA) of cyclin ET74A T393A primary erythroid cells for evidence of ROS-associated damage, using a PCR assay that detects mtDNA deletions.26 Consistent with prior observations made under conditions of increased ROS levels, we observed reproducible increases in mtDNA lesions in cyclin ET74A T393A cells compared to wild-type controls (Figure 4e). In toto, our data indicate that disabled cyclin E ubiquitination by the Fbw7 pathway in bone marrow erythroid cells results in failure to restrain oxidative metabolism and ROS production during terminal maturation.
Dysregulated cyclin E expression in vivo perturbs mitochondrial mass regulation during terminal erythroid maturation
Given the potential for increased mitochondrial biogenesis in cyclin E knock-in bone marrow erythroid cells, we measured their mitochondrial content. In the subpopulation of cyclin ET74A T393A erythroid cells for which we observed high ROS levels (IV), we observed modestly increased mitochondrial mass using a fluorescence-based assay. In more mature cyclin ET74A T393A bone marrow erythroid cells (subpopulation V), however, we observe a distinct population with markedly increased mitochondrial mass (Figure 5a). As part of their terminal maturation program, bone marrow erythroid cells normally undergo mitochondrial clearance (mitophagy);27,28 thus, our data suggest that cyclin ET74A T393A erythroid cells may also be prone to defective mitophagy. Consistent with this hypothesis, we observed higher numbers of circulating red blood cells in cyclin ET74A T393A mice with retained mitochondria, using electron microscopy to directly visualize these (Figure 5b). We then evaluated the mechanism by which dysregulated cyclin E disrupts mitophagy in erythroid cells. Notably, we discovered that late maturation stage Ter119+ cells of cyclin ET74A T393A mice have impaired induction of Bnip3L (also known as Nix), which encodes a rate-limiting regulator of autophagic clearance in terminally differentiating erythroid cells.27,28 These results paralleled our findings of impaired beta-globin induction in these cells (Figure 5c). Of note, we also observed subtle, but statistically significant, shortening in peripheral blood survival of cyclin ET74A T393A RBCs, compared to wild-type cells (13.6% relative reduction, Figure 5d). These data suggest that the ineffective bone marrow erythropoiesis phenotype we identified in cyclin ET74A T393A mice is also associated with diminished survival of circulating RBCs. Finally, despite their marked reduction in cyclin ET74A T393A bone marrows, circulating reticulocytes are mildly increased in the knock-in mice (Figure 5d), likely due to massively increased splenic erythropoiesis.9 Consistent with our bone marrow studies, we find late-stage splenic erythroid cells (population IV) of cyclin ET74A T393A mice are reduced in number and have high total and mitochondrial ROS levels, compared to wild-type splenocytes (Supplemental Figure 5).
Figure 5. Impaired Fbw7-mediated cyclin E control dysregulates mitochondrial mass during terminal erythroid cell maturation in vivo.

(A) Total mitochondrial mass was compared in Ter119+, bone marrow erythroid cells at the indicated maturation stages, based on CD71 vs. FSC. Each histogram is comprised of data obtained from two wild-type and knock-in mice. (B) Transmission electron micrograph images of peripheral blood erythrocytes (RBCs) are shown from mice of the indicated genotypes, with mitochondria retained in cyclin ET74A T393A cells indicated by bars. Peripheral RBCs with retained mitochondria were enumerated by counting approximately 1000 cells from three mice of each genotype. Mean percentage of cells with retained mitochondria and standard deviations are shown, calculated from biological replicates. (C) Bnip3L and Hbb-b1 expression in Ter119+ cells isolated at the indicated stages of erythroid maturation based on CD44/FSC gating is shown for cyclin ET74A T393A mice, compared to age- and sex-matched wild-type controls. (D) Survival of CFSE-labeled erythrocytes obtained from mice of the indicated genotypes was compared by obtaining blood samples from wild-type recipients at the indicated times, and fractions of fluorescent RBCs determined by flow cytometry. The percentage of CFSE-positive RBCs at 12 hours after injection of labeled cells was between 7%–9% of total. Data for subsequent time points are expressed as ratios to 12-hour values and represent averages from four recipients of cells from each genotype. Calculated half-lives are: 19.1 days (wild-type) and 16.5 days (cyclin ET74A T393A), p=0.008. Inset- peripheral blood reticulocytes were enumerated in five wild-type and cyclin ET74A T393A mice, p=0.02.
Dysregulated cyclin E expression and increased ROS induce histone H3 lysine 9 hyper-methylation during erythroid cell maturation and disrupts normal terminal erythroid gene expression
Bnip3L was recently identified as a GATA-1 target gene;29 thus, mitophagy is a component of the GATA-1-dependent erythroid differentiation program. In order to study further the impact of impaired cyclin E regulation by the Fbw7 ubiquitin ligase pathway upon regulation of gene expression during erythroid maturation, we utilized G1E-ER4 (G1ER) cells. This embryonic stem cell-derived Gata1-null hematopoietic progenitor line expresses the GATA-1-ER fusion protein, permitting conditional activation of terminal erythroid differentiation.30 With stable expression of cyclin E mutated at its phosphodegrons at homologous sites to those targeted by the mouse knock-in mutations (cyclin E-AA), disabling interaction with the Fbw7 ubiquitin ligase, we recapitulate in G1ERs the erythroid phenotypes observed in vivo with the cyclin ET74A T393A mouse: deficient hemoglobinization, reduced Hbb-b1 and Bnip3L expression, increased numbers of cells in S-phase, and high levels of mitochondrial ROS, DNA damage, p53 activation, and apoptosis (Figure 6 and Supplemental Figures 6a and 6b). Despite no appreciable difference in nuclear GATA-1 abundance with cyclin E over-expression, GATA-1 occupancy at both Hbb-b1 and Bnip3L was reduced in cyclin E-AA compared to vector-transduced cells (Figure 7a, upper panel). Thus, high cyclin E disrupts GATA-1-dependent gene regulation during terminal erythroid maturation.
Figure 6. G1ER cells with high cyclin E activity recapitulate dyserythropoiesis phenotypes of cyclin ET74A T393A mice.

(A) Hbb-b1 transcript levels were measured in viable (non-propidium iodide retaining) G1ER cells transduced either with empty vector (MIGR1) or cyclin E, mutated at its N- and C-terminal phosphodegrons (cyclin E-AA), following induction with beta-estradiol for 48 hours. Inset - representative cell pellets are shown, made from undifferentiated G1ER cells (−E2) and cells transduced and differentiated as above. (B) Left panel - Bnip3L transcript levels were measured in the indicated, viable G1ER cell populations and are shown relative to expression in undifferentiated (−E2), empty vector-transduced (MIGR1) cells. Right panel – Lysates were prepared from differentiated G1ER cells and immunoblotted for the indicated proteins. (C) Mitochondrial superoxide levels were measured in live, G1ER cells with (+E2) and without (−E2) differentiation using Mitosox Red superoxide indicator. Inset shows increased poly-ADP-ribose polymerase (PARP) cleavage (* = 89 kD cleavage product, f.l. = full length PARP) in cyclin E-AA-transduced, differentiated G1ER cells (E-AA) and Annexin V-positive cells enumerated from two independent transductions.
Figure 7. Increased reactive oxygen species, induced by cyclin E or exogenously administered, induce histone H3 lysine 9 hyper-methylation in differentiated erythroid cells and disrupt GATA-1 interactions with target genes.

(A) Chromatin immunoprecipitation (ChIP) analysis of GATA-1 occupancy at the Hbb-b1 promoter and Bnip3L (first intron) and a 10kb-downstream region was performed in G1ER cells transduced with the indicated constructs and induced for differentiation for 24 hours. Enrichment, relative to IgG control, is shown for one representative of three independent sets of transductions and ChIPs. Corresponding enrichment for tri-methylated H3K9 (H3K9me3) at each gene is displayed below GATA-1 occupancy data. (B) Expression of Hbb-b1 and Bnip3L was measured in differentiated G1ER cells, following treatment with hydrogen peroxide (H2O2) at the indicated doses. Exogenous peroxide was added eight hours after induction of differentiation with beta-estradiol, and cells were collected at 48 hours. Non-viable cells were excluded from collection by detecting retained propidium iodide. Inset shows cell pellets with H2O2 administration at the indicated doses (in μM). (C) Lysates were prepared from differentiated G1ER cells, following treatment with hydrogen peroxide (H2O2) for immunoblot assays. Quantitation of each histone modification was performed with normalization to total H3 signal. Shown is a representative result from three independent experiments. Mean increases in Mitosox signal relative to untreated cells were obtained using FlowJo and are expressed relative to untreated control. (D) Ter119+ bone marrow cell lysates from mice of the indicated genotypes were electrophoresed and immunoblotted as shown. Total H3 is shown as loading control. Displayed data are representative of three independent experiments. (E) G1ER cells, transduced as shown, were collected at the indicated time points during erythroid differentiation then lysed for immunoblot analyses. (en – endogenous cyclin E signal, * - retrovirally expressed cyclin E). Mitochondrial superoxide levels during differentiation were measured as for Figure 4D and mean Mitosox signal calculated for cyclin E-AA-transduced cells is expressed relative to the corresponding MIGR1-transduced cell time point. (F) Endogenous H3K9 demethylation activity was measured in lysates prepared from G1ER cells transduced or treated as indicated after differentiation in culture for the indicated times, using a quantitative fluorometric assay. Cyclin E(AA)-transduced cell lysates yielded readings above substrate-free baseline readings, though activity calculated using formula described in Methods obtains negative value. Results displayed are from a representative assay of two independent experiments.
With administration of exogenous ROS using peroxide, differentiating G1ER cells exhibit defective Bnip3L and Hbb-b1 expression and deficient hemoglobinization (Figure 7b). To understand how cyclin E-induced ROS might impair GATA-1 target gene expression without altering GATA-1 levels during terminal erythroid maturation, we next measured gross abundance of repressive chromatin marks that can indicate chromatin configurations that are less permissive for transcription factor accessibility to target genes. We identified dose-responsive increase in methylation at H3K9, but not H3K27 (Figure 7c). Thus, with direct introduction of ROS, erythroid cell maturation is impaired, and this is associated with H3K9 hyper-methylation. We also find H3K9 methylation increased in abundance by immunoblot in cyclin ET74A T393A bone marrow erythroid cells (Figure 7d). Next, with cyclin E over-expression in differentiating G1ER cells, we identified a temporal correlation between emergence of increased mitochondrial superoxide (at levels comparable to those seen with peroxide administration) and H3K9me2 and H3K9me3 induction (Figure 7e). We also performed chromatin immunoprecipitation in differentiated G1ER cells and found increased H3K9me3 occupancy at the regions of Bnip3L and Hbb-b1 in which we identified reduced GATA-1 binding (Figure 7a, lower panels).
With G1ER cell differentiation in the setting of dysregulated cyclin E, we note decreasing H3K9me3 signal over the first eight hours of differentiation (similar to control cells), while ROS are at basal levels (Figure 7e). During this time, we do not find evidence of cell proliferation (Supplemental Figure 6c), indicating that passive demethylation via synthesis of nascent chromatin does not account for the reduced abundance of hyper-methylated H3K9. At 24 hours, increased ROS resulting from dysregulated cyclin E activity could drive increased H3K9 methylation either by hindering active demethylation, or alternatively, by increasing methyltransferase activity directed at H3K9. In agreement with the former hypothesis, we discovered that endogenous H3K9 demethylation activity is greatly decreased in lysates prepared from differentiating G1ER cells expressing CPD-mutated cyclin E (or treated with peroxide), compared to controls (Figure 7f). Taken together, these data suggest that impaired ROS homeostasis driven by dysregulated cyclin E activity induces a repressive chromatin state by impairing the activity of H3K9 demethylases, which in turn interferes with normal execution of the terminal maturation gene expression program.
Discussion
In our first description of hematopoietic abnormalities associated with disabled Fbw7-mediated cyclin E regulation in vivo, we noted a dominant erythroid phenotype and hypothesized that physiologic consequences of the cyclin ET74A T393A mutation would be greatest in those cell lineages in which the Fbw7 pathway plays a critical, non-redundant role in regulating cyclin E expression.9 Importantly, findings from a recent study of post-translational regulation of cyclin E in hepatic cells by the BTB-Cul3-Rbx1 (BCR) ubiquitin ligase, which promotes phosphorylation-independent degradation of cyclin E,31 suggested the Fbw7 pathway functions chiefly in undifferentiated cells, whereas differentiated cells utilize the BCR-dependent pathway.32 Our data indicate that at least in the erythroid lineage, the Fbw7 pathway is required for control of cyclin E expression in terminally differentiated cells, specifically as they transit in maturation past the basophilic erythroblast stage.
We propose that high levels of ROS, resulting from dysregulated expression of genes controlling mitochondrial biogenesis and oxidative metabolism, are key downstream mediators of ineffective erythropoiesis associated with impaired Fbw7-mediated cyclin E control (Figure 8). For one, the erythroid dominant phenotype we have found in our studies of hematopoiesis in the cyclin ET74A T393A strain may be, at least in part, due to the induction of ROS selectively in the erythroid lineage (Supplemental Figure 7). Next, with exogenous administration of peroxide achieving comparable intracellular ROS levels as with dysregulated cyclin E, we can induce heterochromatin and reduce hemoglobinization of differentiated erythroid cells. Additionally, with deletion of p53, which controls expression of genes involved the antioxidant response,19,33 we observe both increased ROS and worsening of bone marrow erythroid cell maturation in cyclin ET74A T393A mice. Interestingly, in contrast to our prior studies performed in primary fibroblasts in culture,34,35 p53 and p21 induction by deregulated cyclin E in erythroid cells in vivo are not associated with inhibition of cyclin E-associated kinase activity (Supplemental Figure 8a), consistent with our observations of defective G1-arrest during terminal maturation of cyclin ET74A T393A erythroid cells (Figure 2a).
Figure 8. Proposed model depicting interplay between SCFFbw7-dependent cyclin E control and regulation of ROS during terminal erythroid cell maturation.
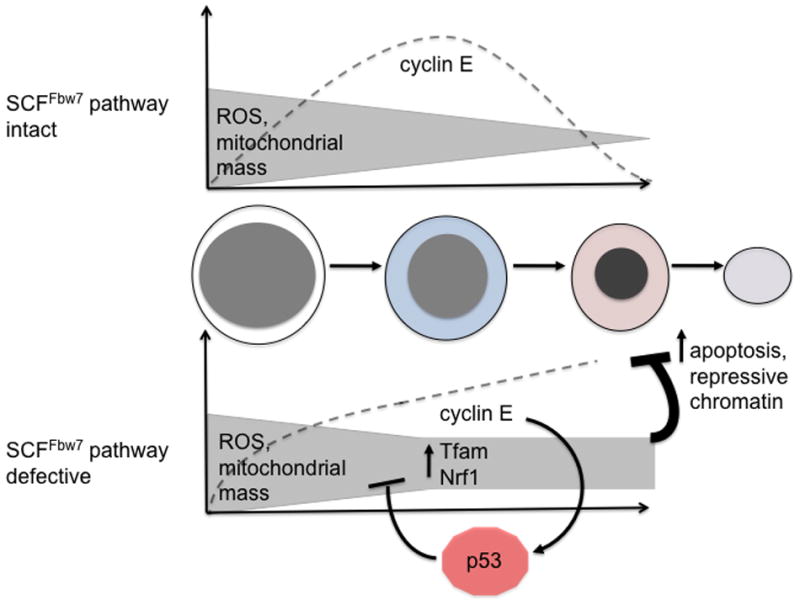
Dashed lines represent normal trend in expression (top) of cyclin E protein during terminal erythroid maturation (morphologies depicted from left to right: proerythroblast, basophilic erythroblast, orthochromatic erythroblast, and reticulocyte) and its pathological expression (bottom) in the setting of Fbw7 loss-of-function. Activation of p53 in response to dysregulated cyclin E expression is represented as well as its activity to counteract ROS through induction of several downstream target genes with anti-oxidant functions.19,33
Our data suggest that H3K9 hyper-methylation is linked to increased ROS levels, and in ongoing studies, we are attempting to elucidate the mechanistic basis for impaired H3K9 demethylase activity we find associated with dysregulated cyclin E and high ROS. Expression analyses of H3K9 demethylase genes in primary, cyclin ET74A T393A erythroid cells (population IV) reveal several are expressed at reduced levels compared to control cells (Supplemental Figure 8b), consistent with decreased overall endogenous H3K9 demethylase activity identified in differentiating G1ER cells expressing Fbw7-resistent cyclin E or treated with exogenous ROS (Figure 7f). Notably, we were able to reduce physiologic ROS during differentiation in G1ER cells by treatment with vitamin C, and this is associated with decreased H3K9me3 levels, further supporting the concept of a functional link between ROS and H3K9 methylation. However, we found that ROS in cyclin E over-expressing G1ER cells were unable to be reduced to basal levels, and in turn, H3K9 methylation levels were unresponsive (Supplemental Figure 9b). Moreover, we tried unsuccessfully to reduce ROS in cyclin ET74A T393A erythroid cells in vivo in order to enhance erythroid maturation by administering N-acetylcysteine (NAC) using a dosing strategy previously found to reduce reactive oxygen species in hematopoietic progenitor cells36 (Supplemental Figures 9c, 9d). Thus, a single pharmacologic strategy (e.g. increasing intracellular glutathione) is insufficient to counteract the multiple pathways by which unrestrained cyclin E activity generates high ROS levels during terminal erythroid maturation, including increasing oxidative metabolism and mitochondrial mass and inducing mtDNA lesions, which themselves can be ROS-productive.37
Much of the work focusing on Fbw7 in malignant hematopoiesis has centered on functions of Notch and c-Myc (both targets of the SCFFbw7) in T-cell acute lymphoblastic leukemias associated with loss-of-function mutations in Fbw7.38,39 High cyclin E activity could drive dyserythropoiesis phenotypes in clinical entities such as myelodysplastic syndromes (MDS), as expression of FBXW7 could be modulated in the myeloid/erythroid lineage by a variety of mechanisms, including microRNA-mediated repression of transcription/translation,40 transcriptional repression,10 and gene hyper-methylation.11 The potential implications of our findings extend beyond cyclin E-centered pathogenic mechanisms, though, as increased ROS driven by expression of multiple oncogenes41 could directly contribute to ineffective erythropoiesis in MDS. Further detailed study of primary patient samples will be required to understand the precise contribution of defects in oxidative metabolism control and ROS homeostasis to the molecular pathogenesis of MDS and related diseases.
Materials and Methods
Mice
Generation of the cyclin ET74A T393A knock-in strain was previously described.9 C57BL/6 CD45.1 congenic mice and Trp53-mutant mice were obtained from Jackson Laboratory. Mx1-Cre transgenic mice were provided by Dr. John Crispino (Northwestern University).42 The Northwestern University IACUC approved all mouse studies. All mice were genotyped using PCR using published protocols.
Bone marrow transplantation
CD45.1 recipients were placed on Bactrim-containing water for one week before irradiation with a total of 1100 rads divided over two equal fractions (separated by four hours) the day before transplantation. For transplant of p53-floxed bone marrow cells, 1 × 10⁶ total nucleated BM cells (CD45.2+) from Mx1-Cre; p53fl/fl; cyclin Ewt or Mx1-Cre; p53fl/fl; cyclin ET74AT393A mice, along with 0.5 × 10⁶ CD45.1+ whole bone marrow support cells, were injected retro-orbitally. Five weeks after transplantation, peripheral blood was obtained and stained with CD45.1 and CD45.2 antibodies to verify donor cell engraftment. A subset of the recipients was injected with polyinosinic/polycytidylic acid (pIpC, Amersham, 10 mg/g body weight) every other day for five doses, whereas the remainder served as untreated controls. Mice were sacrificed 16 weeks after pIpC administration for phenotypic analysis. For transplants of purified HSCs, recipient mice (CD45.1) irradiated as previously described were administered via retro-orbital sinus injection 50 HSCs (CD45.2 donors) of the following immunophenotype: lineage-negative (depletion utilized EasySep hematopoietic progenitor kit, Stemcell Technologies), Sca-1- and c-kit-positive, CD34- and CD48-negative, and CD150-positive. 3×10⁵ lin+, Sca-1-negative bone marrow cells (CD45.2) were used as support cells.43 Recipient engraftment was monitored monthly along with CBCs.
Plasmids and antibodies
Human cyclin E cDNA, containing phosphodegron mutations (cyclin E-AA) homologous to the mouse cyclin ET74A T393A mutation, was previously generated by site-directed mutagenesis and subcloned into the MIGR1 vector for expression in G1E-ER4 cells.30 Antibodies used are detailed in Supplemental Methods as are immunoblot and chromatin immunoprecipitation methodologies.
Cell culture
G1E-ER4 (G1ER) cells were cultured in IMDM (Invitrogen) with 15% fetal bovine serum (FBS), 2% penicillin/streptomycin solution (Gibco), 1:100,000 monothioglycerol (Sigma), erythropoietin (10,000 U/ml, Amgen), and CHO-KL conditional media (1:200). For differentiation, beta-estradiol (Sigma) was added to a final concentration of 10−7 M in culture media for 24–48 hours. For retroviral transduction, cells were spinoculated with retroviral supernatants, prepared by transfecting Phoenix cells (G. Nolan, Stanford) using calcium phosphate precipitation method, and 4 μg/ml polybrene for 90 minutes at room temperature. Vitamin C (Sigma) was added to G1ER cells to counteract ROS at a dose of 200 μM at eight hours following beta-estradiol induction of differentiation.
Gene expression analyses
For quantitative real-time PCR (RT-PCR), RNA was isolated using RNeasy Mini Kit (Qiagen) and reverse transcribed using the AffinityScript qPCR cDNA synthesis kit (Agilent Technologies). For microarray analysis, RNA was extracted from sorted bone marrow erythroid cells using Trizol followed by DNase treatment and cleanup with RNeasy MinElute Cleanup Kit (Qiagen). Microarray analysis was performed using Mouse WG-6 v2 Expression BeadChips (Illumina). Microarray hybridization was performed for cDNA from three littermate pairs of wild-type and cyclin ET74A T393A mice. Data were analyzed subsequently using GeneSpring (Agilent) and Gene Set Enrichment Analysis software (GSEA, Broad Institute15). Raw data are accessible at NCBI Gene Expression Omnibus (ID GSE45135). Quantitative real-time PCRs were performed using SYBR Green Mix (Roche) on a LightCycler 480 machine. Expression levels of target mRNA transcripts were normalized to either Gapdh or Actn1. Primer sequences are available upon request.
Hematopoietic analyses
Bone marrow cells were harvested from bilateral femurs and tibiae and resuspended in PBS/2% FBS. For erythroid immunophenotyping, red blood cell (RBC) lysis was not performed. For RNA isolation from primary erythroid precursors, bone marrow cells were antibody-stained then collected using a MoFlo cell sorter (Dako). For separation of Ter119+ cells from whole bone marrow, cells were incubated with PE-Ter119 antibody then immunomagnetic beads (PE Selection Kit, Stem Cell Technology). For cell cycle studies, cells were either fixed in 70% ethanol, washed, and incubated in RNAse A + 10 μg/ml DAPI (Sigma) or labeled with Hoechst 33342 (Sigma) for live cell analysis. Cell cycle analyses were performed using FlowJo software (Tree Star) and Dean-Jett-Fox modeling. Complete blood count (CBC) analyses from peripheral blood were performed on Hemavet HV950FS (Drew Scientific).
Erythrocyte lifespan determination
In vivo clearance of peripheral RBCs was determined as described previously44 with minor modifications. Red blood cells from wild-type or cyclin ET74A T393A mice were labeled with 10 μM CFSE (Invitrogen) for 30 minutes at 37 degrees, washed with sterile PBS, and resuspended at a density of 1×10⁹ cells in 0.1ml. Mice were injected with CFSE-labeled RBCs, and blood samples were collected from tail veins periodically and analyzed by flow cytometry. Slopes of rate of turnover were calculated to enable half-life determination, and statistical significance of difference calculated using Prism (GraphPad).
Metabolic analyses
To measure oxygen consumption rates, we utilized a Seahorse XF24-3 Extracellular Flux Analyzer (Seahorse Bioscience). Bone marrow cells enriched for Ter119 (by depleting whole bone marrow for all lineage markers save for Ter119) were seeded in 24-well plate pre-coated with Cell-TaK (BD Biosciences) in unbuffered DMEM with 0.1% of FBS. Before taking readings cells were incubated for one hour without CO2, then baseline OCR was measured. Readings were then obtained following injection of oligomycin (5 μM), FCCP (10 μM), and rotenone (2 μM), together with actinomycin A (2 μM). Coupled OCR represents ATP-linked OXPHOS, indicated by the difference in readings before and after injection of oligomycin. For ROS detection in bone marrow cells, cells were stained with PE-CD71 and APC-Ter119, then incubated with 10 μM CM-H2DCFDA (Molecular Probes) in dye-free Hank’s Balanced Salt Solution (HBSS, Gibco) for 30 minutes at 37°C and analyzed immediately.
Mitochondrial assays
For mitochondrial mass analyses, live cells were stained either with PE-CD71 and APC-Ter119 and then incubated with 100nM MitoTracker reagent for 20 minutes at 37°C. To detect mitochondrial superoxide, bone marrow cells were stained with FITC-CD71 and APC-Ter119 and then incubated with 5 μM Mitosox (Molecular Probes) for 15 minutes at 37°C in HBSS and analyzed immediately. For quantification of mitochondrial DNA (mtDNA) instability, total cellular DNA was purified using Gentra Puregene kit (Qiagen) from Ter119-selected bone marrow cells. PCR was performed and lesion burden quantified using PicoGreen dsDNA detection reagent as previously described.26 For transmission electron microscopy (TEM), RBCs were fixed in 0.1M sodium cacodylate buffer with 2% paraformaldehyde and 2.5% glutaraldehyde, embedded and sectioned at Northwestern University Cell Imaging Facility. Images were obtained using a FEI Tecnai Spirit G2 microscope.
H3K9 demethylation assays
A fluorometric assay was used (Cayman Chemical) for detection of endogenous Jumonji C domain demethylases activity in 1×10⁸ G1ER cells, lysed in 0.1 ml PBS supplemented with protease inhibitors, using two 20-second sonication pulses. H3K9me3-contaning peptide was used as a substrate, and purified JMJD2D was used for positive control. Demethylase activity (nmol/min/ml) was calculated as follows: .
Supplementary Material
Acknowledgments
We thank Dr. Navdeep Chandel and Laura Sena (Northwestern University) for providing reagents as well as invaluable advice. We also thank Dr. Amit Verma (Albert Einstein College of Medicine) for helpful discussions. This work was supported by NIH grant R01HL098608 and funding from the Leukemia Research Foundation, the Sidney Kimmel Foundation for Cancer Research, the American Cancer Society, and the American Society of Hematology.
Footnotes
Conflict of Interests
The authors report no conflict of interests.
References
- 1.Dmitrovsky E, Kuehl WM, Hollis GF, Kirsch IR, Bender TP, Segal S. Expression of a transfected human c-myc oncogene inhibits differentiation of a mouse erythroleukaemia cell line. Nature. 1986;322:748–750. doi: 10.1038/322748a0. [DOI] [PubMed] [Google Scholar]
- 2.Pop R, Shearstone JR, Shen Q, Liu Y, Hallstrom K, Koulnis M, et al. A key commitment step in erythropoiesis is synchronized with the cell cycle clock through mutual inhibition between PU.1 and S-phase progression. PLoS Biol. 2010:8. doi: 10.1371/journal.pbio.1000484. [DOI] [PMC free article] [PubMed] [Google Scholar]
- 3.Kinross KM, Clark AJ, Iazzolino RM, Humbert PO. E2f4 regulates fetal erythropoiesis through the promotion of cellular proliferation. Blood. 2006;108:886–895. doi: 10.1182/blood-2005-09-008656. [DOI] [PubMed] [Google Scholar]
- 4.Li FX, Zhu JW, Hogan CJ, DeGregori J. Defective gene expression, S phase progression, and maturation during hematopoiesis in E2F1/E2F2 mutant mice. Mol Cell Biol. 2003;23:3607–3622. doi: 10.1128/MCB.23.10.3607-3622.2003. [DOI] [PMC free article] [PubMed] [Google Scholar]
- 5.Dirlam A, Spike BT, Macleod KF. Deregulated E2f-2 underlies cell cycle and maturation defects in retinoblastoma null erythroblasts. Mol Cell Biol. 2007;27:8713–8728. doi: 10.1128/MCB.01118-07. [DOI] [PMC free article] [PubMed] [Google Scholar]
- 6.Sankaran VG, Orkin SH, Walkley CR. Rb intrinsically promotes erythropoiesis by coupling cell cycle exit with mitochondrial biogenesis. Genes Dev. 2008;22:463–475. doi: 10.1101/gad.1627208. [DOI] [PMC free article] [PubMed] [Google Scholar]
- 7.Santoni-Rugiu E, Falck J, Mailand N, Bartek J, Lukas J. Involvement of Myc activity in a G(1)/S-promoting mechanism parallel to the pRb/E2F pathway. Mol Cell Biol. 2000;20:3497–3509. doi: 10.1128/mcb.20.10.3497-3509.2000. [DOI] [PMC free article] [PubMed] [Google Scholar]
- 8.Welcker M, Clurman BE. FBW7 ubiquitin ligase: a tumour suppressor at the crossroads of cell division, growth and differentiation. Nat Rev Cancer. 2008;8:83–93. doi: 10.1038/nrc2290. [DOI] [PubMed] [Google Scholar]
- 9.Minella AC, Loeb KR, Knecht A, Welcker M, Varnum-Finney BJ, Bernstein ID, et al. Cyclin E phosphorylation regulates cell proliferation in hematopoietic and epithelial lineages in vivo. Genes Dev. 2008;22:1677–1689. doi: 10.1101/gad.1650208. [DOI] [PMC free article] [PubMed] [Google Scholar]
- 10.Balamurugan K, Wang JM, Tsai HH, Sharan S, Anver M, Leighty R, et al. The tumour suppressor C/EBPdelta inhibits FBXW7 expression and promotes mammary tumour metastasis. EMBO J. 2010;29:4106–4117. doi: 10.1038/emboj.2010.280. [DOI] [PMC free article] [PubMed] [Google Scholar]
- 11.Figueroa ME, Skrabanek L, Li Y, Jiemjit A, Fandy TE, Paietta E, et al. MDS and secondary AML display unique patterns and abundance of aberrant DNA methylation. Blood. 2009;114:3448–3458. doi: 10.1182/blood-2009-01-200519. [DOI] [PMC free article] [PubMed] [Google Scholar]
- 12.Koepp DM, Schaefer LK, Ye X, Keyomarsi K, Chu C, Harper JW, et al. Phosphorylation-dependent ubiquitination of cyclin E by the SCFFbw7 ubiquitin ligase. Science. 2001;294:173–177. doi: 10.1126/science.1065203. [DOI] [PubMed] [Google Scholar]
- 13.Mavrakis KJ, Van Der Meulen J, Wolfe AL, Liu X, Mets E, Taghon T, et al. A cooperative microRNA-tumor suppressor gene network in acute T-cell lymphoblastic leukemia (T-ALL) Nat Genet. 2011;43:673–678. doi: 10.1038/ng.858. [DOI] [PMC free article] [PubMed] [Google Scholar]
- 14.Chen K, Liu J, Heck S, Chasis JA, An X, Mohandas N. Resolving the distinct stages in erythroid differentiation based on dynamic changes in membrane protein expression during erythropoiesis. Proc Natl Acad Sci U S A. 2009;106:17413–17418. doi: 10.1073/pnas.0909296106. [DOI] [PMC free article] [PubMed] [Google Scholar]
- 15.Subramanian A, Tamayo P, Mootha VK, Mukherjee S, Ebert BL, Gillette MA, et al. Gene set enrichment analysis: a knowledge-based approach for interpreting genome-wide expression profiles. Proc Natl Acad Sci U S A. 2005;102:15545–15550. doi: 10.1073/pnas.0506580102. [DOI] [PMC free article] [PubMed] [Google Scholar]
- 16.Bartkova J, Horejsi Z, Koed K, Kramer A, Tort F, Zieger K, et al. DNA damage response as a candidate anti-cancer barrier in early human tumorigenesis. Nature. 2005;434:864–870. doi: 10.1038/nature03482. [DOI] [PubMed] [Google Scholar]
- 17.Gorgoulis VG, Vassiliou LV, Karakaidos P, Zacharatos P, Kotsinas A, Liloglou T, et al. Activation of the DNA damage checkpoint and genomic instability in human precancerous lesions. Nature. 2005;434:907–913. doi: 10.1038/nature03485. [DOI] [PubMed] [Google Scholar]
- 18.Riley T, Sontag E, Chen P, Levine A. Transcriptional control of human p53-regulated genes. Nat Rev Mol Cell Biol. 2008;9:402–412. doi: 10.1038/nrm2395. [DOI] [PubMed] [Google Scholar]
- 19.Sablina AA, Budanov AV, Ilyinskaya GV, Agapova LS, Kravchenko JE, Chumakov PM. The antioxidant function of the p53 tumor suppressor. Nat Med. 2005;11:1306–1313. doi: 10.1038/nm1320. [DOI] [PMC free article] [PubMed] [Google Scholar]
- 20.Dutt S, Narla A, Lin K, Mullally A, Abayasekara N, Megerdichian C, et al. Haploinsufficiency for ribosomal protein genes causes selective activation of p53 in human erythroid progenitor cells. Blood. 2011;117:2567–2576. doi: 10.1182/blood-2010-07-295238. [DOI] [PMC free article] [PubMed] [Google Scholar]
- 21.Jaako P, Flygare J, Olsson K, Quere R, Ehinger M, Henson A, et al. Mice with ribosomal protein S19 deficiency develop bone marrow failure and symptoms like patients with Diamond-Blackfan anemia. Blood. 2011;118:6087–6096. doi: 10.1182/blood-2011-08-371963. [DOI] [PubMed] [Google Scholar]
- 22.Jonkers J, Meuwissen R, van der Gulden H, Peterse H, van der Valk M, Berns A. Synergistic tumor suppressor activity of BRCA2 and p53 in a conditional mouse model for breast cancer. Nat Genet. 2001;29:418–425. doi: 10.1038/ng747. [DOI] [PubMed] [Google Scholar]
- 23.Blanchet E, Annicotte JS, Lagarrigue S, Aguilar V, Clape C, Chavey C, et al. E2F transcription factor-1 regulates oxidative metabolism. Nat Cell Biol. 2011;13:1146–1152. doi: 10.1038/ncb2309. [DOI] [PMC free article] [PubMed] [Google Scholar]
- 24.Larsson NG, Wang J, Wilhelmsson H, Oldfors A, Rustin P, Lewandoski M, et al. Mitochondrial transcription factor A is necessary for mtDNA maintenance and embryogenesis in mice. Nat Genet. 1998;18:231–236. doi: 10.1038/ng0398-231. [DOI] [PubMed] [Google Scholar]
- 25.Kelly DP, Scarpulla RC. Transcriptional regulatory circuits controlling mitochondrial biogenesis and function. Genes Dev. 2004;18:357–368. doi: 10.1101/gad.1177604. [DOI] [PubMed] [Google Scholar]
- 26.Santos JH, Mandavilli BS, Van Houten B. Measuring oxidative mtDNA damage and repair using quantitative PCR. Methods Mol Biol. 2002;197:159–176. doi: 10.1385/1-59259-284-8:159. [DOI] [PubMed] [Google Scholar]
- 27.Sandoval H, Thiagarajan P, Dasgupta SK, Schumacher A, Prchal JT, Chen M, et al. Essential role for Nix in autophagic maturation of erythroid cells. Nature. 2008;454:232–235. doi: 10.1038/nature07006. [DOI] [PMC free article] [PubMed] [Google Scholar]
- 28.Schweers RL, Zhang J, Randall MS, Loyd MR, Li W, Dorsey FC, et al. NIX is required for programmed mitochondrial clearance during reticulocyte maturation. Proc Natl Acad Sci U S A. 2007;104:19500–19505. doi: 10.1073/pnas.0708818104. [DOI] [PMC free article] [PubMed] [Google Scholar]
- 29.Kang YA, Sanalkumar R, O’Geen H, Linnemann AK, Chang CJ, Bouhassira EE, et al. Autophagy driven by a master regulator of hematopoiesis. Mol Cell Biol. 2012;32:226–239. doi: 10.1128/MCB.06166-11. [DOI] [PMC free article] [PubMed] [Google Scholar]
- 30.Weiss MJ, Yu C, Orkin SH. Erythroid-cell-specific properties of transcription factor GATA-1 revealed by phenotypic rescue of a gene-targeted cell line. Mol Cell Biol. 1997;17:1642–1651. doi: 10.1128/mcb.17.3.1642. [DOI] [PMC free article] [PubMed] [Google Scholar]
- 31.Singer JD, Gurian-West M, Clurman B, Roberts JM. Cullin-3 targets cyclin E for ubiquitination and controls S phase in mammalian cells. Genes and Development. 1999;13:2375–2387. doi: 10.1101/gad.13.18.2375. [DOI] [PMC free article] [PubMed] [Google Scholar]
- 32.Kossatz U, Breuhahn K, Wolf B, Hardtke-Wolenski M, Wilkens L, Steinemann D, et al. The cyclin E regulator cullin 3 prevents mouse hepatic progenitor cells from becoming tumor-initiating cells. J Clin Invest. 2010;120:3820–3833. doi: 10.1172/JCI41959. [DOI] [PMC free article] [PubMed] [Google Scholar]
- 33.Li T, Kon N, Jiang L, Tan M, Ludwig T, Zhao Y, et al. Tumor Suppression in the Absence of p53-Mediated Cell-Cycle Arrest, Apoptosis, and Senescence. Cell. 2012;149:1269–1283. doi: 10.1016/j.cell.2012.04.026. [DOI] [PMC free article] [PubMed] [Google Scholar]
- 34.Minella AC, Grim JE, Welcker M, Clurman BE. p53 and SCFFbw7 cooperatively restrain cyclin E-associated genome instability. Oncogene. 2007;26:6948–6953. doi: 10.1038/sj.onc.1210518. [DOI] [PubMed] [Google Scholar]
- 35.Minella AC, Swanger J, Bryant E, Welcker M, Hwang H, Clurman BE. p53 and p21 form an inducible barrier that protects cells against cyclin E-cdk2 deregulation. Curr Biol. 2002;12:1817–1827. doi: 10.1016/s0960-9822(02)01225-3. [DOI] [PubMed] [Google Scholar]
- 36.Tothova Z, Kollipara R, Huntly BJ, Lee BH, Castrillon DH, Cullen DE, et al. FoxOs are critical mediators of hematopoietic stem cell resistance to physiologic oxidative stress. Cell. 2007;128:325–339. doi: 10.1016/j.cell.2007.01.003. [DOI] [PubMed] [Google Scholar]
- 37.Balaban RS, Nemoto S, Finkel T. Mitochondria, oxidants, and aging. Cell. 2005;120:483–495. doi: 10.1016/j.cell.2005.02.001. [DOI] [PubMed] [Google Scholar]
- 38.Onoyama I, Tsunematsu R, Matsumoto A, Kimura T, de Alboran IM, Nakayama K, et al. Conditional inactivation of Fbxw7 impairs cell-cycle exit during T cell differentiation and results in lymphomatogenesis. J Exp Med. 2007;204:2875–2888. doi: 10.1084/jem.20062299. [DOI] [PMC free article] [PubMed] [Google Scholar]
- 39.Thompson BJ, Buonamici S, Sulis ML, Palomero T, Vilimas T, Basso G, et al. The SCFFBW7 ubiquitin ligase complex as a tumor suppressor in T cell leukemia. J Exp Med. 2007;204:1825–1835. doi: 10.1084/jem.20070872. [DOI] [PMC free article] [PubMed] [Google Scholar]
- 40.Xu Y, Sengupta T, Kukreja L, Minella AC. MicroRNA-223 regulates cyclin E activity by modulating expression of F-box and WD-40 domain protein 7. Journal of Biological Chemistry. 2010;285:34439–34446. doi: 10.1074/jbc.M110.152306. [DOI] [PMC free article] [PubMed] [Google Scholar]
- 41.Woo RA, Poon RY. Activated oncogenes promote and cooperate with chromosomal instability for neoplastic transformation. Genes Dev. 2004;18:1317–1330. doi: 10.1101/gad.1165204. [DOI] [PMC free article] [PubMed] [Google Scholar]
- 42.Leung CG, Xu Y, Mularski B, Liu H, Gurbuxani S, Crispino JD. Requirements for survivin in terminal differentiation of erythroid cells and maintenance of hematopoietic stem and progenitor cells. J Exp Med. 2007;204:1603–1611. doi: 10.1084/jem.20062395. [DOI] [PMC free article] [PubMed] [Google Scholar]
- 43.Wilson A, Laurenti E, Oser G, van der Wath RC, Blanco-Bose W, Jaworski M, et al. Hematopoietic stem cells reversibly switch from dormancy to self-renewal during homeostasis and repair. Cell. 2008;135:1118–1129. doi: 10.1016/j.cell.2008.10.048. [DOI] [PubMed] [Google Scholar]
- 44.Ishikawa-Sekigami T, Kaneko Y, Okazawa H, Tomizawa T, Okajo J, Saito Y, et al. SHPS-1 promotes the survival of circulating erythrocytes through inhibition of phagocytosis by splenic macrophages. Blood. 2006;107:341–348. doi: 10.1182/blood-2005-05-1896. [DOI] [PubMed] [Google Scholar]
Associated Data
This section collects any data citations, data availability statements, or supplementary materials included in this article.