

Abstract
Different ultrasound parameters have been used to assess endometrial receptivity during ART treatment, including endometrial thickness, endometrial pattern, endometrial volume, Doppler of uterine arteries and endometrial blood flow. However, conflicting results have been reported with regard to their role in the prediction of pregnancy in ART treatment. The 3D ultrasound with power Doppler provides a unique tool with which to examine the blood supply of the whole endometrium and subendometrial region. Volume assessment can also be precisely performed by 3D ultrasound. Based on a med-line research and on our experience, the clinical use of 3D ultrasound is discussed in this review article.
Keywords: 3D, ultrasound, power Doppler, IVF, ART
Özet
ART tedavisi sırasında endometriyumun kabul ediciliğini değerlendirmek için farklı ultrason parametreleri kullanılmaktadır. Bunlar içinde endometriyal kalınlık, endometriyal patern, endometriyal hacim, uterus arterlerinin ve endometriyal kan akımının Doppler’i yer almaktadır. Bununla beraber, ART tedavisinde gebeliğin öngörülmesindeki rolleri ile ilgili olarak birbiriyle çelişen sonuçlar bildirilmiştir. Bütün endometriyumun ve subendometriyal bölgenin kan akımının incelenmesinin mümkün olduğu power Doppler’li 3D ultrason yegane bir araç sağlamaktadır. 3D ultrason ile hacim değerlendirmeleri de kesin olarak yapılabilmektedir. Med-line araştırması ve kendi deneyimimize dayanarak, bu derleme makalede 3D ultrasonun klinik kullanımı tartışılmaktadır.
Introduction
Three-dimensional ultrasound (3D-US) is a rapidly developing area of clinical imaging. The ongoing research and continuous improvements in 3D-US have a significant impact on many areas of clinical application (1–6).
Successful implantation depends on the interaction between the blastocyst and the endometrium. Thickness of endometrium and a good blood supply are considered to favour pregnancy (7–9). Increased endometrial and subendometrial vascularity have been found to be higher in patients with live births following Assisted Reproductive Technology (ART) than in those who have suffered a miscarriage (10). However, conflicting results are reported with regard to their role in the prediction of pregnancy in ART treatment (11–13).
We developed this review through the use of Medline, a digital database, articles on three-dimensional ultrasonography and pregnancy outcomes in patients undergoing ART. In addition, we used the data we collected over the past 12 years and our clinical experiences.
Volume calculation
Volume calculation by 3D-US will be performed by Virtual Organ Computer-Aided Analysis (VOCAL) program. VOCAL is the combination of 3D ultrasound tissue presented as voxels and geometric information of surfaces in a 3D dataset. It is defined by rotating an image plane around a fixed axis and defining 2D contours of each plane. The 2D contours of the polygonal area in each plane can be defined automatically or manually. There are four rotation angles to choose from: 6°, 9°, 15° and 30°, and because the entire dataset is rotated about 180,° these result in 30, 20, 12 and 6 planes, respectively, being available for measurements. The result is converted to mL or cm3 ultrasound units (Figure 1).
Figure 1.

3D-volume calculation in a VOCAL program. Note the 2D contours of the endometrium have to be defined in different planes
In a previous study we documented the reproducibility of the endometrial volume measurement in 57 consecutive patients undergoing in-vitro fertilization (14). The interobserver reliability was 0.96 with an intraobserver reliability of 0.94. High reproducibility was also obtained for ovarian volume and power Doppler indices (15–19).
We evaluated the in-vivo accuracy of 3D volume measurements of the uterus (20). In this study, transvaginal ultrasound examinations were performed in 48 consecutive patients before hysterectomy. Immediately after hysterectomy, the true volume was measured in a water bath. Although the volumes estimated by the 3D method were not significantly different (p=0.126), the volumes estimated by the 2D method were significantly different (p=0.005). The mean error rate of the 3D volume measurement was 7.4%, and 22.2% for the 2D volume measurement (Figure 2, Table 1). The limitation of the uterine volume measurement by 3D was the uterine size. An uterus more than 220 ml. could not be measured accurately. The high accuracy of volume measurements by 3D ultrasound was also confirmed by other studies (21–25).
Figure 2.
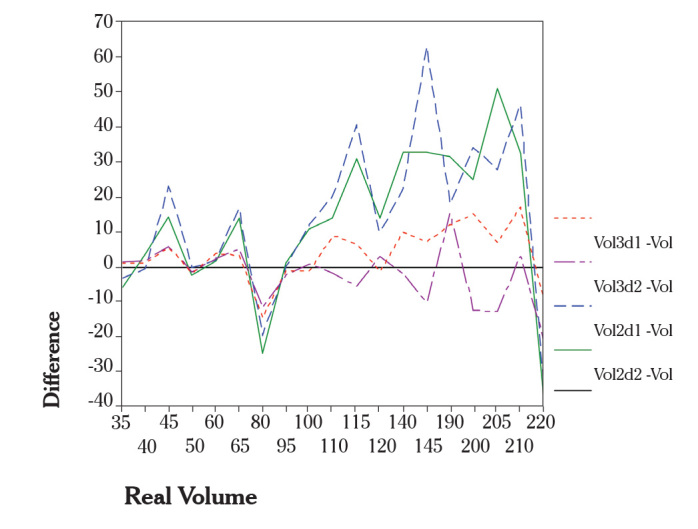
Differences of estimated volumes and real volumes (vertical axis) are plotted against the real volumes (horizontal axis). For a better view, the single points of each method (2D, 3D, first, second measurement) were connected by lines
Table 1.
Shows that the median of the absolute differences for 3D (estimated volume-real volume) lies between 6.4 and 6.9, whilst for 2D the median lies between 16.9 and 17.4
| Number | Minimum | Median | Maximum | Mean | Standard-deviation | Variance | |
|---|---|---|---|---|---|---|---|
| 2D Vol 1 | 35 | 31.2 | 113.7 | 274.2 | 121.6 | 69.8 | 4871.2 |
| 2D Vol 2 | 35 | 28.8 | 114.0 | 299.3 | 120.5 | 70.2 | 4931.9 |
| 3D Vol 1 | 35 | 36.2 | 102.7 | 237.6 | 111.8 | 61.0 | 3719.1 |
| 3D Vol 2 | 35 | 35.4 | 104.5 | 241.6 | 108.5 | 56.5 | 3192.8 |
| Real Volume | 35 | 35 | 100 | 220 | 109 | 57 | 3199 |
| Vol3D1-Vol* | 35 | −20.10 | 3.40 | 44.30 | 2.98 | 11.35 | 128.74 |
| Vol3D2-Vol* | 35 | −21.10 | −1.50 | 51.60 | −.34 | 12.37 | 153.09 |
| Vol2D1-Vol* | 35 | −47.60 | 15.50 | 84.20 | 12.79 | 27.26 | 743.15 |
| Vol2D2-Vol* | 35 | −45.80 | 14.00 | 109.30 | 11.65 | 28.03 | 785.45 |
| ABS(Vol3D1-Vol)** | 35 | .20 | 6.40 | 44.30 | 8.20 | 8.29 | 68.68 |
| ABS(Vol3D2-Vol)** | 35 | 1.10 | 6.90 | 51.60 | 8.46 | 8.92 | 79.48 |
| ABS(Vol2D1-Vol)** | 35 | 3.20 | 16.90 | 84.20 | 23.98 | 17.88 | 319.63 |
| ABS(Vol2D2-Vol)** | 35 | 5.20 | 17.40 | 109.30 | 23.20 | 19.26 | 370.99 |
Difference of estimated volume-real volume,
Absolute difference of estimated volume-real volume
Volume storing
Although 2D ultrasound makes it possible for physicians to make important contributions to patient management, there are occasions when it is difficult to develop a 3D impression of the patient’s anatomy. The typical approach to overcome this problem is to scan repeatedly through the region-of-interest (ROI) to make an exact diagnosis. This process can be time consuming and tedious. Furthermore, time consuming examinations can alienate the patients. In contrast to 2D ultrasound, which allows particular planes, 3D volume acquisition enables the presenting of the whole organ simply, so that the whole organ can be stored for later examinations. In addition, this ability has an important “teaching effect” as it allows a re-evaluation of the examination after histologic findings of tumors and such.
3D-power Doppler
Quantitative 3D power Doppler angiography represents the acquisition and measurement of power Doppler data within a 3D data set. This technique is being used to compare pregnant and non-pregnant patients undergoing ART. The majority of these studies use the ‘histogram’ tool, which displays the distribution of the power Doppler data and uses specific algorithms to derive indices of blood flow: vascularisation index (VI) characterises vessel density: the ratio of the number of colour voxels to the total number, flow index (FI) describes the intensity of blood flow: the ratio of the sum of colour intensities to the colour voxels and the vascularisation flow index (VFI) assesses both vascularisation and perfusion: the ratio of the sum of colour intensities to the total number of voxels (Figure 3).
Figure 3.

Vascularisation index (VI), flow index (FI) and the vascularisation flow index (VFI) assessed both vascularisation and perfusion
These vascular indices depend on, and relate to, the total and relative amounts of power Doppler information within the target organ and the intensity of the signals. The power Doppler signal is dependent on the presence of blood flow within the target organ and its intensity is dependent on the number of blood cells within the blood vessels. The intensity of the power Doppler spectrum is determined by several settings: gain, pulse repetition frequency (PRF), line density, wall motion filter, signal rise and persistence and speed of acquisition.
Limitations and artifacts
Understanding of how artifacts occur, and what can be done to detect and correct for them, is important in order to avoid mistaking them for a pathology and to make correct interpretations of clinical 3D ultrasound.
Three types of artifacts can be caused by different sources in 3D ultrasound imaging. Some artifacts occur due to the 2D imaging process. Other artifacts are unique to 3D ultrasound, arising from patient motion or rendering method, which alter the appearance of the anatomy. Lastly, there are artifacts that arise as the result of operator choice in selecting which part of the volume to display (26). Each of these artifact sources may alter the displayed images and lead to incorrect diagnosis. Consequently, differentiation of the endometrial border from neighboring structures (e.g. myometrium), may be very difficult, especially in obese women. As a result, volume measurements cannot be performed accurately. In cases where power Doppler signal artifacts exist, power Doppler indices of target organ cannot be measured accurately.
Using power Doppler, it is essential to maintain identical settings if different subjects, or if changes over time within the same subject, are to be compared. One of the most important Doppler settings is color gain. Doppler gain appears to be directly correlated with all the 3D power Doppler indices, and the use of higher gains may lead to false signals that could be interpreted as real blood flow (Figure 4a, b).
Figure 4.

a) Vascularisation of ovarian cyst with low gain. b) Vascularisation of the same ovarian cyst with high gain. Note high grade artifacts
Raine-Fenning et al. (27) evaluated how different settings affect the Doppler signal in terms of its quantification by these three indices within a 3D dataset. They found that the gain and signal power have the greatest effect on the power Doppler signal, followed closely by the PRF. The other settings and speed of acquisition also influence the signal, but to a much lesser degree. It is essential to maintain constant Doppler settings if any meaningful comparisons are to be made within and between subjects.
Standardizing the color gain between different machines is almost impossible, as the parameters used to define it differ widely among different companies and on different scales within the same company (28).
Endometrial receptivity
Endometrial receptivity is an important factor in human reproduction. It has usually been assessed by endometrial biopsy. However, such an invasive method is not acceptable when evaluating endometrial receptivity. Ideally, it should be evaluated by a non-invasive method.
Lee et al. (29) first reported endometrial volume changes during spontaneous menstrual cycles assessed by 3D US. These authors performed a longitudinal study on 18 nullipara regularly menstruating women, at 3–6 day intervals during a single menstrual cycle, measuring the endometrial and uterine volume and calculating the “uterus-endometrium” ratio. The mean endometrial volume was 1.23 cm3 (SD: 0.98), ranging from 0.25 cm3 to 5.5 cm3. They found that this ratio decreased throughout the menstrual cycle, reaching a nadir around the 20th day of the cycle, reflecting that endometrial volume was highest at mid luteal phase.
Raine-Fenning et al. (30) analysed the endometrial volume longitudinally in a series of 30 fertile women, having regular menstrual cycles. They found a steady increase of the endometrial volume throughout the follicular phase until ovulation occurs and then remained relatively constant throughout the luteal phase. These findings would be in agreement with histological data in which endometrial growth is restricted to the follicular phase of the menstrual cycle when expansion of the stratum functionalis of the endometrium occurs. This in turn is directly related to the increase of serum estradiol levels. In this study, endometrial volume was found to be greater in parous women.
Two parameters are considered to predict pregnancy: a) endometrial volume and b) (sub) endometrial flow.
-
The first studies reported a good correlation between endometrial volume and pregnancy (31–33). Although it has been shown that the endometrium must attain at least 2.0–2.5 ml to achieve a pregnancy, recent studies did not confirm the relation between endometrial volume and pregnancy outcome (33–37). In our study, the area under the receiver operating characteristic (ROC) curve was statistically significant for endometrial volume when no grade 1 embryos or only one were transferred but not significant when two or three grade 1 embryos were transferred (34).
In conclusion, endometrial volume is also unlikely to be predictive of pregnancy, although the pregnancy rate may be significantly reduced in patients whose endometrial volume is less than 2.0–2.5 ml. The suggestion that endometrial thickness is determined by the individual uterine architecture, and therefore not predictive of the likelihood of implantation, may be related to endometrial volume (38).
A good blood supply to the endometrium is usually considered as an essential requirement for implantation. Therefore endometrial and subendometrial blood flows were evaluated in several studies. The first study was reported by Schild et al. (39), who measured the subendometrial blood flow on the first day of ovarian stimulation in 75 infertile patients after pituitary down-regulation was confirmed, i.e. endometrial thickness <5 mm, no ovarian cyst of >2.5 cm and serum estradiol concentrations of <60 pg/ml. Subendometrial VI, FI and VFI were significantly lower in pregnant cycles than non-pregnant ones. Logistic regression analysis found that the subendometrial FI was the strongest predictive factor for the outcome among the tested 3D Doppler flow indices.
A recent study by Kim et al. (40) evaluated whether endometrial and subendometrial blood flow parameters measured using three-dimensional power Doppler ultrasound (3D PD-US) can predict pregnancy after intrauterine insemination (IUI). They diagnosed higher endometrium VI, FI, and VFI scores in the pregnant group than in the non-pregnant group. In contrast, the subendometrial region VI, FI, and VFI scores did not differ between the groups. Pregnancies did not occur when endometrial blood flow had not been detected. Therefore, they concluded that three-dimensional PD-US was useful for evaluating endometrial and subendometrial neovascularization in IUI cycles. Similar results were reported by other authors (41, 42).
Ng et al. (43) evaluated endometrial and subendometrial blood flows on the days of human chorionic gonadotrophin (HCG) administration and embryo transfer. They also assessed the percentage change in endometrial and subendometrial blood flows between these two days as a predictor of pregnancy during IVF treatment. A 3D ultrasound examination with power Doppler was performed in 293 patients undergoing the first IVF cycle to determine endometrial thickness, endometrial volume, vascularization index, flow index and vascularization flow index of endometrial and subendometrial regions on the days of HCG administration and embryo transfer. Patients in non-pregnant and pregnant groups had comparable endometrial thickness, endometrial volume and 3D power Doppler flow indices of endometrial and subendometrial regions measured on each day. Percentage changes in endometrial and subendometrial 3D power Doppler flow indices were also similar. In conclusion, endometrial and subendometrial blood flows on the days of HCG treatment and embryo transfer and the percentage change in endometrial and subendometrial blood flows between these 2 days were not predictive of pregnancy.
Vlaisavljević et al. (44) examined whether we might predict the outcome of unstimulated IVF/ICSI cycles with quantitative indices of perifollicular blood flow assessed with three-dimensional power Doppler images. This prospective study included an analysis of 52 unstimulated cycles. Color and power Doppler ultrasound examinations of a single dominant preovulatory follicle were performed on the day of oocyte pick-up. They hypothesized that the follicles containing oocytes able to produce a pregnancy have a distinctive and more uniform perifollicular vascular network.
Conclusion
3D Ultrasound has been proposed as a promising tool for evaluating the endometrium, but a review of the literature regarding its role for assessing endometrial function did not confirm the suggested benefits of this technique. Endometrial volume, endometrial and subendometrial flows have been shown to be ineffective for predicting pregnancy. Interactions between blastocyst and endometrium, e.g. embryo quality, seem to play a more important role than endometrial volume or (sub) endometrial blood flow.
Variable machine settings, differences in examination timing, different Doppler parameters or determination of endometrial volume by uterine architecture may explain why 3D is not predictive in the assessment of pregnancy in patients undergoing ART.
Footnotes
Conflict of interest
No conflict of interest was declared by the authors.
References
- 1.Jurkovic D, Geipel A, Gruboeck K, Jauniaux E, Natucci M, Campbell S. Three-dimensional ultrasound for the assessment of uterine anatomy and detection of congenital anomalies: a comparison with hysterosalpingography and two-dimensional sonography. Ultrasound Obstet Gynecol. 1995;5:233–7. doi: 10.1046/j.1469-0705.1995.05040233.x. [DOI] [PubMed] [Google Scholar]
- 2.Weismann CF, Datz L. Diagnostic algorithm: how to make use of new 2D, 3D and 4D ultrasound technologies in breast imaging. Eur J Radiol. 2007;64:250–7. doi: 10.1016/j.ejrad.2007.07.025. [DOI] [PubMed] [Google Scholar]
- 3.Yaman C, Fridrik M. Three-dimensional ultrasound to assess the response to treatment in gynecological malignancies. Gynecol Oncol. 2005;97:665–8. doi: 10.1016/j.ygyno.2005.01.012. [DOI] [PubMed] [Google Scholar]
- 4.Yaman C, Ebner T, Jesacher K. Three-dimensional power Doppler in the diagnosis of ovarian torsion. Ultrasound Obstet Gynecol. 2002;20:513–5. doi: 10.1046/j.1469-0705.2002.00834.x. [DOI] [PubMed] [Google Scholar]
- 5.Yaman C, Habelsberger A, Tews G, Pölz W, Ebner T. The role of three-dimensional volume measurement in diagnosing endometrial cancer in patients with postmenopausal bleeding. Gynecol Oncol. 2008;110:390–5. doi: 10.1016/j.ygyno.2008.04.029. [DOI] [PubMed] [Google Scholar]
- 6.Yaman C, Sommergruber M, Ebner T, Pölz W, Moser M, Tews G. Reproducibility of transvaginal three-dimensional endometrial volume measurements during ovarian stimulation. Hum Reprod. 1999;14:2604–8. doi: 10.1093/humrep/14.10.2604. [DOI] [PubMed] [Google Scholar]
- 7.Wu HM, Chiang CH, Huang HY, Chao AS, Wang HS, Soong YK. Detection of the subendometrial vascularization flow index by three-dimensional ultrasound may be useful for predicting the pregnancy rate for patients undergoing in vitro fertilization-embryo transfer. Fertil Steril. 2003;79:507–11. doi: 10.1016/s0015-0282(02)04698-8. [DOI] [PubMed] [Google Scholar]
- 8.Mercé LT, Barco MJ, Bau S, Troyano J. Are endometrial parameters by three-dimensional ultrasound and power Doppler angiography related to in vitro fertilization/embryo transfer outcome? Fertil Steril. 2008;89:111–7. doi: 10.1016/j.fertnstert.2007.02.029. [DOI] [PubMed] [Google Scholar]
- 9.Yaman C, Ebner T, Sommergruber M, Hartl J, Pölz W, Tews G. Three-dimensional endometrial volume estimation as a predictor of pituitary down-regulation in an IVF-embryo transfer programme. Hum Reprod. 2000;15:1698–702. doi: 10.1093/humrep/15.8.1698. [DOI] [PubMed] [Google Scholar]
- 10.Ng EH, Chan CC, Tang OS, Yeung WS, Ho PC. Endometrial and subendometrial vascularity is higher in pregnant patients with livebirth following ART than in those who suffer a miscarriage. Hum Reprod. 2007;22:1134–41. doi: 10.1093/humrep/del458. [DOI] [PubMed] [Google Scholar]
- 11.Friedler S, Schenker JG, Herman A, Lewin A. The role of ultrasonography in the evaluation of endometrial receptivity following assisted reproductive treatments: a critical review. Hum Reprod Update. 1996;2:323–35. doi: 10.1093/humupd/2.4.323. [DOI] [PubMed] [Google Scholar]
- 12.Ng EH, Chan CC, Tang OS, Yeung WS, Ho PC. The role of endometrial and subendometrial blood flows measured by three-dimensional power Doppler ultrasound in the prediction of pregnancy during IVF treatment. Hum Reprod. 2006;21:164–70. doi: 10.1093/humrep/dei277. [DOI] [PubMed] [Google Scholar]
- 13.Zácková T, Järvelä IY, Tapanainen JS, Feyereisl J. Assessment of endometrial and ovarian characteristics using three dimensional power Doppler ultrasound to predict response in frozen embryo transfer cycles. Reprod Biol Endocrinol. 2009;7:151. doi: 10.1186/1477-7827-7-151. [DOI] [PMC free article] [PubMed] [Google Scholar]
- 14.Yaman C, Sommergruber M, Ebner T, Pölz W, Moser M, Tews G. Reproducibility of transvaginal three-dimensional endometrial volume measurements during ovarian stimulation. Hum Reprod. 1999;14:2604–8. doi: 10.1093/humrep/14.10.2604. [DOI] [PubMed] [Google Scholar]
- 15.Mercé LT, Gómez B, Engels V, Bau S, Bajo JM. Intraobserver and interobserver reproducibility of ovarian volume, antral follicle count, and vascularity indices obtained with transvaginal 3-dimensional ultrasonography, power Doppler angiography, and the virtual organ computer-aided analysis imaging program. J Ultrasound Med. 2005;24:1279–87. doi: 10.7863/jum.2005.24.9.1279. [DOI] [PubMed] [Google Scholar]
- 16.Järvelä IY, Sladkevicius P, Tekay AH, Campbell S, Nargund G. Intraobserver and interobserver variability of ovarian volume, gray-scale and color flow indices obtained using transvaginal three-dimensional power Doppler ultrasonography. Ultrasound Obstet Gynecol. 2003;21:277–82. doi: 10.1002/uog.62. [DOI] [PubMed] [Google Scholar]
- 17.Alcázar JL, Mercé LT, Manero MG, Bau S, López-García G. Endometrial volume and vascularity measurements by transvaginal 3-dimensional ultrasonography and power Doppler angiography in stimulated and tumoral endometria: an interobserver reproducibility study. J Ultrasound Med. 2005;24:1091–8. doi: 10.7863/jum.2005.24.8.1091. [DOI] [PubMed] [Google Scholar]
- 18.Raine-Fenning NJ, Campbell BK, Clewes JS, Kendall NR, Johnson IR. The interobserver reliability of three-dimensional power Doppler data acquisition within the female pelvis. Ultrasound Obstet Gynecol. 2004;23:501–8. doi: 10.1002/uog.1019. [DOI] [PubMed] [Google Scholar]
- 19.Mercé LT, Gómez B, Engels V, Bau S, Bajo JM. Intraobserver and interobserver reproducibility of ovarian volume, antral follicle count, and vascularity indices obtained with transvaginal 3-dimensional ultrasonography, power Doppler angiography, and the virtual organ computer-aided analysis imaging program. J Ultrasound Med. 2005;24:1279–87. doi: 10.7863/jum.2005.24.9.1279. [DOI] [PubMed] [Google Scholar]
- 20.Yaman C, Jesacher K, Pölz W. Accuracy of three-dimensional transvaginal ultra-sound in uterus volume measurements; comparison with two-dimensional ultra-sound. Ultrasound Med Biol. 2003;29:1681–4. doi: 10.1016/s0301-5629(03)01070-6. [DOI] [PubMed] [Google Scholar]
- 21.Berg S, Torp H, Blaas HG. Accuracy of in-vitro volume estimation of small structures using three-dimensional ultrasound. Ultrasound Med Biol. 2000;3:425–32. doi: 10.1016/s0301-5629(99)00154-4. [DOI] [PubMed] [Google Scholar]
- 22.Gilia OH, Thune N, Matre K, Hausken T, Odegaard S, Berstad A. In vitro evaluation of three-dimensional ultrsonography in volume estimation of abdominal organs. Ultrasound Med Biol. 1994;20:157–65. doi: 10.1016/0301-5629(94)90080-9. [DOI] [PubMed] [Google Scholar]
- 23.Farrell T, Leslie JR, Chien PF, Agustsson P. The reliability and validity of three dimensional ultrasound volumetric measurements using an in vitro balloon and in vivo uterine model. BJOG. 2001;108:573–82. doi: 10.1111/j.1471-0528.2001.00148.x. [DOI] [PubMed] [Google Scholar]
- 24.Kyei-Mensah A, Zaidi J, Pittrof R, Shaker A, Campbell S, Tan SL. Transvaginal three-dimensional ultrasound: accuracy of follicular volume measurements. Fertil Steril. 1996;65:371–6. [PubMed] [Google Scholar]
- 25.Riccabona M, Nelson TR, Pretorius DH. Three-dimensional ultrasound: accuracy of distance and volume measurements. Ultrasound Obstet Gynecol. 1996;7:429–34. doi: 10.1046/j.1469-0705.1996.07060429.x. [DOI] [PubMed] [Google Scholar]
- 26.Thomas R. Nelson, Dolores H. Pretorius: Three dimensional ultrasound imaging. Ultrasound in Med&Biol. 1998;24:1243–70. doi: 10.1016/s0301-5629(98)00043-x. [DOI] [PubMed] [Google Scholar]
- 27.Raine-Fenning NJ, Nordin NM, Ramnarine KV, Campbell BK, Clewes JS, Perkins A, et al. Evaluation of the effect of machine settings on quantitative three-dimensional power Doppler angiography: an in-vitro flow phantom experiment. Ultrasound Obstet Gynecol. 2008;32:551–9. doi: 10.1002/uog.6138. [DOI] [PubMed] [Google Scholar]
- 28.Martins WP, Raine-Fenning NJ, Ferriani RA, Nastri CO. Quantitative three-dimensional power Doppler angiography: a flow-free phantom experiment to evaluate the relationship between color gain, depth and signal artifact. Ultrasound Obstet Gynecol. 2010;35:361–8. doi: 10.1002/uog.7562. [DOI] [PubMed] [Google Scholar]
- 29.Lee A, Sator M, Kratochwil A, Deutinger J, Vytiska-Binsdorfer E, Bernaschek G. Endometrial volume change during spontaneous menstrual cycles: volumetry by transvaginal three-dimensional ultrasound. Fertil Steril. 1997;68:831–5. doi: 10.1016/s0015-0282(97)00362-2. [DOI] [PubMed] [Google Scholar]
- 30.Raine-Fenning NJ, Campbell BK, Clewes JS, Kendall NR, Johnson IR. Defining endometrial growth during the menstrual cycle with three-dimensional ultra-sound. BJOG. 2004;111:944–9. doi: 10.1111/j.1471-0528.2004.00214.x. [DOI] [PubMed] [Google Scholar]
- 31.Raga F, Bonilla-Musoles F, Casañ EM, Klein O, Bonilla F. Assessment of endometrial volume by three-dimensional ultrasound prior to embryo transfer: clues to endometrial receptivity. Hum Reprod. 1999;14:2851–4. doi: 10.1093/humrep/14.11.2851. [DOI] [PubMed] [Google Scholar]
- 32.Kupesic S, Bekavac I, Bjelos D, Kurjak A. Assessment of endometrial receptivity by transvaginal color Doppler and three-dimensional power Doppler ultrasonography in patients undergoing in vitro fertilization procedures. Ultrasound Med. 2001;20:125–34. doi: 10.7863/jum.2001.20.2.125. [DOI] [PubMed] [Google Scholar]
- 33.Zollner U, Zollner KP, Specketer MT, Blissing S, Müller T, Steck T, et al. Endometrial volume as assessed by three-dimensional ultrasound is a predictor of pregnancy outcome after in vitro fertilization and embryo transfer. Fertil Steril. 2003;80:1515–7. doi: 10.1016/j.fertnstert.2003.08.004. [DOI] [PubMed] [Google Scholar]
- 34.Yaman C, Ebner T, Sommergruber M, Pölz W, Tews G. Role of three-dimensional ultrasonographic measurement of endometrium volume as a predictor of pregnancy outcome in an IVF-ET program: preliminary study. Fertil Steril. 2000;74:797–801. doi: 10.1016/s0015-0282(00)01493-x. [DOI] [PubMed] [Google Scholar]
- 35.Schild RL, Indefrei D, Eschweiler S, Van der Ven H, Fimmers R, Hansmann M. Three-dimensional endometrial volume calculation and pregnancy rate in an in-vitro fertilization programme. Hum Reprod. 1999;14:1255–8. doi: 10.1093/humrep/14.5.1255. [DOI] [PubMed] [Google Scholar]
- 36.Mercé LT, Barco MJ, Bau S, Troyano J. Are endometrial parameters by three-dimensional ultrasound and power Doppler angiography related to in vitro fertilization/embryo transfer outcome? Fertil Steril. 2008;89:111–7. doi: 10.1016/j.fertnstert.2007.02.029. [DOI] [PubMed] [Google Scholar]
- 37.Järvelä IY, Sladkevicius P, Kelly S, Ojha K, Campbell S, Nargund G. Evaluation of endometrial receptivity during in-vitro fertilization using three-dimensional power Doppler ultrasound. Ultrasound Obstet Gynecol. 2005;26:765–9. doi: 10.1002/uog.2628. [DOI] [PubMed] [Google Scholar]
- 38.Strohmer H, Obruca A, Radner KM, Feichtinger W. Relationship of the individual uterine size and the endometrial thickness in stimulated cycles. Fertil Steril. 1994;61:972–5. doi: 10.1016/s0015-0282(16)56716-8. [DOI] [PubMed] [Google Scholar]
- 39.Schild RL, Knobloch C, Dorn C, Fimmers R, van der Ven H, Hansmann M. Endometrial receptivity in an in vitro fertilization program as assessed by spiral artery blood flow, endometrial thickness, endometrial volume, and uterine artery blood flow. Fertil Steril. 2001;75:361–6. doi: 10.1016/s0015-0282(00)01695-2. [DOI] [PubMed] [Google Scholar]
- 40.Kim A, Han JE, Yoon TK, Lyu SW, Seok HH, Won HJ. Relationship between endometrial and subendometrial blood flow measured by three-dimensional power Doppler ultrasound and pregnancy after intrauterine insemination. Fertil Steril. 2010;94:747–52. doi: 10.1016/j.fertnstert.2009.03.084. [DOI] [PubMed] [Google Scholar]
- 41.Wang L, Qiao J, Li R, Zhen X, Liu Z. Role of endometrial blood flow assessment with color Doppler energy in predicting pregnancy outcome of IVF-ET cycles. Reprod Biol Endocrinol. 2010;8:122. doi: 10.1186/1477-7827-8-122. [DOI] [PMC free article] [PubMed] [Google Scholar]
- 42.Zácková T, Järvelä IY, Tapanainen JS, Feyereisl J. Assessment of endometrial and ovarian characteristics using three dimensional power Doppler ultrasound to predict response in frozen embryo transfer cycles. Reprod Biol Endocrinol. 2009;7:151. doi: 10.1186/1477-7827-7-151. [DOI] [PMC free article] [PubMed] [Google Scholar]
- 43.Ng EH, Chan CC, Tang OS, Yeung WS, Ho PC. Changes in endometrial and subendometrial blood flow in IVF. Reprod Biomed Online. 2009;18:269–75. doi: 10.1016/s1472-6483(10)60265-9. [DOI] [PubMed] [Google Scholar]
- 44.Vlaisavljević V, Reljic M, Gavrić Lovrec V, Zazula D, Sergent N. Measurement of perifollicular blood flow of the dominant preovulatory follicle using three-dimensional power Doppler. Ultrasound Obstet Gynecol. 2003;22:520–6. doi: 10.1002/uog.225. [DOI] [PubMed] [Google Scholar]