

Abstract
Objective
To evaluate serum total and lipid bound sialic acid (TSA&LBSA) levels in patients with polycystic ovary syndrome (PCOS).
Material and Methods
Forty women with PCOS and 35 healthy controls were enrolled in the study. Serum TSA, LBSA, follicle stimulating hormone, lutenizing hormone, estradiol, thyroid stimulating hormone, prolactin, dehydroepiandrosterone sulphate, androstenedione, free testosterone, total testosterone, 17-OH progesterone, sex hormone binding globulin, cortisol, total cholesterol, triglyceride, high density lipoprotein and low density lipoprotein were measured in each subject. Insulin resistance was estimated by fasting insulin level, fasting glucose: insulin ratio and 75-g glucose tolerance test for 2 hours.
Results
Serum TSA levels were not significantly different between the groups. Serum LBSA levels were higher in patients with PCOS compared to the control group. TSA was correlated with androstenedione and HOMA-IR in the PCOS group. Positive correlations were found between LBSA and dehydroepiandrosterone sulphate in patients with PCOS. After correction for BMI, the only existing significant correlation was between LBSA and follicle stimulating hormone.
Conclusion
Serum LBSA levels, which has previously been found to be higher in cardiovascular diseases and diabetes mellitus, are elevated in PCOS.
Keywords: Polycystic ovary syndrome, total sialic acid, lipid bound sialic acid, risk
Özet
Amaç
Polikistik over sendromlu hastalarda (PKOS) serum total ve lipid bağlı sialik asit (TSA&LBSA) düzeylerinin değerlendirilmesi.
Gereç ve Yöntemler
Çalışmaya kırk PKOS’lu hasta ve 35 sağlıklı kontrol dahil edildi. Her olguda serumda TSA, LBSA, folikül stimülan hormon, luteinizan hormon, östradiol, tiroid stimülan hormon, prolaktin, dehidroepiandrosteron sülfat, androstenedion, serbest testosteron, total testosteron, 17-OH progesteron, seks hormon bağlayıcı globulin, kortizol, total kolesterol, trigliserid, yüksek densiteli lipoprotein ve düşük densiteli lipoprotein ölçüldü. Açlık insülin seviyesi, açlık glükozu/insülin oranı ve 2 saatlik 75-g glükoz tolerans testi ile insülin rezistansı değerlendirildi.
Bulgular
Serum TSA seviyeleri açısından gruplar arasında anlamlı fark yoktu. Kontrol grubuna göre karşılaştırıldığında PKOS’lu hastalarda serum LBSA seviyeleri yüksekti. PKOS grubunda TSA, androstenedione ve HOMA-IR ile korele bulundu. PKOS’lu hastalarda LBSA ile dehidroepiandrosteron sulfat arasında pozitif korelasyon bulundu. BMI’ya göre düzeltme sonrası, kalan tek anlamlı korelasyon LBSA ile folikül stimülan hormon arasında idi.
Sonuç
Kardiyovasküler hastalıklarda ve diabette arttığı bilinen LBSA’nın serum seviyeleri PKOS’da yükselir.
Introduction
Polycystic ovary syndrome (PCOS) is a common endocrine disease in women during the reproductive ages (l). Patients with PCOS are in the high risk group for coronary heart disease because of their abnormal lipid profile, insulin resistance and obesity (2). Additionally, it was shown that PCOS causes significant risks for diabetes mellitus (DM) in patients early in their life. All these findings show that there is an increase in prevelance of cardiovascular disease (CVD) and DM in PCOS with time (3).
Sialic acids (SA) are acillated neuraminic acids found in glycoproteins and glycolipids of cell membrane and in other parts of the cell (4). SA has many biological functions: it provides additional electronegativity to the cell, is a main compound of many receptors on cell surface and affects the macromolecular structure of glucoconjugates and prevents their degradation (5).
The elevation in serum SA concentrations was demonstrated in coronary heart disease and myocardial infarction (6). Despite the observed relationship between SA and cardiovascular disease, the reasons for this are not clear. Additionally, serum total and lipid bound SA were found to be elevated in DM and total sialic acid levels were shown to be related with some diabetic complications (7). Sialic acids in the human body are mainly found in the terminal oligosaccharide of glycoprotein structured acute phase reactants which are fibrinogen, C-reactive protein, haptoglobulin, α-1 antitripsin, ceruloplasmin, transferrin and complement. Because some of these sializated glycoproteins are acute phase reactants, their concentrations increase rapidly at the beginning of inflammatory reactions (8, 9).
Since PCOS is related to DM and cardiovascular diseases and TSA and LBSA were found to be elevated in these two common disorders, we planned to evaluate the serum TSA and LBSA levels in patients with PCOS and healthy controls.
Material and Methods
Forty women between the ages of 18 to 35 years with PCOS, and 35 healthy women as the control group, were included in the study. Study participants were enrolled from patients who attended the outpatient clinics of the gynecology and obstetrics department in our institution. A full Institutional Review Board approval was obtained from Kirikkale University School of Medicine Ethical Committee (approval no. 2005/150). All subjects were informed, and written and signed consents were taken.
PCOS was diagnosed according to the 2003 Rotterdam criteria (10) after the exclusion of related disorders, by two of the following three features: i) oligo- or anovulation, ii) clinical and/or biochemical signs of hyperandrogenism, or iii) polycystic ovaries. Detailed medical history and physical examination were performed in all subjects.
Inclusion criteria for the study were:
Women at ages ranging from 18 to 35 years with the diagnosis of PCOS
Women at ages ranging from 18 to 35 years with regular menstrual cycles and without systemic and hormonal pathologies, who attended for vaginal discharge or for information about contraceptive methods were included in the study as the control group.
Exclusion criteria for PCOS and control groups were as follows:
Patients with previously diagnosed endocrinological diseases such as diabetes mellitus, hyper or hypothyroidism or Cushing syndrome,
History of malignancy,
Pneumonia, Rheumatoid arthritis, Behçet’s and Crohn disease,
Patients on drugs such as oral contraceptives, steroids, GnRH agonists or antagonists or progesterone,
Patients with collagen tissue diseases, impaired renal functions or impaired liver functions,
Patients using drugs that alter sex hormone metabolism,
Patients with atherosclerosis and hypertension,
History of previous thromboembolism.
Age, weight, height and waist/hip ratio (WHR) of the subjects were noted and body mass indices (BMI) were calculated according to the body weight (kg) / height (m2) formula. Pelvic transabdominal or transvaginal ultrasonography was performed for each subject.
Laboratory Measurements
Blood samples were taken from all subjects between 08:00–09:00 A.M. after 12 hours of fasting on the third day of the menstrual cycle for sialic acid and routine hormonal measurements
Follicle stimulating hormone (FSH), lutenizing hormone (LH), estradiol (E2), thyroid stimulating hormone (TSH), prolactin (PRL), dehydroepiandrosterone sulphate (DHEAS), androstenedione, free testosterone (free T), testosterone (T), 17-OH progesterone, sex hormone binding globulin (SHBG), cortisol, total cholesterol, triglyceride, high density lipoprotein (HDL) and low density lipoprotein (LDL) levels were measured for each subject.
Blood samples for TSA and LBSA were centrifuged at 4°C and 1.600 r/m for 15 minutes. Serum obtained after this procedure was kept at −20°C for the analysis of total and lipid bound sialic acid levels. TSA and LBSA levels were measured by using methods previously defined by Katopodis et al. (11) and Plucinsky et al. (12).
After 12 hours fasting, 75 gr OGTT was performed for all subjects. Fasting blood glucose and insulin levels were measured, and then blood glucose level was measured again at the second hour after ingestion of 75 g of glucose solution. Additionally, fasting glucose/fasting insulin ratio was calculated. Insulin resistance was calculated according to the HOMA (Homeostasis Model Assessment) method (Formula=Fasting blood glucose level (mg/dl)XFasting insulin level (μIU/ml)/405).
FSH, LH, E2, TSH, PRL, DHEAS, total T and insulin levels were measured with the electrochemilluminescence immunoassay method in the Roche Hitachi E 170 Modular device (Roche Diagnostic, Germany) by using Elecsys 1010/1020 kits.
SHBG, free T, androstenedione, 17 OH progesterone levels were measured with the ELISA method in μQuant trade mark Spectrophotometric device (Biotek Instruments Inc., USA) using EIA kits (DSL, Diagnostic System Laboratories Inc., USA).
Triglyceride, HDL, LDL, total cholesterol and glucose levels were measured with the colorimetric method in the Roche Hitachi Modular P800 autoanalyzer device by using Roche mark kits (Roche Diagnostic, Germany).
Statistical Analysis
Statistical analysis was performed using the Statistical Package for Social Science (SPSS) 11.5 (Inc., Chicago, Illinois, USA) programme. The Shapiro-Wilk statistics was used to test variables for normal distribution. Differences between the means were analyzed by Student’s t-test and Mann-Whitney U-test according to the distribution of data. Data were represented as mean±standard deviation (SD). Pearson correlation coefficients were calculated for continuous variables with normal distribution, and Spearman rank correlation coefficients were calculated for non-normally distributed continuous variables. Partial correlation coefficients were calculated for the above-mentioned parameters, using BMI as a covariate. Power calculation in TSA and LBSA parameters were performed using the Number Cruncher Statistical System-Power Analysis and Sample Size (NCSS-PASS 2005) (Inc., Kaysville, Utah, USA).
In all examinations, a p-value of <0.05 was considered statistically significant.
Results
Demographic characteristics and mean serum hormone, insulin, glucose and lipid measurements of the groups are shown in Table 1. There were no statistically significant differences between patients with PCOS and the control group in respect to age, FSH, TSH, PRL, androstenedione, total T, 17 OH progesterone, cortisol, fasting glucose, second hour glucose and total cholesterol levels.
Table 1.
Demographic characteristics and mean serum hormone, insulin, glucose and lipid measurements of the groups
| PCOS | Control | p | |
|---|---|---|---|
| Patient number (n) | 40 | 35 | |
| Age (years) | 22.80±2.70 | 23.82±1.79 | N.S. |
| BMI (kg/m2) | 27.94±6.78 | 21.59±2.68 | p=0.001 |
| Waist/Hip Ratio | 0.82±0.09 | 0.75±0.05 | p=0.001 |
| FSH (mIU/ml) | 5.94±2.23 | 5.50±2.27 | N.S. |
| LH (mIU/ml) | 9.60±4.45 | 6.30±2.86 | p=0.005 |
| LH/FSH | 1.78±0.93 | 1.24±0.65 | p=0.005 |
| Estradiol (pg/ml) | 102.13±88.58 | 53.99±50.86 (41.66)a | p=0.001 |
| TSH (mIU/ml) | 2.20±1.01 | 2.13±0.88 | N.S. |
| PRL (ng/ml) | 15.52±5.07 | 15.95±4.25 | N.S |
| DHEAS (μg/ml) | 260.64±104.83 | 324.68±111.32 | p=0.011 |
| Androstenedione (ng/ml) | 4.56±2.17 | 3.85±1.50 | N.S. |
| Free testosterone (pg/ml) | 4.42±2.61 | 2.68±1.47 | p=0.002 |
| Total testosterone (ng/ml) | 0.59±0.23 | 0.56±0.24 | N.S. |
| SHBG (nmol/L) | 37.09±37.02 (20.55)a | 56.67±32.55 | p=0.001 |
| 17 OH Prog. (ng/ml) | 1.00±0.51 | 0.99±0.57 | N.S. |
| Cortisol (nmol/L) | 381.57±146.57 | 321.01±150.79 | N.S. |
| Fasting insulin (μIU/ml) | 17.87±10.97 | 12.34±10.09 | p=0.001 |
| Fasting glucose (mg/dl) | 86.25±7.13 | 87.40±6.78 | N.S. |
| Fasting glucose/insulin | 7.00±7.30 (5.65)a | 10.60±6.41 | p=0.001 |
| Second hour glucose (mg/dl) | 90.77±12.32 | 91.60±10.89 | N.S. |
| HOMA-IR | 3.85±2.58 | 2.69±2.25 | p=0.001 |
| Triglyceride (mg/dl) | 106.58±56.99 | 87.77±49.40 | p=0.02 |
| HDL (mg/dl) | 52.02±10.79 | 63.29±14.51 | p=0.001 |
| LDL (mg/dl) | 106.67±30.43 | 86.58±19.33 | p=0.001 |
| T. cholesterol (mg/dl) | 160.82±30.15 | 161.37±25.02 | N.S. |
N.S.: Not significant, Mean Data±Standard Deviation,
Median Value
BMI, WHR, LH, E2, free T, fasting insulin, HOMA-IR, tryglyceride and LDL levels were significantly higher in patients with PCOS, whereas SHBG, DHEAS, fasting glucose/ fasting insulin ratio and HDL levels were significantly lower (Table 1).
Power rate was 53% for TSA and 88% for LBSA.
Mean TSA levels were 61.02±7.89 mg/dl in patients with PCOS and 57.94±5.53 mg/dl in the control group (p=0.052). LBSA levels were significantly higher in patients with PCOS (25.23±7.65mg /dl) compared to controls (20.41±5.25 mg /dl) (p=0.003) (Figure 1).
Figure 1.
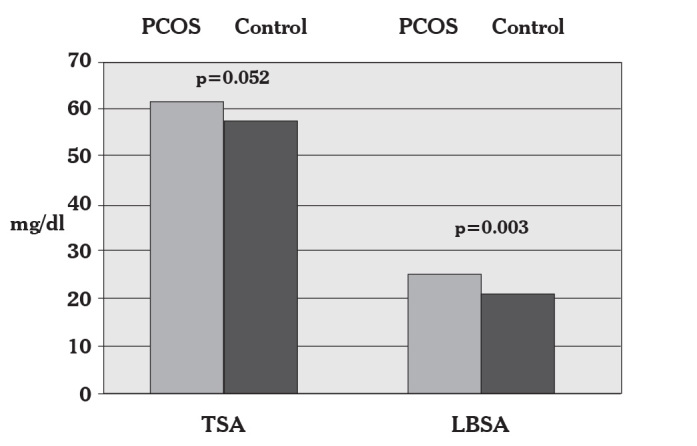
Serum total sialic acid and lipid bound sialic acid levels in patients with PCOS and the controls
In the PCOS group, serum TSA was found to be positively correlated with androstenodione (r=0.338, p=0.032) (Table 2) and HOMA- IR (r=0.558, p=0.001) (Table 3). There was also a significant correlation between serum LBSA and DHEAS (r=0.508, p=0.001) in patients with PCOS (Table 3).
Table 2.
Pearson correlation coefficients (r) between TSA, LBSA and normally distributed variables in patients with PCOS
| TSA (r) | p | LBSA (r) | p | |
|---|---|---|---|---|
| Age (years) | 0.007 | 0.964 | −0.066 | 0.686 |
| LH (mIU/ml) | −0.215 | 0.182 | 0.083 | 0.609 |
| LH/FSH | −0.174 | 0.281 | −0.185 | 0.251 |
| PRL (ng/ml) | 0.057 | 0.726 | 0.141 | 0.384 |
| Androstenedione (ng/ml) | 0.338 | 0.032* | 0.302 | 0.057 |
| Total Testosterone (ng/ml) | 0.116 | 0.473 | 0.178 | 0.269 |
| Cortisol (nmol/L) | 0.081 | 0.617 | 0.214 | 0.183 |
| Fasting glucose (mg/dl) | 0.005 | 0.972 | −0.084 | 0.672 |
| Second hour glucose (mg/dl) | −0.214 | 0.182 | −0.272 | 0.088 |
| HDL (mg/dl) | −0.165 | 0.306 | −0.056 | 0.727 |
| LDL (mg/dl) | 0.081 | 0.615 | 0.264 | 0.098 |
| T. Cholesterol (mg/dl) | 0.088 | 0.586 | 0.123 | 0.449 |
p*:<0.05
Table 3.
Spearman correlation coefficients (r) between TSA, LBSA and non-normally distributed variables in patients with PCOS
| TSA (r) | p | LBSA (r) | p | |
|---|---|---|---|---|
| BMI (kg/m2) | 0.293 | 0.067 | 0.142 | 0.383 |
| Waist/Hip ratio | 0.196 | 0.227 | 0.227 | 0.158 |
| FSH (mIU/ml) | 0.060 | 0.711 | 0.080 | 0.625 |
| Estradiol (pg/ml) | −0.148 | 0.361 | −0.106 | 0.517 |
| TSH (mIU/ml) | 0.227 | 0.160 | 0.117 | 0.470 |
| DHEAS (μg/ml) | 0.125 | 0.441 | 0.508 | 0.001* |
| Free Testosterone (pg/ml) | 0.083 | 0.609 | 0.047 | 0.775 |
| SHBG (nmol/L) | −0.090 | 0.581 | −0.140 | 0.388 |
| 17OH Prog. (ng/ml) | −0.066 | 0.686 | −0.047 | 0.772 |
| Insulin (μIU/ml) | 0.147 | 0.367 | 0.023 | 0.888 |
| Fasting glucose/insulin | 0.240 | 0.136 | 0.146 | 0.368 |
| HOMA-IR | 0.558 | 0.001* | 0.217 | 0.178 |
| Triglyceride (mg/dl) | 0.014 | 0.933 | 0.148 | 0.363 |
p*:<0.05
After adjusting for BMI, no correlations appeared between serum TSA and LBSA levels and the other parameters, except for the significant positive correlation between serum LBSA and FSH (r=0.335, p=0.037).
Discussion
Polycystic ovary syndrome is a common endocrine disease in women in the reproductive ages, and many studies about its etiology, metabolic effects and future risks are still underway.
We found that serum LBSA levels were higher in patients with PCOS, while serum TSA levels did not differ. Serum TSA levels have been reported to be a risk factor for cardiovascular and cerebrovascular disease (13). Higher serum SA levels have also been detected in diabetes mellitus, in either type (14). Recent reports in the literature regarding TSA and LBSA levels in patients with PCOS do not provide sufficiently clear data. Bickerton et al. (15) have previously evaluated a number of biochemical and biophysical markers indicating cardiovascular risk in patients with PCOS. Eleven women with PCOS and 12 controls were included and it was found that total sialic acid levels were similar between the groups (705±149 mg/l vs 713±112 mg/l, p=0.88). LBSA levels were not studied and correlations between TSA levels and other parameters were not investigated. Since data is limited concerning TSA and LBSA levels in PCOS, we also reviewed studies with sialic acid research in the general population and in other clinical situations.
Hag et al. (16) and Hangloo et al. (17) demonstrated that TSA levels did not change with varying age and sex. In contrast, Lindberg et al. reported in a study including approximately ten thousand subjects that TSA levels were similar between ages 25 and 44 years but afterwards progressively increased up to 74 years of age (13). Similarly, Crook et al. (14) stated that, in healthy cases, TSA levels in the elderly population were higher than those in the younger subjects, and this was explained by atherosclerosis which increased with age and thus TSA was a risk factor for cardiovascular disease.
Pönniö et al., (18) showed that serum TSA levels did not increase with age in men, but in women levels increased with age, especially during the menopausal years. In this study it was also shown that serum TSA levels increased in correlation with BMI, systolic and diastolic pressure in healthy male and female subjects. Additionally, after adjustment for age and BMI, the correlation with blood pressure remained. In a small healthy population, Crook et al. (19) found, that the correlation between serum TSA and blood presure was only present in women. High blood pressure is an important cardiovascular risk factor. As the correlation between blood pressure and serum TSA was shown, the role of TSA in predicting cardiovascular mortality could be explained (13, 20). Additionally, serum TSA levels also represented other cardiovascular risk factors such as acute phase reactants which contain sialic acid (21). Thus, serum TSA levels and the risk of coronary artery disease were found to be elevated during the menopause (22).
Diabetic patients, whether type I or II, have been reported to have elevated serum TSA levels in previous studies (23). Many studies have also revealed a direct correlation between serum TSA levels and coronary heart disease in type II DM (24). The coexistence of type II DM and cardiovascular disease may propose a possible insulin resistance or hiperinsulinemia association. Flynn et al. (25) reported that insulin resistance increased serum TSA levels. While we did not find any difference in TSA levels between patients with PCOS and the controls, a significant positive correlation was found between TSA and HOMA-IR in our study. This correlation disappeared after controlling for BMI.
Total SA was found to be elevated in atherosclerotic vascular inflammation (13, 26, 27). Although Crook et al. (19) have demonstrated that there was a significant relation between serum TSA and fasting plasma insulin and glucose in healthy population, especially in women. The associations between TSA levels and other cardiovascular disease risk factors such as fasting insulin level, fasting blood glucose level and insulin resistance are not clear. Bickerton et al. (28) evaluated cardiovascular risk in 11 PCOS and 12 healthy control subjects and reported similar sialic acid levels.
Power analysis for TSA revealed a power rate of 53% in our study. This power rate was lower than expected and, when studies with a larger number of patients and higher power values are performed, the significance of TSA levels in PCOS may be better understood.
Power analysis for LBSA revealed a power rate of 88% in our study and this was a sufficient rate. We found that LBSA levels were significantly elevated in the PCOS group compared to the controls. It was found in many studies that acute phase reactants increased in patients with PCOS (29). The increase in lipid bound SA in patients with PCOS in our study may correlate with the increase in acute phase reactants in PCOS, but we did not study these parameters.
After adjustment for BMI, no correlation was observed between serum LBSA and DHEAS in the PCOS group, whereas a significant correlation appeared between LBSA and FSH. We could not compare our results because we could not find similar data in the literature. Correlations in the PCOS group may be incidental and we think that this can be explained in further detailed studies, including a larger number of subjects.
The weakness in our study is the statistical difference between PCOS and normoovulatory controls. Higher BMI levels in PCOS patients may have affected their results. Further studies between BMI matched groups may clarify the correlations.
In conclusion, we found that serum LBSA levels were higher in patients with PCOS, but more detailed studies are necessary to investigate serum TSA and LBSA levels as risk factors for CVD and DM, and their relations with other hormonal and biochemical parameters in patients with PCOS.
Footnotes
Conflict of interest
No conflict of interest was declared by the authors.
References
- 1.Carmina E, Lobo RA. Do hyperandrogenic women with normal menses have polycystic ovary syndrome? Fertil Steril. 1999;71:319–22. doi: 10.1016/s0015-0282(98)00455-5. [DOI] [PubMed] [Google Scholar]
- 2.Wild RA, Painter PC, Coulson PB, Carruth KB, Ranney GB. Lipoprotein lipid concentrations and cardiovascular risk in women with polycystic ovary syndrome. J Clin End Met. 1985;61:946–51. doi: 10.1210/jcem-61-5-946. [DOI] [PubMed] [Google Scholar]
- 3.Hopkinson EC, Satar N, Fleming R, Greer IA. Polycsytic ovary syndrome: the metabolic syndrome comes to gynecology. BMJ. 1998;317:329–32. doi: 10.1136/bmj.317.7154.329. [DOI] [PMC free article] [PubMed] [Google Scholar]
- 4.Cook GM. Techniques for the analysis of membrane carbohydrates. In: Maddy AH, editor. Biochemical analysis of membranes. 1st ed. London: Wiley & Sons; 1976. pp. 287–92. [Google Scholar]
- 5.Schauer R. Chemistry, metabolism and biological function of sialic acids. Adv Carbohydr Chem Biochem. 1982;40:131–234. doi: 10.1016/s0065-2318(08)60109-2. [DOI] [PubMed] [Google Scholar]
- 6.Succari M, Foglietti MJ, Percheron F. Perchlorosoluble glycoproteins and myocardial infarct: modifications of the carbohydrate moiety. Pathol Biol (Paris) 1982;30:151–4. [PubMed] [Google Scholar]
- 7.Tomino Y, Inoue W, Yagame M, Nomoto Y, Sakai H, Ito K, et al. Measurement of sialic acid and acute phase reactant proteins in sera of patients with diabetic nephropathy. J Diabet Complications. 1988;2:75–8. doi: 10.1016/s0891-6632(88)80004-7. [DOI] [PubMed] [Google Scholar]
- 8.Taniuchi K, Chifu K, Hayashi N, Nakamachi Y, Yamaguchi N, Miyamoto Y, et al. A new enzymatic method for the determination of sialic acid in serum and its application for a marker of acute phase reactants. Kobe J Med Sci. 1981;27:91–102. [PubMed] [Google Scholar]
- 9.Stryer L. Biochemistry. 3rd ed. W H Freeman and Co; New York: 1988. [Google Scholar]
- 10.Rotterdam ESHRE/ASRM-Sponsored PCOS consensus workshop group. Revised 2003 consensus on diagnostic criteria and long-term health risks related to polycystic ovary syndrome (PCOS) Hum Reprod. 2004;19:41–7. doi: 10.1093/humrep/deh098. [DOI] [PubMed] [Google Scholar]
- 11.Katopodis N, Hirshaut Y, Geller NL, Stock CC. Lipid-associated sialic acid test for the detection of human cancer. Cancer Res. 1982;42:5270–5. [PubMed] [Google Scholar]
- 12.Plucinsky MC, Riley WM, Prorok JJ, Alhadeff JA. Total and lipid-associated serum sialic acid levels in cancer patients with different primary sites and differing degrees of metastatic involvement. Cancer. 1986;58:2680–5. doi: 10.1002/1097-0142(19861215)58:12<2680::aid-cncr2820581222>3.0.co;2-l. [DOI] [PubMed] [Google Scholar]
- 13.Lindberg G, Ecklund GA, Gullberg B, Rastam L. Serum sialic acid concentration and cardiovascular mortality. BMJ. 1991;302:143–6. doi: 10.1136/bmj.302.6769.143. [DOI] [PMC free article] [PubMed] [Google Scholar]
- 14.Crook MA, Treloar A, Haq M, Tutt P. Serum sialic acid and acute phase proteins in elderly subjects. Eur J Clin Chem Clin Biochem. 1994;32:745–7. doi: 10.1515/cclm.1994.32.10.745. [DOI] [PubMed] [Google Scholar]
- 15.Bickerton AS, Clark N, Meeking D, Shaw KM, Crook M, Lumb P, et al. Cardiovascular risk in women with polycystic ovarian syndrome (PCOS) J Clin Pathol. 2005;58:151–4. doi: 10.1136/jcp.2003.015271. [DOI] [PMC free article] [PubMed] [Google Scholar]
- 16.Hag M, Hag S, Tutt P. Serum total sialic acid and lipid-associated sialic acid in normal individuals and patients with myocardial infarction and their relationship to acute phase proteins. Ann Clin Biochem. 1993;30:383–6. doi: 10.1177/000456329303000406. [DOI] [PubMed] [Google Scholar]
- 17.Hangloo VK, Kaul I, Zargar HU. Serum sialic acid levels in healthy individuals. J Postgrad Med. 1990;36:140–2. [PubMed] [Google Scholar]
- 18.Pönniö M, Alho H, Nikkari ST, Olsson U, Rydeberg U, Sillanaukee P. Serum sialic acid in a random sample of the general population. Clin Chem. 1999;45:1842–9. [PubMed] [Google Scholar]
- 19.Crook M, Lumb P, Andrews V, Swaminathan R. Serum total sialic acid, a reputed cardiovascular risk factor, and its reationship to lipids, plasma fasting insulin, blood pressure and body mass index in normal individuals. Clin Sci. 1998;95:53–7. doi: 10.1042/cs0950053. [DOI] [PubMed] [Google Scholar]
- 20.Lindberg G, Rastam L, Gullberg B, Eklund GA. Serum sialic acid concentration predicts both coronary heart disease and stroke mortality: multivariate analysis including 54 385 men and women during 20.5 years follow-up. Int J Epidemol. 1992;21:253–7. doi: 10.1093/ije/21.2.253. [DOI] [PubMed] [Google Scholar]
- 21.Meade TW, North WR, Chakrabarti R, Stirling Y, Haines AP, Thompson SG, et al. Haemostatic function and cardiovascular death: early results of a prospective study. Lancet. 1980;17:1050–4. doi: 10.1016/s0140-6736(80)91498-1. [DOI] [PubMed] [Google Scholar]
- 22.Witteman J, Grobbee D, Kok F, Valkenburg H. Increased risk of atherosclerosis in women after the menopause. BMJ. 1989;298:642–4. doi: 10.1136/bmj.298.6674.642. [DOI] [PMC free article] [PubMed] [Google Scholar]
- 23.Crook MA, Tutt P, Simpson H, Pickup JC. Serum sialic acid and acute phase proteins in type I and type II diabetes mellitus. Clin Chim Acta. 1993;219:131–8. doi: 10.1016/0009-8981(93)90204-h. [DOI] [PubMed] [Google Scholar]
- 24.Pickup JC, Mattock MB, Crook MA, Chusney GD, Burt D, Fitzgerald AP. Serum sialic acid concentration and coronary heart disease in NIDDM. Diabetes Care. 1995;18:1100–3. doi: 10.2337/diacare.18.8.1100. [DOI] [PubMed] [Google Scholar]
- 25.Flynn MD, Corrall RJ, Waters PJ, Pennock CA. Sialic acid and cardiovascular mortality. BMJ. 1991;302:533–4. doi: 10.1136/bmj.302.6775.533-c. [DOI] [PMC free article] [PubMed] [Google Scholar]
- 26.Gopaul KP, Crook MA. Sialic acid: a novel marker of cardiovascular disease? Clin Biochem. 2006;39:667–81. doi: 10.1016/j.clinbiochem.2006.02.010. [DOI] [PubMed] [Google Scholar]
- 27.Suer Gokmen S, Kazezoglu C, Sunar B, Ozcelik F, Gungor O, Yorulmaz F, et al. Relationship between serum sialic acids, sialic acid-rich inflammation-sensitive proteins and cell damage in patients with acute myocardial infarction. Clin Chem Lab Med. 2006;44:199–206. doi: 10.1515/CCLM.2006.037. [DOI] [PubMed] [Google Scholar]
- 28.Bickerton AS, Clark N, Meeking D, Shaw KM, Crook M, Lumb P, et al. Cardiovascular risk in women with polycystic ovarian syndrome (PCOS) J Clin Pathol. 2005;58:151–4. doi: 10.1136/jcp.2003.015271. [DOI] [PMC free article] [PubMed] [Google Scholar]
- 29.Kelly CC, Lyall H, Petrie JR, Gould GW, Connell JM, Sattar N. Low grade chronic inflammation women with polycystic ovarian syndrome. J Clin Endocrinol Metab. 2001;86:2453–6. doi: 10.1210/jcem.86.6.7580. [DOI] [PubMed] [Google Scholar]