

Abstract
Background
Chronic ethanol consumption coupled with folate deficiency leads to rapid liver fat accumulation and progression to alcoholic steatohepatitis (ASH). However, the specific effects of alcohol on key liver lipid metabolic pathways involved in fat accumulation are unknown. It is unclear whether lipid synthesis, lipid export, or a combination of both is contributing to hepatic steatosis in ASH.
Methods
In this study we estimated the flux of fatty acids (FA) through the stearoyl-CoA desaturase (SCD), phosphatidylethanolamine-N-methyltransferase (PEMT), and fatty acid elongation pathways in relation to liver triacylglycerol (TG) content in Yucatan micropigs fed a 40% ethanol folate deficient diet with or without supplementation with S-adenosyl methionine (SAM) compared with controls. Flux through the SCD and PEMT pathways was used to assess the contribution of lipid synthesis and lipid export respectively on the accumulation of fat in the liver. Liver FA composition within TG, cholesterol ester (CE), phosphatidylethanolamine (PE), and phosphatidylcholine (PC) classes was quantified by gas chromatography.
Results
Alcoholic pigs had increased liver TG content relative to controls, accompanied by increased flux through the SCD pathway as indicated by increases in the ratios of 16:1n7 to 16:0 and 18:1n9 to 18:0. Conversely, flux through the elongation and PEMT pathways was suppressed by alcohol, as indicated by multiple metabolite ratios. SAM supplementation attenuated the TG accumulation associated with alcohol.
Conclusions
These data provide an in vivo examination of liver lipid metabolic pathways confirming that both increased de novo lipogenesis (e.g. lipid synthesis) and altered phospholipid metabolism (e.g. lipid export) contribute to the excessive accumulation of lipids in liver affected by ASH.
Keywords: Alcoholic steatohepatitis, Lipid metabolism, Pathway flux analysis, Targeted metabolomics, Quantitative lipid profiling
Introduction
Although steatosis is usually benign in its earliest stages, simple steatosis can progress to steatohepatitis, which is associated with inflammation, hepatocyte damage, and further complications including fibrosis, cirrhosis, and liver cancer (Brunt, 2002). Excessive alcohol consumption leads to ASH (Adachi and Brenner, 2005) which is one of the main causes of end-stage liver disease worldwide. In the United States, alcohol-related liver disease is the second most common cause of liver transplantation (Mandayam et al., 2004).
The micropig is a suitable model of ASH due to the propensity to develop alcoholism and liver injury spontaneously with voluntary ethanol consumption, and has been shown to develop fibrosis and inflammation, as well as other histological and biochemical markers of alcoholic liver disease over 12 months of ethanol consumption (Esfandiari et al., 2005; Esfandiari et al., 2007; Niemela et al., 1999; Niemela et al., 1995; Parkkila et al., 1999; Villanueva et al., 1994; Villanueva et al., 2006). Disturbances in lipid status and metabolism were found in this model, including reduction in the activity of key lipid metabolic enzymes such as delta-5 and delta-6 desaturase (Nakamura et al., 1994), as well as changes in the metabolism of SAM and related metabolites (Halsted et al., 2002c; Villanueva et al., 2001). A role for aberrant folate dependent methionine metabolism in the pathogenesis of ASH was shown by acceleration of histopathology by the inclusion of folate deficiency with ethanol feeding of micropigs (Esfandiari et al.; Halsted et al., 2002b) and the finding that ASH could be prevented in ethanol fed micropigs by supplementation of the diet with SAM (Esfandiari et al.; Villanueva et al.).
Steatosis, or the accumulation of lipid in the liver, is regulated by multiple metabolic pathways. Transport of TG out of the liver via lipoprotein synthesis and secretion is regulated by sterol regulatory element binding protein (SREBP) and liver X receptor activation (Grefhorst et al., 2002; Lin et al., 2005). De novo lipogenesis, or the synthesis of FA and their incorporation into TG and CE is also regulated by SREBP and liver X receptor, and is additionally induced by carbohydrate feeding (Chong et al., 2008; McDevitt et al., 2001). The regulation of FA import via FA binding proteins is not well understood, however there is some indication that the expression of certain FA binding proteins is associated with insulin resistance (Gertow et al., 2006; Maeda et al., 2003). FA oxidation is regulated by the peroxisome proliferator-activated receptors, particularly peroxisome proliferator-activated receptor-α (Ferre, 2004; Yu et al., 2003). Steatosis in ASH could be related to decreased transport via VLDL and/or increased lipogenesis, increased import of FA from periphery, or decreased FA oxidation.
One of the main functions of SAM is its role as a methyl donor in the PEMT reaction for conversion of PE to PC, which is required for the subsequent synthesis and secretion of VLDL by the liver (Vance and Vance, 1985; Yao and Vance, 1988) (Figure 1). The primary mechanism for 70% of PC synthesis in the liver is the de novo or cytidine 5′-diphosphocholine pathway, in which diacylglycerol (DG) and cytidine 5′-diphospho-choline are combined to produce PC and cytidine 5′-monophosphate by cholinephospho-transferase (McMaster and Bell, 1997). The other 30% of PC is synthesized via the PEMT pathway, in which PE is sequentially methylated by SAM to yield PC (Vance and Ridgway, 1988). Watkins et al. (Watkins et al., 2003) showed in male PEMT homozygous-deficient mice that PEMT deficiency contributed to fat accumulation in the liver, and that this was associated with compositional changes in plasma VLDL FA. Specifically, in plasma PC of PEMT deficient mice there was a decrease in stearic acid (18:0), docosahexaenoic acid (22:6n3), and arachidonic acid (20:4n6) with a concomitant increase in linoleic acid (18:2n6). These findings confirm those of kinetic studies with labeled choline and ethanolamine that show the preferential incorporation of 18:0, 20:4n6, and 22:6n3 into PC synthesized via the PEMT pathway (Reo et al., 2002).
Figure 1. Biochemical pathways of lipid import and export in the liver.
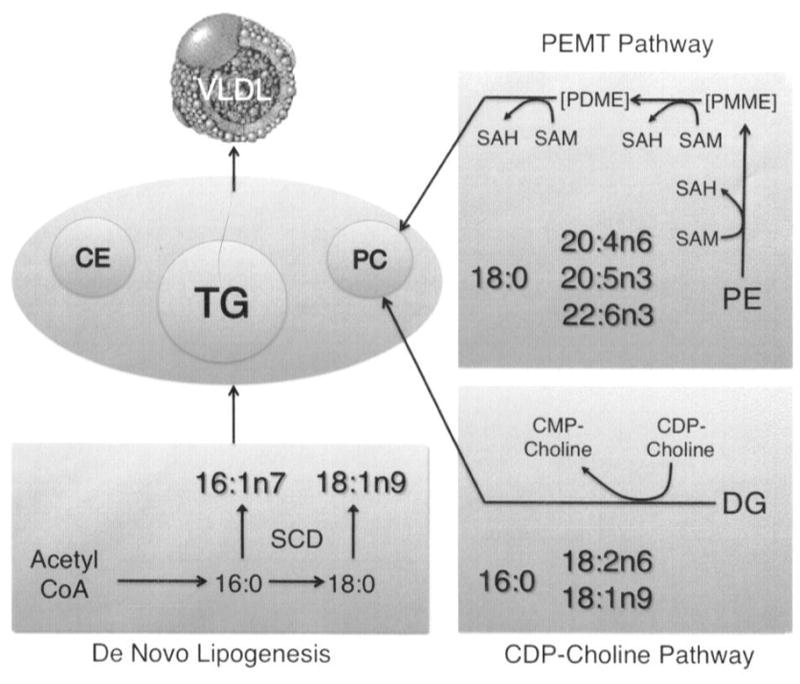
Shown are key pathways involved in lipid import (e.g. de novo lipogenesis) and lipid export (e.g. phosphatidylcholine (PC) synthesis pathways: cytidine 5′-diphospho (CDP)-choline pathway, and phosphatidylethanolamine-N-methyltransferase (PEMT) pathway). De novo lipogenesis induction includes the induction of stearoyl-CoA desaturase (SCD), the enzyme that desaturates 16:0 and 18:0 at the Δ9 position in the acyl chain to produce 16:1n7 and 18:1n9 respectively. 16:1n7 and 18:1n9, in turn, are incorporated into cholesterol esters (CE), triacylglycerols (TG), and phospholipids. The PEMT pathway involves the sequential methylation of phosphatidylethanolamine (PE) to phosphatidylmonomethylethanolamine (PMME), phosphatidyldimethylethanolamine (PDME), and finally to PC by S-adenosyl methionine (SAM) which is converted to S-adenosylhomocysteine (SAH) in the process. The CDP-choline pathway involves the conversion of diacylglycerol (DG) to PC by incorporation of CDP-choline, which is converted to cytidine 5′-monophospho (CMP)-choline in the process. The fatty acids 18:0, 20:4n6, 20:5n3, and 22:6n3 are preferentially incorporated into PC synthesized via the PEMT pathway, and a relative increase in these fatty acids indicates a relative increase in flux through the PEMT pathway. The fatty acids 16:0, 18:2n6, and 18:1n9 are preferentially incorporated into PC synthesized via the CDP-choline pathway, and a relative increase in these fatty acids indicates a relative increase in flux through the CDP-choline pathway.
In the liver SAM is converted to S-adenosylhomocysteine (SAH) by donating its methyl moiety in a process mediated by methyltransferases including PEMT. SAH is a potent inhibitor of methyltransferases, and the ratio of SAM to SAH is an indicator of methylation capacity (Mudd et al., 1980). The effects of ethanol feeding and SAM supplementation were also examined in the livers of alcoholic pigs (Esfandiari et al., 2007). In this experiment, in which all pigs were fed folate deficient diets in order to maximize potential alcohol effects (Halsted et al., 2002a) alcohol-treated pigs had 1.5-fold lower levels of SAM, 1.6-fold higher levels of SAH and a 2.5-fold lower SAM to SAH ratio than found in pigs fed control diets without ethanol. The animals treated with alcohol and supplemented with SAM, on the other hand, had intermediate levels of SAM and SAH, with significant improvement in the SAM to SAH ratio that was 1.3-fold higher than alcohol-treated animals without SAM. SAM supplementation attenuated the increase in liver fat accumulation leading to steatosis that was induced by ethanol feeding. However, the specific effects of these changes in methylation on the flux of metabolites through the PEMT pathway were not quantified.
Ethanol consumption induces de novo lipogenesis from excess acetyl-CoA generated by the breakdown of ethanol. Lipogenesis is regulated by SREBP proteins, particularly SREBP-1c, which activates FA and TG synthesis (You and Crabb, 2004). SREBP-1c target genes include acetyl-CoA carboxylase, fatty acid synthase, glycerol-3-phosphate acyltransferase, and SCD. SCD desaturates FA at the Δ9 position in the acyl chain, converting 16:0 to 16:1n7 and 18:0 to 18:1n9, thus the product to substrate ratios 16:1n7/16:0 and 18:1n9/18:0 are indicators of flux through the SCD pathway and of de novo lipogenesis. The use of the product to substrate ratio, or desaturase index (DI), as an estimate of SCD activity is well established (Chong et al., 2008; Petersson et al., 2008; Riserus et al., 2005; Sjogren et al., 2008; Steffen et al., 2008; Warensjo et al., 2006; Warensjo et al., 2008a; Warensjo et al., 2008b). The SCD DI is positively associated with cardiovascular mortality (Warensjo et al., 2008b), insulin resistance (Sjogren et al., 2008), and inflammation (Petersson et al., 2008).
SCD is a key enzyme in the regulation of energetics and metabolism (Dobrzyn and Ntambi, 2005). SCD deficiency was associated with increased FA β-oxidation in muscle (Dobrzyn et al., 2005) and in liver (Dobrzyn et al., 2004), increased insulin signaling and glycogen metabolism in the adipose (Rahman et al., 2005), and reduced liver steatosis (Miyazaki et al., 2004). Ethanol feeding of micropigs increased the hepatic expression of SREBP-1c and its target genes acetyl-CoA carboxylase, fatty acid synthase, and glycerol-3-phosphate acyltransferase, but the increase in SCD expression did not reach statistical significance (Esfandiari et al., 2007). In other studies, ethanol consumption decreased SCD activity in rats (Venkatesan et al., 1990), and Hep G2 human hepatoma cells (Angeletti and de Alaniz, 1996). It is unclear how chronic ethanol feeding modifies FA flux through the SCD pathway.
The aim of the present study was to measure the effects of ethanol feeding combined with folate deficiency on the metabolism of lipids in the liver and its potential modulation by supplementation of the diet with SAM. Using liver samples from our recent study (Esfandiari et al.), we estimated the flux of FA through the SCD pathway by using the DI as well as single metabolite concentrations in order to determine whether this pathway is associated with increased de novo lipogenesis in our pig model (Fig. 1). Also, we estimated the flux of FA through the PEMT pathway to determine the combined impact of ethanol feeding and folate deficiency with and without SAM supplementation on the synthesis of PC via the PEMT pathway for export of lipids from the liver (Fig. 1). In addition, we examined fluxes through selected FA elongation pathways to examine the potential additional impacts of chronic alcohol consumption on FA metabolism. Thus, in this study we provide an in vivo examination of liver lipid metabolic pathways in ASH.
Materials and Methods
Animal Model
The development of the micropig model of ASH and its modification with dietary folate deficiency was described previously in detail (Halsted et al., 2002c). Briefly, 6-month–old male Yucatan micropigs, 20 to 40 kg in size, were pair fed diets in which ethanol was substituted for carbohydrate at 40% of daily energy needs, with fat in the form of corn oil at 30%, carbohydrate in the form of corn starch at 15%, and protein at 15% of kcal. The control animals received the same diet minus the ethanol, providing instead 55% carbohydrate as corn starch. Peak blood ethanol levels exceeding 200 mg/dL and rises in aspartate aminotransferase and alanine aminotransferase were observed within 3 months, whereas histological findings of steatosis, inflammation, and fibrosis were observed by 6 months.
In contrast to our original model (Halsted et al., 1993), we found that administering a folate-deficient diet with the ethanol accelerated the development of ASH from 12 mo to 3 months (Halsted et al., 1993). Folate deficiency is frequent in chronic alcohol drinkers, and is the most common vitamin deficiency in patients with alcoholic liver disease (Leevy et al., 1965). Chronic alcoholics are also prone to intestinal folate malabsorption (Halsted, 1971; Halsted, 1973). The present study used frozen liver specimens from our published study on the effect of SAM supplementation in prevention of ASH in micropigs fed ethanol with folate deficient diets (Esfandiari et al., 2007). Liver specimens from 9 animals were examined 3 in each of the three treatment groups, all of which were placed on folate-depleted diets for 12 weeks, including A) alcohol at 40% of kCal, AS) alcohol + SAM at 0.4 g/1000 Cal, and C) control. Except for dietary folate, all essential micronutrients were provided to meet known requirements for swine. Diets were provided as three equal meals per day. The pigs were housed and cared for according to standards and procedures approved by the Institutional Animal Care and Use Committee of the University of California Davis. Liver samples were obtained after termination at 14 weeks and were immediately frozen at −70°C for lipid analysis.
Lipid Analysis
Quantitative lipid analysis was performed according to Watkins et al. (Watkins et al., 2002). Briefly, liver tissue was homogenized, and lipids were extracted in the presence of authentic internal standards by the method of Folch et al. (Folch, 1957) using chloroform-methanol (2:1, v/v). The internal standards used were: TG17:1, DG17:1, PC17:0, PE17:0, FFA15:1, and CE17:0. Individual lipid classes –TG, DG, CE, FA, PC, and PE –were separated by thin layer chromatography. Each isolated lipid class fraction was trans-esterified in 3N methanolic-HCl. The resulting FA methyl esters were separated and quantified by capillary gas chromatography using a gas chromatograph (Hewlett-Packard model 6890, Wilmington, DE) equipped with a 30 m DB-225MS capillary column (J&W Scientific, Folsom, CA) and a flame-ionization detector. The following FA were quantified: 16:0, 16:1n7, 18:0, 18:1n7, 18:1n9, 18:2n6, 18:3n3, 18:3n6, 20:0, 20:1n9, 20:2n6, 20:3n3, 20:3n6, 20:4n6, 20:5n3, 22:0, 22:1n9, 22:2n6, 22:4n6, 22:5n3, 22:6n3, 24:0, and 24:1n9. The total liver TG content of the three groups was compared to confirm that the pigs in the alcohol (A) group had higher levels of fat accumulation than controls, and to ascertain whether SAM supplementation attenuated steatosis.
SCD and PEMT flux measurements
The lipid composition of separated lipid classes was analyzed for markers of de novo lipogenesis that included SCD and elongase, and for markers of PEMT. SCD markers included the monounsaturated fatty acids 16:1n7 and 18:1n9, which are increased in animal models of obesity and diabetes (Wang et al., 2006), and the ratios of 16:1n7/16:0 and 18:1n9/18:0, which are well-established markers of desaturase activity. Elongase markers included the metabolites 18:1n7, 22:1n9, 24:1n9, 20:2n6, 20:3n6, 22:0, 24:0, 22:5n3, and flux was measured as the ratios of products to substrates: 18:1n7/16:1n7, 20:1n9/18:1n9, 22:1n9/20:1n9, 20:0/18:0, 22:0/20:0, 24:0/22:0, 20:3n6/18:3n6, 20:2n6/18:2n6, 20:3n3/18:3n3, and 22:5n3/20:5n3. PEMT fluxes were measured according to the ratios 18:0/16:0, 20:4n6/18:2n6, 22:6n3/18:1n9, 22:6n3/18:2n6, and 20:4n6/18:1n9, and the levels of the metabolites 18:0, 20:4n6, 22:6n3 within PC and PE.
Data Analysis and Statistics
Lipid class totals are presented as mg/g liver tissue. FA are presented as mol % for each lipid class (mg FA/total mg of all FA within lipid class) in Table 1 and as absolute concentrations (mg FA/g sample) in Table 2. One-way ANOVA was used to assess statistical significance for each metabolite. All pairwise comparisons among levels of groups were conducted with Tukey 95% simultaneous confidence intervals with individual confidence level = 97.80%. All confidence intervals were conducted based on pooled standard deviations.
Table 1.
Markers of hepatic lipid import and export
| Group: * | A | AS | C | P-value ANOVA | |
|---|---|---|---|---|---|
| SCD Markers
| |||||
| 16:1n7/16:0 | PC | 0.016 ± 0.001a | 0.012 ± 0.003ab | 0.006 ± 0.005b | 0.026 |
| PE | 0.027 ± 0.000a | 0.012 ± 0.003b | 0.012 ± 0.002b | 0.004 | |
| 18:1n9/18:0 | PC | 0.19 ± 0.003ba | 0.22 ± 0.036a | 0.12 ± 0.01b | 0.035 |
| TG | 1.98 ± 0.51a | 0.70 ± 0.21ab | 0.58 ± 0.06b | 0.038 | |
|
| |||||
| Elongase Markers
| |||||
| 18:1n7/16:1n7 | PC | 4.75 ± 1.17b | 9.81 ± 4.21b | 23.32 ± 2.13a | 0.009 |
| 18:1n7 | PE | 0.46 ± 0.11 | 0.69 ± 0.11 | 1.02 ± 0.11 | 0.026 |
| 20:0/18:0 | TG | 0.018 ± 0.001b | 0.023 ± 0.005b | 0.030 ± 0.003a | 0.005 |
| 20:1n9/18:1n9 | PC | 0.014 ± 0.002b | 0.013 ± 0.002b | 0.026 ± 0.001a | 0.004 |
| PE | 0.024 ± 0.001ab | 0.020 ± 0.002b | 0.030 ± 0.003a | 0.025 | |
| 20:3n3/18:3n3 | PC | 0.25 ± 0.13b | 0.30 ± 0.05b | 0.95 ± 0.10a | 0.004 |
| PE | 0.22 ± 0.06b | 0.20 ± 0.04b | 0.50 ± 0.07a | 0.018 | |
| 22:0/20:0 | TG | 0.34 ± 0.01b | 0.41 ± 0.06b | 0.59 ± 0.04a | 0.010 |
| 22:0 | TG | 0.05 ± 0.01b | 0.09 ± 0.01ab | 0.14 ± 0.01a | 0.007 |
| 24:0 | CE | 0.34 ± 0.26 | 0.27 ± 0.26 | 1.40 ± 0.26 | 0.040 |
| 20:2n6 | PE | 0.78 ± 0.14ab | 0.75 ± 0.14b | 1.35 ± 0.14a | 0.035 |
| 20:3n6 | PC | 1.53 ± 0.16 | 0.94 ± 0.16 | 0.89 ± 0.16 | 0.048 |
| TG | 1.02 ± 0.16b | 1.34 ± 0.16ab | 1.95 ± 0.16a | 0.018 | |
| 22:5n3/20:5n3 | PE | 1.98 ± 0.48b | 2.56 ± 0.41b | 5.08 ± 0.45a | 0.006 |
| 22:5n3 | CE | 1.96 ± 0.88ab | 1.11 ± 0.88b | 5.75 ± 0.88a | 0.021 |
| TG | 0.50 ± 0.03a | 0.46 ± 0.03a | 0.33 ± 0.03b | 0.012 | |
|
| |||||
| PEMT Markers
| |||||
| 18:0 | PC | 33.82 ± 0.49 | 32.90 ± 1.79 | 37.74 ± 1.17 | 0.075 |
| PE | 41.89 ± 0.49b | 38.23 ± 1.22ba | 35.53 ± 0.7a | 0.006 | |
| 18:0/16:0 | PC | 3.72 ± 0.39ba | 3.28 ± 0.692a | 5.68 ± 0.465b | 0.040 |
| PE | 17.25 ± 1.89b | 8.98 ± 0.82a | 8.07 ± 0.92a | 0.005 | |
Values are presented as mol % (mg FA/total mg of all FA within lipid class) for individual fatty acids (FA). Values represent means ± SEM for each metabolite/ratio within each lipid class within each group: A) alcohol, AS) alcohol + S-adenosyl methionine, C) control.
Means within each ratio/marker not joined by the same symbol were significantly different by post-hoc analysis (Tukey-Kramer). PC: phosphaptidylcholine; PE: phosphatidylethanolamine; TG: triacylglycerol; CE: cholesteryl ester.
Table 2.
Absolute concentrations of key fatty acids
| Group:* | A | AS | C | |
|---|---|---|---|---|
|
| ||||
| Lipid Class | FA | Mean ± SEM | Mean ± SEM | Mean ± SEM |
| PC | 16:0 | 2.18 ± 0.40 | 2.91 ± 1.02 | 1.36 ± 0.05 |
| 16:1n7 | 0.04 ± 0.01 | 0.04 ± 0.02 | 0.01 ± 0.001 | |
| 18:0 | 7.81 ± 0.57 | 8.41 ± 1.57 | 7.74 ± 0.67 | |
| 18:1n7 | 0.15 ± 0.02 | 0.24 ± 0.03 | 0.19 ± 0.01 | |
| 18:1n9 | 1.52 ± 0.13 | 1.93 ± 0.62 | 0.89 ± 0.05 | |
| 18:3n3 | 0.14 ± 0.02 | 0.15 ± 0.05 | 0.04 ± 0.005 | |
| 20:1n9 | 0.02 ± 0.004 | 0.02 ± 0.003 | 0.02 ± 0.001 | |
| 20:3n3 | 0.03 ± 0.01 | 0.04 ± 0.004 | 0.04 ± 0.01 | |
| 20:3n6 | 0.36 ± 0.07 | 0.24 ± 0.04 | 0.18 ± 0.02 | |
| Total | 23.17 ± 2.03 | 25.98 ± 5.86 | 20.47 ± 1.30 | |
|
| ||||
| PE | 16:0 | 0.12 ± 0.02 | 0.30 ± 0.15 | 0.18 ± 0.02 |
| 16:1n7 | 0.003 ± 0.0005 | 0.003 ± 0.001 | 0.002 ± 0.0001 | |
| 18:0 | 2.06 ± 0.06 | 2.61 ± 1.26 | 1.41 ± 0.25 | |
| 18:1n7 | 0.02 ± 0.004 | 0.05 ± 0.03 | 0.04 ± 0.005 | |
| 18:1n9 | 0.23 ± 0.02 | 0.35 ± 0.17 | 0.24 ± 0.03 | |
| 18:3n3 | 0.03 ± 0.002 | 0.04 ± 0.02 | 0.02 ± 0.002 | |
| 20:1n9 | 0.01 ± 0.001 | 0.01 ± 0.004 | 0.01 ± 0.001 | |
| 20:2n6 | 0.04 ± 0.01 | 0.06 ± 0.03 | 0.05 ± 0.01 | |
| 20:3n3 | 0.01 ± 0.001 | 0.01 ± 0.01 | 0.01 ± 0.002 | |
| 20:5n3 | 0.02 ± 0.003 | 0.04 ± 0.03 | 0.01 ± 0.002 | |
| 22:5n3 | 0.03 ± 0.004 | 0.10 ± 0.07 | 0.03 ± 0.01 | |
| Total | 3.49 ± 0.14 | 5.21 ± 2.69 | 2.56 ± 0.49 | |
|
| ||||
| TG | 18:0 | 0.17 ± 0.004 | 0.12 ± 0.04 | 0.08 ± 0.01 |
| 18:1n9 | 0.45 ± 0.02 | 0.25 ± 0.07 | 0.21 ± 0.03 | |
| 20:0 | 0.003 ± 0.0002 | 0.003 ± 0.001 | 0.002 ± 0.0002 | |
| 20:3n6 | 0.02 ± 0.001 | 0.01 ± 0.003 | 0.02 ± 0.002 | |
| 22:0 | 0.001 ± 0.0001 | 0.001 ± 0.0002 | 0.001 ± 0.0001 | |
| 22:5n3 | 0.01 ± 0.0004 | 0.01 ± 0.001 | 0.003 ± 0.00003 | |
| Total | 2.27 ± 0.05 | 1.13 ± 0.31 | 1.06 ± 0.13 | |
|
| ||||
| CE | 22:5n3 | 0.01 ± 0.002 | 0.005 ± 0.002 | 0.02 ± 0.01 |
| 24:0 | 0.001 ± 0.001 | 0.001 ± 0.0001 | 0.01 ± 0.002 | |
| Total | 0.46 ± 0.07 | 0.49 ± 0.002 | 0.44 ± 0.03 | |
Fatty acid (FA) values are presented as mg FA/g sample, and total lipid classes are presented as mg lipid class/g sample. Values represent means ± SEM for each metabolite within each lipid class within each group: A) alcohol, AS) alcohol + S-adenosyl methionine, C) control. PC: phosphaptidylcholine; PE: phosphatidylethanolamine; TG: triacylglycerol; CE: cholesteryl ester.
Results
The liver TG concentrations in each group (mean ± SE) were: A) 2.27 ± 0.05; AS) 1.13 ± 0.31; and C) 1.06 ± 0.13 mg TG/g tissue, and were significantly different when assessed by ANOVA (p=0.008), with the A group significantly (2-fold) higher than both AS and C by post-hoc analysis.
The significant SCD and elongase markers are listed in Table 1. The absolute concentrations of each of the key metabolites found to be significant as individual markers and as ratios are shown in Table 2. Among the SCD flux ratios in each lipid class, 16:1n7/16:0-PC, 16:1n7/16:0-PE, and 18:1n9/18:0-TG were significantly lower in control group livers compared with results from livers of alcoholic micropigs, and values in AS animals were intermediate between the two. The 18:1n9/18:0-PC ratio was lower in controls but not significantly different from alcoholic animals by post-hoc analysis. The 18:1/9/18:0-TG ratio was elevated in group A and intermediate in group AS compared to the control group.
On the other hand, opposite effects were found among elongase flux ratios 18:1n7/16:1n7-PC, 20:0/18:0-TG, 20:1n9/18:1n9-PC, 20:3n3/18:3n3-PC and -PE, 22:0/20:0-TG, 22:0-TG, 20:3n6-TG, 22:5n3-TG, and 22:5n3/20:5n3-PE were significantly higher in controls than in alcoholic animals, and 18:1n7/16:1n7-PE, 20:1n9/18:1n9-PE, 24:0-CE, 20:2n6-PC, and 22:5n3-CE were higher but not significantly different between controls and alcoholic animals by post-hoc analysis. The AS group was intermediate or lower than A. This suggests that in the alcohol group, the elongase pathway was suppressed whereas SCD was activated, relative to the control animals.
The significant markers of PEMT are also shown in Table 1. 18:0 and 18:0/16:0 were higher in controls compared to alcoholic animals in PC, though these differences were not statistically significant by post-hoc analysis, whereas in the AS animals 18:0/16:0 was significantly lower than in control animals. In the PE lipid class the reverse was true: controls were significantly lower than alcoholic animals in 18:0 and 18:0/16:0, and non-significantly lower in 20:4n6/18:2n6 (data not shown), with AS animals also significantly lower than alcoholic animals. This would suggest a higher flux through the PEMT pathway in controls, with the precursor pool (PE) depleting and the product pool (PC) enriching in the FA that are preferentially transferred through this pathway.
Discussion
Our findings indicate that differences in flux through specific lipid metabolic pathways in the liver were discernible through quantitative lipid profiling. We show that indicators of flux through the SCD pathway were higher in the alcohol group versus controls, and that SAM supplemented animals were intermediate between the two, suggesting a partial attenuation of the effect of alcohol on lipogenesis. However, prior analysis showed that neither ethanol feeding nor SAM supplementation influenced SCD expression in these animals (Esfandiari et al., 2007). Thus, post-translational modification or other forms of metabolic regulation associated with SAM supplementation and ethanol feeding may be involved in the induction of de novo lipogenesis and the SCD pathway.
The use of product to precursor ratios to estimate enzyme activity is well established in the literature. The DI is a particularly well-established marker of enzyme activity and has been shown to independently predict cardiovascular mortality, insulin resistance, and inflammation in large prospective studies (Petersson et al., 2008; Sjogren et al., 2008; Warensjo et al., 2008b). SCD enzyme activity was found to correlate with DI in an animal model (Mainieri et al., 2006).
We observed increased 18:1n9/18:0 and 16:1n7/16:0 in alcoholic animals and suggest that this implies increased flux through the SCD pathway, which assumes that the substrate specificity of downstream enzymes does not change according to phenotype. If the substrate specificity of the downstream enzyme DG acyltransferase, for example, changes in response to alcohol feeding, then it is possible that the observed increases in 18:1n9/18:0 and 16:1n7/16:0 in the TG lipid class result from this change in substrate specificity rather than from increased flux through the SCD pathway. However, there is no evidence, to our knowledge, that the specificity of enzymes such as DG acyltransferase changes in response to phenotype. On the other hand, confocal microscopy, coimmunoprecipitation, and fluorescence resonance energy transfer experiments in vitro show that SCD and DG acyltransferase colocalize, providing evidence for substrate channeling of newly synthesized MUFA for TG assembly (Man et al., 2006). There is also evidence that several different amino acid substitutions in the catalytic region of the glycerol-3 phosphate acyltransferase enzyme did not result in changes to substrate specificity despite significant changes in enzyme activity upwards of 90% (Dircks et al., 1999).
Conversely, indicators of flux through the elongase pathway were higher in controls than in alcoholic animals and in AS animals, suggesting that alcohol may suppress FA elongation and that SAM supplementation does not rescue this effect. Flux through the PEMT pathway was also suppressed in alcoholic animals, as indicated by the enrichment of PEMT indicators in the PE lipid class, and concomitant depletion of PEMT indicators in the PC lipid class relative to controls. These findings are in agreement with previous reports indicating that ethanol suppresses the activity of PEMT and that this suppression is associated with steatosis (Kharbanda et al., 2007; Lieber, 2000).
Our findings with regard to the effects of SAM supplementation on flux through the PEMT pathway are inconclusive. The original report showed that SAM supplementation increased the SAM to SAH ratio (Esfandiari et al., 2007). In the present study we found that SAM supplementation reduced the accumulation of the PEMT marker 18:0/16:0 in the PE lipid class to control levels, but that 18:0/16:0 in the PC lipid class did not increase in AS animals relative to controls. The marker 18:0/16:0 may also be a marker of elongation however, this marker differed significantly only in the PC and PE lipid classes, whereas we would expect to see differences also in TG and CE if the ratio were a marker of elongation. Another possibility is that the level of SAM supplementation did not fully attenuate the metabolic effects of folate deficiency combined with alcohol consumption in these animals and that instead of a complete conversion of PE to PC, there was an incomplete conversion to the intermediates phosphatidylmonomethyl-ethanolamine and phosphatidyldimethylethanolamine. Because we did not measure the levels of the mono- and dimethylethanolamines it is not possible to determine whether this was the reason for the observed lack of effect in the PC lipid class.
TG was higher in alcoholic animals than in controls and the effect of SAM supplementation was statistically significant in this study, consistent with our original report that measured TG in a larger number of animals (Esfandiari et al., 2007). It is possible that the intermediate phosphatidyldimethylethanolamine was partially able to substitute for the fully formed PC particle in VLDL synthesis and secretion, since it has been shown that phosphatidyldimethylethanolamine can partially correct for impaired VLDL secretion in cultured hepatocytes (Yao and Vance, 1988). However, because neither of the intermediates of the PEMT pathway were measured, it is not possible to determine whether the effect of SAM supplementation on liver TG had to do with the PEMT pathway, the partial attenuation of lipogenesis, or some other unknown mechanism.
Whether changes in DI, other product to substrate ratios, and single metabolite markers indicate quantitative changes in substrate flux through the respective pathways is not possible to determine without the use of labeled isotopes. Our data therefore cannot definitively prove changes in flux through the measured pathways in treated vs. control animals but rather provide reasonable estimates of these changes. In a multi-component system or biochemical pathway that is comprised of a sequence of individual reactions, only those reactions that show a change in the product to substrate ratio indicate a crossover point (Chance et al., 1958). These crossover point reactions display characteristic sensitivity to substrate and product concentrations, and act as points of regulation of flux through a pathway (Crabtree and Newsholme, 1978). Our data confirm previous findings that SCD (Dobrzyn and Ntambi, 2005) and PEMT (Vance and Vance, 1985) act as metabolic control points.
The present data in Yucatan micropigs suggest that chronic alcohol consumption increases flux through the SCD pathway, implicating the de novo lipogenesis of FA in the accumulation of fat in the liver. Conversely, alcohol’s suppressive effects on both FA elongation and the PEMT pathway may be involved in decreasing the ability of the liver to produce and secrete VLDL particles, thereby blocking the export of lipids from the liver.
Acknowledgments
This research was supported in part by: NIH AA RO-1 14545, the University of California Discovery Grant (05GEB01NHB), NIEHS Superfund grant P42 ES04699, the CHARGE study (P01 ES11269), and the following to AMZ: Graduate Group in Nutrition Block Grant, Jastro-Shields Scholarship, and Superfund Basic Research Program Training Fellowship.
Abbreviations
- ASH
alcoholic steatohepatitis
- FA
fatty acids
- SCD
stearoyl-CoA desaturase
- PEMT
phosphatidylethanolamine-N-methyltransferase
- TG
triacylglycerol
- SAM
S-adenosyl methionine
- CE
cholesterol esters
- PE
phosphatidylethanolamine
- PC
phosphatidylcholine
- SREBP
sterol regulatory element binding protein
- DG
diacylglycerol
- SAH
S-adenosylhomocysteine
- DI
desaturase index
References
- Adachi M, Brenner DA. Clinical syndromes of alcoholic liver disease. Dig Dis. 2005;23(3–4):255–63. doi: 10.1159/000090173. [DOI] [PubMed] [Google Scholar]
- Angeletti C, de Alaniz MJ. Effect of ethanol on glycerolipid and fatty acid metabolism in Hep G2 human-hepatoma cells. Acta Physiol Pharmacol Ther Latinoam. 1996;46(2):57–69. [PubMed] [Google Scholar]
- Brunt EM. Alcoholic and nonalcoholic steatohepatitis. Clin Liver Dis. 2002;6(2):399–420. vii. doi: 10.1016/s1089-3261(02)00002-8. [DOI] [PubMed] [Google Scholar]
- Chance B, Holmes W, Higgins J, Connelly CM. Localization of interaction sites in multi-component transfer systems: theorems derived from analogues. Nature. 1958;182(4644):1190–3. doi: 10.1038/1821190a0. [DOI] [PubMed] [Google Scholar]
- Chong MF, Hodson L, Bickerton AS, Roberts R, Neville M, Karpe F, Frayn KN, Fielding BA. Parallel activation of de novo lipogenesis and stearoyl-CoA desaturase activity after 3 d of high-carbohydrate feeding. Am J Clin Nutr. 2008;87(4):817–23. doi: 10.1093/ajcn/87.4.817. [DOI] [PubMed] [Google Scholar]
- Crabtree B, Newsholme EA. Sensitivity of a near-equilibrium reaction in a metabolic pathway to changes in substrate concentration. Eur J Biochem. 1978;89(1):19–22. doi: 10.1111/j.1432-1033.1978.tb20891.x. [DOI] [PubMed] [Google Scholar]
- Dircks LK, Ke J, Sul HS. A conserved seven amino acid stretch important for murine mitochondrial glycerol-3-phosphate acyltransferase activity. Significance of arginine 318 in catalysis. J Biol Chem. 1999;274(49):34728–34. doi: 10.1074/jbc.274.49.34728. [DOI] [PubMed] [Google Scholar]
- Dobrzyn A, Dobrzyn P, Lee SH, Miyazaki M, Cohen P, Asilmaz E, Hardie DG, Friedman JM, Ntambi JM. Stearoyl-CoA desaturase-1 deficiency reduces ceramide synthesis by downregulating serine palmitoyltransferase and increasing beta-oxidation in skeletal muscle. Am J Physiol Endocrinol Metab. 2005;288(3):E599–607. doi: 10.1152/ajpendo.00439.2004. [DOI] [PubMed] [Google Scholar]
- Dobrzyn A, Ntambi JM. The role of stearoyl-CoA desaturase in the control of metabolism. Prostaglandins Leukot Essent Fatty Acids. 2005;73(1):35–41. doi: 10.1016/j.plefa.2005.04.011. [DOI] [PubMed] [Google Scholar]
- Dobrzyn P, Dobrzyn A, Miyazaki M, Cohen P, Asilmaz E, Hardie DG, Friedman JM, Ntambi JM. Stearoyl-CoA desaturase 1 deficiency increases fatty acid oxidation by activating AMP-activated protein kinase in liver. Proc Natl Acad Sci U S A. 2004;101(17):6409–14. doi: 10.1073/pnas.0401627101. [DOI] [PMC free article] [PubMed] [Google Scholar]
- Esfandiari F, Villanueva JA, Wong DH, French SW, Halsted CH. Chronic ethanol feeding and folate deficiency activate hepatic endoplasmic reticulum stress pathway in micropigs. Am J Physiol Gastrointest Liver Physiol. 2005;289(1):G54–63. doi: 10.1152/ajpgi.00542.2004. [DOI] [PubMed] [Google Scholar]
- Esfandiari F, You M, Villanueva JA, Wong DH, French SW, Halsted CH. S-adenosylmethionine attenuates hepatic lipid synthesis in micropigs fed ethanol with a folate-deficient diet. Alcohol Clin Exp Res. 2007;31(7):1231–9. doi: 10.1111/j.1530-0277.2007.00407.x. [DOI] [PubMed] [Google Scholar]
- Ferre P. The biology of peroxisome proliferator-activated receptors: relationship with lipid metabolism and insulin sensitivity. Diabetes. 2004;53(Suppl 1):S43–50. doi: 10.2337/diabetes.53.2007.s43. [DOI] [PubMed] [Google Scholar]
- Folch J, Lees M, Sloane-Stanley GH. A simple method for the isolation and purification of total lipids from animal tissue. Journal of Biological Chemistry. 1957;226:497–509. [PubMed] [Google Scholar]
- Gertow K, Rosell M, Sjogren P, Eriksson P, Vessby B, de Faire U, Hamsten A, Hellenius ML, Fisher RM. Fatty acid handling protein expression in adipose tissue, fatty acid composition of adipose tissue and serum, and markers of insulin resistance. Eur J Clin Nutr. 2006;60(12):1406–13. doi: 10.1038/sj.ejcn.1602471. [DOI] [PubMed] [Google Scholar]
- Grefhorst A, Elzinga BM, Voshol PJ, Plosch T, Kok T, Bloks VW, van der Sluijs FH, Havekes LM, Romijn JA, Verkade HJ, Kuipers F. Stimulation of lipogenesis by pharmacological activation of the liver X receptor leads to production of large, triglyceride-rich very low density lipoprotein particles. J Biol Chem. 2002;277(37):34182–90. doi: 10.1074/jbc.M204887200. [DOI] [PubMed] [Google Scholar]
- Halsted CH, Villanueva J, Chandler CJ, Ruebner B, Munn RJ, Parkkila S, Niemela O. Centrilobular distribution of acetaldehyde and collagen in the ethanol-fed micropig. Hepatology. 1993;18(4):954–60. doi: 10.1002/hep.1840180429. [DOI] [PubMed] [Google Scholar]
- Halsted CH, Villanueva JA, Devlin AM. Folate deficiency, methionine metabolism, and alcoholic liver disease. Alcohol. 2002a;27(3):169–72. doi: 10.1016/s0741-8329(02)00225-2. [DOI] [PubMed] [Google Scholar]
- Halsted CH, Villanueva JA, Devlin AM, James SJ. Interactions of ethanol and folate deficiency in development of alcoholic liver disease in the micropig. Trans Am Clin Climatol Assoc. 2002b;113:151–62. discussion 162–3. [PMC free article] [PubMed] [Google Scholar]
- Halsted CH, Villanueva JA, Devlin AM, Niemela O, Parkkila S, Garrow TA, Wallock LM, Shigenaga MK, Melnyk S, James SJ. Folate deficiency disturbs hepatic methionine metabolism and promotes liver injury in the ethanol-fed micropig. Proc Natl Acad Sci U S A. 2002c;99(15):10072–7. doi: 10.1073/pnas.112336399. [DOI] [PMC free article] [PubMed] [Google Scholar]
- Halsted CH, EA, Mezey E. Decreased jejunal uptake of labeled folic acid (3 H-PGA) in alcoholic patients: roles of alcohol and nutrition. New England Journal of Medicine. 1971;285(13):701–6. doi: 10.1056/NEJM197109232851301. [DOI] [PubMed] [Google Scholar]
- Halsted CH, EA, Mezey E. Intestinal malabsorption in folate-deficient alcoholics. Gastroenterology. 1973;64(4):526–32. [PubMed] [Google Scholar]
- Kharbanda KK, Mailliard ME, Baldwin CR, Beckenhauer HC, Sorrell MF, Tuma DJ. Betaine attenuates alcoholic steatosis by restoring phosphatidylcholine generation via the phosphatidylethanolamine methyltransferase pathway. J Hepatol. 2007;46(2):314–21. doi: 10.1016/j.jhep.2006.08.024. [DOI] [PubMed] [Google Scholar]
- Leevy CM, Baker H, Tenhove W, Frank O, Cherrick GR. B-Complex Vitamins in Liver Disease of the Alcoholic. Am J Clin Nutr. 1965;16:339–46. doi: 10.1093/ajcn/16.4.339. [DOI] [PubMed] [Google Scholar]
- Lieber CS. Hepatic, metabolic, and nutritional disorders of alcoholism: from pathogenesis to therapy. Crit Rev Clin Lab Sci. 2000;37(6):551–84. doi: 10.1080/10408360091174312. [DOI] [PubMed] [Google Scholar]
- Lin J, Yang R, Tarr PT, Wu PH, Handschin C, Li S, Yang W, Pei L, Uldry M, Tontonoz P, Newgard CB, Spiegelman BM. Hyperlipidemic effects of dietary saturated fats mediated through PGC-1beta coactivation of SREBP. Cell. 2005;120(2):261–73. doi: 10.1016/j.cell.2004.11.043. [DOI] [PubMed] [Google Scholar]
- Maeda K, Uysal KT, Makowski L, Gorgun CZ, Atsumi G, Parker RA, Bruning J, Hertzel AV, Bernlohr DA, Hotamisligil GS. Role of the fatty acid binding protein mal1 in obesity and insulin resistance. Diabetes. 2003;52(2):300–7. doi: 10.2337/diabetes.52.2.300. [DOI] [PMC free article] [PubMed] [Google Scholar]
- Mainieri D, Summermatter S, Seydoux J, Montani JP, Rusconi S, Russell AP, Boss O, Buchala AJ, Dulloo AG. A role for skeletal muscle stearoyl-CoA desaturase 1 in control of thermogenesis. Faseb J. 2006;20(10):1751–3. doi: 10.1096/fj.06-5934fje. [DOI] [PubMed] [Google Scholar]
- Man WC, Miyazaki M, Chu K, Ntambi J. Colocalization of SCD1 and DGAT2: implying preference for endogenous monounsaturated fatty acids in triglyceride synthesis. J Lipid Res. 2006;47(9):1928–1939. doi: 10.1194/jlr.M600172-JLR200. [DOI] [PubMed] [Google Scholar]
- Mandayam S, Jamal MM, Morgan TR. Epidemiology of alcoholic liver disease. Semin Liver Dis. 2004;24(3):217–32. doi: 10.1055/s-2004-832936. [DOI] [PubMed] [Google Scholar]
- McDevitt RM, Bott SJ, Harding M, Coward WA, Bluck LJ, Prentice AM. De novo lipogenesis during controlled overfeeding with sucrose or glucose in lean and obese women. Am J Clin Nutr. 2001;74(6):737–46. doi: 10.1093/ajcn/74.6.737. [DOI] [PubMed] [Google Scholar]
- McMaster CR, Bell RM. CDP-choline:1,2-diacylglycerol cholinephosphotransferase. Biochim Biophys Acta. 1997;1348(1–2):100–10. doi: 10.1016/s0005-2760(97)00097-0. [DOI] [PubMed] [Google Scholar]
- Miyazaki M, Dobrzyn A, Sampath H, Lee SH, Man WC, Chu K, Peters JM, Gonzalez FJ, Ntambi JM. Reduced adiposity and liver steatosis by stearoyl-CoA desaturase deficiency are independent of peroxisome proliferator-activated receptor-alpha. J Biol Chem. 2004;279(33):35017–24. doi: 10.1074/jbc.M405327200. [DOI] [PubMed] [Google Scholar]
- Mudd SH, Ebert MH, Scriver CR. Labile methyl group balances in the human: the role of sarcosine. Metabolism. 1980;29(8):707–20. doi: 10.1016/0026-0495(80)90192-4. [DOI] [PubMed] [Google Scholar]
- Nakamura MT, Tang AB, Villanueva J, Halsted CH, Phinney SD. Selective reduction of delta 6 and delta 5 desaturase activities but not delta 9 desaturase in micropigs chronically fed ethanol. J Clin Invest. 1994;93(1):450–4. doi: 10.1172/JCI116981. [DOI] [PMC free article] [PubMed] [Google Scholar]
- Niemela O, Parkkila S, Pasanen M, Viitala K, Villanueva JA, Halsted CH. Induction of cytochrome P450 enzymes and generation of protein-aldehyde adducts are associated with sex-dependent sensitivity to alcohol-induced liver disease in micropigs. Hepatology. 1999;30(4):1011–7. doi: 10.1002/hep.510300413. [DOI] [PubMed] [Google Scholar]
- Niemela O, Parkkila S, Yla-Herttuala S, Villanueva J, Ruebner B, Halsted CH. Sequential acetaldehyde production, lipid peroxidation, and fibrogenesis in micropig model of alcohol-induced liver disease. Hepatology. 1995;22(4 Pt 1):1208–14. [PubMed] [Google Scholar]
- Parkkila S, Halsted CH, Villanueva JA, Vaananen HK, Niemela O. Expression of testosterone-dependent enzyme, carbonic anhydrase III, and oxidative stress in experimental alcoholic liver disease. Dig Dis Sci. 1999;44(11):2205–13. doi: 10.1023/a:1026640317233. [DOI] [PubMed] [Google Scholar]
- Petersson H, Basu S, Cederholm T, Riserus U. Serum fatty acid composition and indices of stearoyl-CoA desaturase activity are associated with systemic inflammation: longitudinal analyses in middle-aged men. Br J Nutr. 2008;99(6):1186–9. doi: 10.1017/S0007114507871674. [DOI] [PubMed] [Google Scholar]
- Rahman SM, Dobrzyn A, Lee SH, Dobrzyn P, Miyazaki M, Ntambi JM. Stearoyl-CoA desaturase 1 deficiency increases insulin signaling and glycogen accumulation in brown adipose tissue. Am J Physiol Endocrinol Metab. 2005;288(2):E381–7. doi: 10.1152/ajpendo.00314.2004. [DOI] [PubMed] [Google Scholar]
- Reo NV, Adinehzadeh M, Foy BD. Kinetic analyses of liver phosphatidylcholine and phosphatidylethanolamine biosynthesis using (13)C NMR spectroscopy. Biochim Biophys Acta. 2002;1580(2–3):171–88. doi: 10.1016/s1388-1981(01)00202-5. [DOI] [PubMed] [Google Scholar]
- Riserus U, Tan GD, Fielding BA, Neville MJ, Currie J, Savage DB, Chatterjee VK, Frayn KN, O’Rahilly S, Karpe F. Rosiglitazone increases indexes of stearoyl-CoA desaturase activity in humans: link to insulin sensitization and the role of dominant-negative mutation in peroxisome proliferator-activated receptor-gamma. Diabetes. 2005;54(5):1379–84. doi: 10.2337/diabetes.54.5.1379. [DOI] [PubMed] [Google Scholar]
- Sjogren P, Sierra-Johnson J, Gertow K, Rosell M, Vessby B, de Faire U, Hamsten A, Hellenius ML, Fisher RM. Fatty acid desaturases in human adipose tissue: relationships between gene expression, desaturation indexes and insulin resistance. Diabetologia. 2008;51(2):328–35. doi: 10.1007/s00125-007-0876-9. [DOI] [PubMed] [Google Scholar]
- Steffen LM, Vessby B, Jacobs DR, Jr, Steinberger J, Moran A, Hong CP, Sinaiko AR. Serum phospholipid and cholesteryl ester fatty acids and estimated desaturase activities are related to overweight and cardiovascular risk factors in adolescents. Int J Obes (Lond) 2008;32(8):1297–304. doi: 10.1038/ijo.2008.89. [DOI] [PMC free article] [PubMed] [Google Scholar]
- Vance DE, Ridgway ND. The methylation of phosphatidylethanolamine. Prog Lipid Res. 1988;27(1):61–79. doi: 10.1016/0163-7827(88)90005-7. [DOI] [PubMed] [Google Scholar]
- Vance JE, Vance DE. The role of phosphatidylcholine biosynthesis in the secretion of lipoproteins from hepatocytes. Can J Biochem Cell Biol. 1985;63(8):870–81. doi: 10.1139/o85-108. [DOI] [PubMed] [Google Scholar]
- Venkatesan S, Rideout JM, Simpson KJ. Microsomal delta 9, delta 6 and delta 5 desaturase activities and liver membrane fatty acid profiles in alcohol-fed rats. Biomed Chromatogr. 1990;4(6):234–8. doi: 10.1002/bmc.1130040605. [DOI] [PubMed] [Google Scholar]
- Villanueva J, Chandler CJ, Shimasaki N, Tang AB, Nakamura M, Phinney SD, Halsted CH. Effects of ethanol feeding on liver, kidney and jejunal membranes of micropigs. Hepatology. 1994;19(5):1229–40. [PubMed] [Google Scholar]
- Villanueva JA, Devlin AM, Halsted CH. Reduced folate carrier: tissue distribution and effects of chronic ethanol intake in the micropig. Alcohol Clin Exp Res. 2001;25(3):415–20. [PubMed] [Google Scholar]
- Villanueva JA, Esfandiari F, White ME, Devaraj S, French SW, Halsted CH. S-adenosylmethionine attenuates oxidative liver injury in micropigs fed ethanol with a folate-deficient diet. Alcohol Clin Exp Res. 2007;31(11):1934–43. doi: 10.1111/j.1530-0277.2007.00511.x. [DOI] [PubMed] [Google Scholar]
- Villanueva JA, Esfandiari F, Wong DH, Ahmad I, Melnyk S, James SJ, Halsted CH. Abnormal transsulfuration and glutathione metabolism in the micropig model of alcoholic liver disease. Alcohol Clin Exp Res. 2006;30(7):1262–70. doi: 10.1111/j.1530-0277.2006.00147.x. [DOI] [PubMed] [Google Scholar]
- Wang Y, Botolin D, Xu J, Christian B, Mitchell E, Jayaprakasam B, Nair MG, Peters JM, Busik JV, Olson LK, Jump DB. Regulation of hepatic fatty acid elongase and desaturase expression in diabetes and obesity. J Lipid Res. 2006;47(9):2028–41. doi: 10.1194/jlr.M600177-JLR200. [DOI] [PMC free article] [PubMed] [Google Scholar]
- Warensjo E, Ohrvall M, Vessby B. Fatty acid composition and estimated desaturase activities are associated with obesity and lifestyle variables in men and women. Nutr Metab Cardiovasc Dis. 2006;16(2):128–36. doi: 10.1016/j.numecd.2005.06.001. [DOI] [PubMed] [Google Scholar]
- Warensjo E, Riserus U, Gustafsson IB, Mohsen R, Cederholm T, Vessby B. Effects of saturated and unsaturated fatty acids on estimated desaturase activities during a controlled dietary intervention. Nutr Metab Cardiovasc Dis. 2008a doi: 10.1016/j.numecd.2007.11.002. [DOI] [PubMed] [Google Scholar]
- Warensjo E, Sundstrom J, Vessby B, Cederholm T, Riserus U. Markers of dietary fat quality and fatty acid desaturation as predictors of total and cardiovascular mortality: a population-based prospective study. Am J Clin Nutr. 2008b;88(1):203–9. doi: 10.1093/ajcn/88.1.203. [DOI] [PubMed] [Google Scholar]
- Watkins SM, Reifsnyder PR, Pan HJ, German JB, Leiter EH. Lipid metabolome-wide effects of the PPARgamma agonist rosiglitazone. J Lipid Res. 2002;43(11):1809–17. doi: 10.1194/jlr.m200169-jlr200. [DOI] [PubMed] [Google Scholar]
- Watkins SM, Zhu X, Zeisel SH. Phosphatidylethanolamine-N-methyltransferase activity and dietary choline regulate liver-plasma lipid flux and essential fatty acid metabolism in mice. J Nutr. 2003;133(11):3386–91. doi: 10.1093/jn/133.11.3386. [DOI] [PubMed] [Google Scholar]
- Yao ZM, Vance DE. The active synthesis of phosphatidylcholine is required for very low density lipoprotein secretion from rat hepatocytes. J Biol Chem. 1988;263(6):2998–3004. [PubMed] [Google Scholar]
- You M, Crabb DW. Molecular mechanisms of alcoholic fatty liver: role of sterol regulatory element-binding proteins. Alcohol. 2004;34(1):39–43. doi: 10.1016/j.alcohol.2004.07.004. [DOI] [PubMed] [Google Scholar]
- Yu S, Rao S, Reddy JK. Peroxisome proliferator-activated receptors, fatty acid oxidation, steatohepatitis and hepatocarcinogenesis. Curr Mol Med. 2003;3(6):561–72. doi: 10.2174/1566524033479537. [DOI] [PubMed] [Google Scholar]