

Abstract.
Currently, laser fluence calibration is typically required for quantitative measurement of particle concentration in photoacoustic imaging. Here, we present a calibration-free method to quantify the absolute particle concentration by statistically analyzing photoacoustic signals. The proposed method is based on the fact that Brownian motion induces particle count fluctuation in the detection volume. If the count of particles in the detection volume is assumed to follow the Poisson distribution, its expected value can be calculated by the photoacoustic signal mean and variance. We first derived a theoretical model for photoacoustic signals. Then, we applied our method to quantitative measurement of different concentrations of various particles, including red blood cells. Finally, we performed in vivo experiments to demonstrate the potential of our method in biological applications. The experimental results agreed well with the predictions from the theoretical model suggesting that our method can be used for noninvasive measurement of absolute particle concentrations in deep tissue without fluence calibration.
Keywords: photoacoustic imaging, Poisson distribution, particle concentration, calibration free, red blood cell
1. Introduction
Over the past few years, photoacoustic microscopy (PAM) has been proven to be capable of structural, functional, molecular, and metabolic imaging.1–4 In PAM, the object is illuminated by a short-pulsed laser beam. Following the absorption of light, the increased temperature generates an initial pressure rise, which propagates as photoacoustic (PA) waves and is detected by an ultrasonic transducer.5 Because the initial pressure is directly proportional to the absorbed optical energy density () in the tissue, which is the product of the optical fluence () and the optical absorption coefficient (), multiwavelength PA measurements can provide spectral information of optical absorption. Moreover, because it is essentially background free for blood-vessel imaging, PAM has better imaging contrast than other back-scattering-based optical imaging modalities. So far, PAM has shown its viability in detecting many intrinsic contrasts in biological tissues, such as hemoglobin,6 bilirubin,7 DNA and RNA in nuclei,8 lipid,9 cytochromes,10 and melanin.11 To obtain the intrinsic contrast property , we need to compensate for the extrinsic quantity . However, the optical fluence is usually unknown because of the light attenuation in tissue.12 Therefore, it is generally challenging to provide quantitative PA studies of, for example, oxygen metabolism.
Currently, the optical fluence can be compensated for either invasively13 or noninvasively.14–17 In the invasive method, an optical absorber with a priori known absorption spectrum is placed close to the target of interest and used as a reference. PA amplitude from the target of interest is normalized by the measured PA amplitude of this reference absorber. A noninvasive method involves solving both optical diffusion and PA wave equations. However, the inverse problems are computationally intensive and ill-posed due to optical diffusion. In another noninvasive method, the temporal profiles of PA signals are used to determine the absolute absorption coefficient.18–21 However, the acoustic attenuation and the limited bandwidth of the transducer may distort the PA signals. Thus, the direct fitting method may be inaccurate. To avoid this issue, our group has proposed to use acoustic spectra to determine the absolute absorption coefficient.22,23
In this paper, we present another quantitative approach to measure absolute absorber concentrations by statistical analyses of PA signals. To obtain a fluence-independent detection, the particle count in the detection volume needs to be small enough so that PA signal fluctuation due to the particle Brownian motion is dominant compared to other fluctuating sources, such as laser intensity fluctuation, electronic thermal noise, and photon shot noise. This method is analogous to fluorescence correlation spectroscopy and dynamic light scattering (also known as photon correlation spectroscopy). The former has been widely used to measure the fluorescence intensity fluctuations, while the latter has been used to measure the scattered light intensity fluctuations.
The paper is organized as follows. We first developed a model to describe the relationship between the measured PA signal and the particle count. The principle was then demonstrated experimentally. After samples of varied microsphere concentrations were studied, red blood cells (RBCs) were measured to show that our method can be applied to biological samples. Finally, we performed in vivo experiments to demonstrate the potential of our method in biological applications.
2. Methods and Materials
Particle fluctuation in a detection volume caused by Brownian motion is governed by Poisson distribution.24 Thus, the variance of the particle count () equals its mean, i.e.,
| (1) |
where denotes the variance and denotes the mean. Fluctuations of the particle count contribute to the PA signal fluctuations, which were assessed with multiple laser pulses. However, other sources could also lead to fluctuations in the PA signal, such as laser intensity fluctuation, electronic thermal noise, and photon shot noise. Because the photon shot noise is much smaller than the electronic thermal noise in PAM, it can be ignored. In a typical PA system, a photodiode (PD) is used to compensate for the laser pulse energy fluctuations. A beam sampler is used to extract a small portion of light into PD, while the remaining light illuminates the sample. The output of photodiode amplitude () can be expressed as
| (2) |
where is the efficiency of conversation from photons to voltage, is the percentage that light reflects from the beam sampler, is the photon count of the incident light, and is the PD electronic thermal noise after the mean value is subtracted. The photon count fluctuation is typically specified as a few percent of average pulse energy, hence the variance of photon count fluctuation can be assumed to be proportional to the square of mean photon counts:
| (3) |
where denotes the photon count fluctuation coefficient. Parameter is a property of the laser but it can be controlled to some extent by discarding laser pulses outside of the predetermined range of pulse energies.
Because the thermal noise is zero-mean, the mean and variance of are derived from Eq. (2) as
| (4) |
| (5) |
Based on Eqs. (4) and (5), we have
| (6) |
Equation (6) shows a parabolic relationship between and .
Similar to the analysis of PD, the PA amplitude () can be expressed as
| (7) |
where is a constant factor including Grueneisen parameter, heat conversion percentage, absorption cross section, and other minor contributors; is the particle count inside the detection volume; is the percentage that light transmits through the beam sampler; and is the electronic thermal noise of the ultrasonic transducer. Note that is slightly less than unity due to absorption and scattering loss.
Based on Eq. (7), the mean and the variance of are
| (8) |
| (9) |
Substituting Eq. (1) into Eq. (9), we have
| (10) |
When , we have
| (11) |
The ratio between the mean squared and the variance of is the power-based signal-to-noise ratio (SNR):
| (12) |
Defining , and substituting it into Eq. (12), we have
| (13) |
Since we get
| (14) |
Equation (14) can be discussed in two different cases. In case 1, when particles are dense enough so that . we have
| (15) |
approaches when increases. In case 2, when particles are sparse enough so that , we have
| (16) |
approaches when increases. Using Eq. (16) or more generally Eq. (14), one can measure the expected value of the absolute particle count. In addition, if , Eq. (16) reduces to
| (17) |
Thus, the measurement outcome is independent of the laser fluence. Although our model is derived for static particle suspension, it is also valid for flowing particles because the temporal statistics of particle count fluctuations in a static medium are equivalent to the spatial statistics of the particle count fluctuations in a flowing medium.24
We validated this idea using our optical-resolution PAM (OR-PAM) system shown in Fig. 1.25 A tunable dye laser (CBR-D, Sirah, GmbH, Grevenbroich and Germany), pumped by a Nd:YLF laser (INNOSAB, Edgewave, GmbH, Würselen and Germany) at a 1 kHz pulse repetition rate, provides nanosecond laser pulses. The laser beam is filtered by a 50-μm diameter pinhole and focused into the sample by a microscope objective lens (numerical aperture is 0.1). An acoustic-optical beam combiner, composed by two prisms sandwiching a layer of silicone oil, provides the acoustic-optical coaxial alignment. Acoustic detection is achieved with an ultrasonic transducer (V214-BC, Panametrics-NDT, Inc., Waltham) and a spherically focused acoustic lens, which is placed confocally with the optical objective lens. The detected PA signal is then amplified, digitized, and stored. Unlike confocal and two-photon microscopy, depth scanning is not needed in OR-PAM for volumetric imaging. A three-dimensional image is obtained by raster scanning the sample and piecing together the depth-resolved one-dimensional images (A-lines). So far, this OR-PAM system has achieved a lateral resolution of and an axial resolution of with an imaging depth of .25 Thus, the detection volume is about based on excitation beam width. In all experiments, plastic tubing with inner diameter of 300 μm was used to flow the liquid sample. A fast flow speed of was applied to the fluid in the tubing to avoid potential heat aggregation or photobleaching, and to make sure the multiple PA signals were completely independent.
Fig. 1.

Optical-resolution photoacoustic microscopy schematic. BS, beam splitter; ConL, condenser lens; CorL, correction lens; EP, eyepiece; ND, neutral density filter; OL, objective lens; PD, photodiode; PH, pinhole; RAP, right-angle prism; RhP, rhomboid prism; SOL, silicone oil layer; UT, ultrasonic transducer; and WT, water tank.
To calculate and , for each particle count, we measured 1500 A-lines with the same incident laser energy. Representative -lines and corresponding PA amplitudes are shown in Figs. 2(a) and 2(b), respectively. Thus, and can be obtained by calculating the variance and mean of the PA amplitudes. The background of each A-line inside the dashed box in Fig. 2(a) was used to calculate the electronic thermal noise . Then we tuned the neutral density filter, shown in Fig. 1, to change the incident laser energy. Thus, different and could be obtained. Meanwhile, for each PA A-line, we monitored the incident energy by using a PD. Similarly, we could also calculate and after 1500 measurements. By selecting PA A-lines with corresponding only in a predetermined range, the photon count fluctuation can be controlled. If , the absolute particle count can be quantified based on Eqs. (16) or (17).
Fig. 2.

Representative PA signals (a) and PA amplitudes (b) of multiple A-lines with the same incident laser energy for each particle count.
Lysed bovine blood was used for the experiment with large particle counts. It is estimated that there are about one billion hemoglobin molecules in the detection volume,26 which satisfies the condition that is much larger than for Eq. (15). For small particle counts, defibrinated whole bovine blood was used instead for the experiment. In whole blood, RBCs, instead of hemoglobin molecules, constitute the particles moving in and out of the detection volume. Since there are only a few RBCs in the detection volume, will be much smaller than , satisfying the condition for Eq. (16).
To demonstrate quantitative particle count measurement, we prepared samples with different particle concentrations. Since we require that particle count fluctuation be dominant in the PA signal fluctuation, two different sizes of red dyed microspheres were used to make the samples: a 0.5-μm diameter particle with a stock concentration of particles per milliliter (2.5% w/w), and a 1-μm diameter particle with a stock concentration of particles per milliliter (2.5% w/w). The smaller particle stock solution was diluted by two and four times, while the larger particle stock solution was diluted to eight and 16 times the stock concentration of the smaller particle solution.
We used defibrinated bovine blood in two experiments: an ex vivo experiment and an in vivo mimicking experiment. For the ex vivo experiment, defibrinated bovine blood with four different concentrations was prepared. The original undiluted defibrinated bovine blood () was serially diluted to 3/4, 1/2, and 1/4 of the original concentration. Since there were too few RBCs in the original resolution voxel of OR-PAM, we increased the detection volume to by defocusing the light beam. For the simulated in vivo experiment, the original undiluted defibrinated bovine blood () was serially diluted to 1/2 and 1/4 of the original concentration.
3. Results
3.1. Model Demonstration
Based on Eqs. (6) and (11), and parabolically depend on and , respectively. In addition, should be proportional to . In the experiment using lysed bovine blood, the result shows a clear parabolic relationship between and [Fig. 3(a)]. The photon count fluctuation coefficient was fitted to be 5.67%, close to the laser specification. The similar result between and is shown in Fig. 3(b). The coefficient was fitted to be 5.76%, very close to the one for PD. In addition, Fig. 3(c) shows that there is a good linearity between and .
Fig. 3.
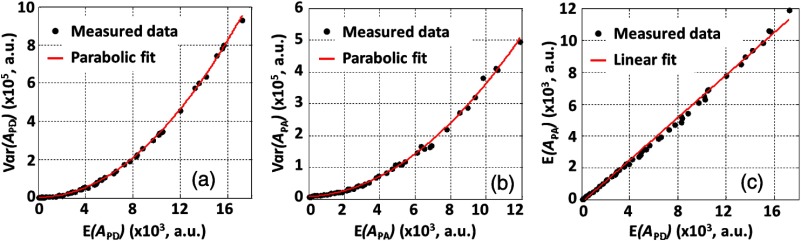
Relationships between (a) and , (b) and , (c) and as estimated from the experimental data. Fitting equation for (a): , where , coefficient of determination . Fitting equation for (b): , where and . Fitting equation for (c): , . (a) and (b) show that when the particle count is sufficiently large, both and follow a parabolic relationship with and , respectively. The coefficients for PD and PA are almost identical both due to the photon count fluctuation. (c) shows a good linearity between and .
As mentioned above, we can regroup the laser pulses based on the PD readings. By doing this, the laser intensity fluctuation coefficient can be artificially controlled to a predetermined value. Figure 4(a) shows that with large particle counts, is dominated by the light fluctuations when increases, consistent with Eq. (15). Here, the neutral density filter was adjusted to change the laser fluence and thus to change the . On the other hand, when the particle counts are small in the detection volume, the measurement results with high only rely on the particle counts [Figs. 4(b)–4(d)], consistent with Eq. (16). Although the photon count fluctuation coefficients are varied, the measurement results stay the same. Thus, the fluence-independent measurement is achieved with the conditions of high and small particle counts.
Fig. 4.

Measurements for different photon count fluctuation coefficients. (a) For larger particle counts, the at sufficiently high depends only on photon count fluctuation. (b)–(d) If the particle count is small, the at sufficiently high depends primarily on the particle count. (b) . (c) . (d) . The dots are the measurement data and the solid curves are the fitted results based on Eq. (14).
3.2. Measurement of Particle Counts
Next, we applied our method to quantitatively measure five different particle concentration samples. Figure 5(a) shows measured results with five different preset particle counts of 440, 220, 110, 55, and 27 in the detection volume. The experimental results agree well with the preset values. In addition, we observed that the measured particle count does not change with the laser fluence any longer when the is high enough. The fitted coefficient in the model was used to quantify the absolute particle count for each sample. As shown in Fig. 5(b), the experimental results agree well with the preset particle counts in the detection volume.
Fig. 5.

Quantitatively measuring particle concentration from different samples with the same light fluctuation. (a) The preset particle counts are 440 (purple), 220 (blue), 110 (red), 55 (green), and 27 (black). Solid lines: theoretical fitting based on Eq. (16). (b) Measured particle count versus the preset value.
3.3. Measurement of RBC Counts Ex Vivo
We also measured RBCs to validate the feasibility of our method in biological applications. Figure 6(a) illustrates the measured results with the fitting curve for four different preset RBC counts of 400, 300, 200, and 100 in the detection volume. We used the fitted coefficient to represent the counts of RBCs and compared with the corresponding preset RBC counts [Fig. 6(b)]. The results demonstrate that our method is fluence-independent and can be used to quantitatively measure biological samples.
Fig. 6.

Measured RBC counts under the same light fluctuation. (a) The preset particle counts are 400 (blue), 300 (red), 200 (green), and 100 (black). Solid lines: theoretical fitting based on Eq. (16). (b) Measured particle count versus the preset value.
3.4. Measurement of RBC Counts in the Simulated In Vivo Case
For in vivo application, additional signal fluctuation mainly comes from the perturbation of laser fluence by micro-flows in the light path. To mimic the in vivo situation while maintaining the flexibility of varying the RBC concentration, we covered targets made of black tape and bovine-blood-filled tubing with a living mouse ear, as shown in Figs. 7(a)–7(c).
Fig. 7.

Measurement of RBC counts in tubing covered by a living mouse ear. (a) Photo of the experimental setup. (b) Close-up of the region within the red dashed box in (a), showing the blood-filled tubing and black-tape targets covered by the living mouse ear. (c) A typical cross-sectional PA image showing that the tubing and part of the black tape were covered by the mouse ear. (d) Measurement of PA amplitude fluctuation from black tape at 40 random spots covered by the mouse ear.
We first measured the signal fluctuations from black tape, which did not show Brownian motion. As shown in Fig. 7(d), measurements were made at 40 random spots on the black tape. For all the spots, the PA signal fluctuations were around 2%. As described before, the power-based signal-to-noise ratio () was used to denote the measured particle counts. Since a 2% fluctuation corresponds to an of , it is negligible. The experimental results show that the in vivo PA signal fluctuation due to other sources rather than Brownian motion is insignificant.
Furthermore, we measured RBC counts in the same setup. Figure 8(a) illustrates the measured results, with fitting curves for three different preset RBC counts of 1080, 540, and 270 in the detection volume. We used the fitted coefficient to represent the RBC counts. As shown in Fig. 8(b), the experimental results agree with the preset RBC counts. The result shows that our method can be used to measure RBC counts in an in vivo mimicking situation using OR-PAM.
Fig. 8.
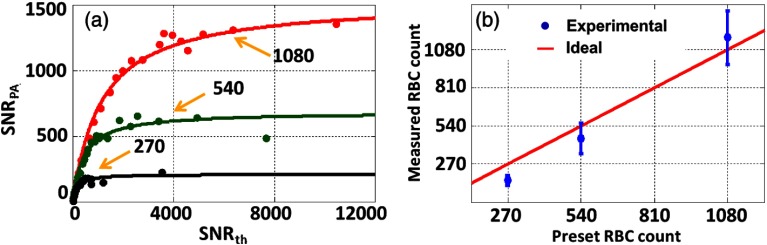
RBC count measurement with the blood-filled tubing covered by a mouse ear. (a) The preset RBC counts in the voxel were 1080 (red), 540 (green), and 270 (black). (b) Measured versus preset RBC counts.
3.5. Measurement of RBC Counts In Vivo
To show the potential for actual in vivo applications of our method, we performed two more demonstrations, which correspond to anemia caused by blood loss and by RBC aggregation, respectively. In each in vivo experiment on RBC count, we maintained the laser fluence constant (see Sec. 4). In the first demonstration, saline was injected into mouse tail vein to mimic blood loss (blood dilution), as shown in Fig. 9(a). The same vein was monitored to quantify the RBC count changes. Figure 9(b) shows a PA image of the vein, where the black cross denotes the monitoring spot. We slowly injected saline into the tail vein during a 3 min window. As shown in Figs. 9(c) and 9(d), the measured RBC count was reduced by injected saline. As soon as we stopped injection, the RBC count quickly returned to its normal value.
Fig. 9.

In vivo RBC count changes in a mouse tail vein when injecting saline. (a) Animal setup in the experiment. The imaged area was downstream of the saline injection spot. (b) PA MAP image of part of the tail in vivo. The large vessel in the middle is the mouse tail vein where we injected the saline. The black cross denotes the monitoring spot. (c) Time course of PA amplitude. The red dashed box highlights a clear decrease in the PA signal mean value. (d) RBC counts measured by our method before, during, and after saline were injected into the tail vein.
In the other demonstration, to induce RBC aggregation, we used 3% dextran-70 solution to mix with 3 mL original RBC solution. The diluted original and aggregated RBC solutions were imaged ex vivo by a commercial microscope, as shown in Fig. 10. The results show that we can induce RBC aggregation successfully ex vivo and probably in vivo.
Fig. 10.

RBC aggregation induced by 3% dextran-70 solution. The concentration of RBCs was the same in the two images. (a) Original and (b) aggregated RBCs imaged by a commercial microscope.
Then we performed an in vivo experiment to observe RBC aggregation. The same dextran-70 solution was injected into a mouse through the tail vein, and the mouse ear was used to monitor the RBC aggregation, as shown in Fig. 11(a). Figure 11(b) shows the PA image of the mouse ear, where the red cross denotes the RBC monitoring spot. As shown in Figs. 11(c) and 11(d), an increase of PA signal fluctuation and corresponding RBC count decrease were observed about 50 min after the dextran-70 solution injection. Based on the results of our ex vivo experiment, we think that this decrease in RBC count was from RBC aggregation, induced by the mixing of dextran-70 solution with blood.
Fig. 11.

RBC aggregation measured in vivo. (a) Animal mounting in the experiment. Dextran-70 solution was injected into the mouse through the tail vein. The mouse ear was imaged and monitored over the time. (b) PA MAP image of the mouse ear. The red cross denotes where we monitored the RBC count. (c) Time course of PA amplitude. The red dashed box highlights a clear increase in the PA signal fluctuation. (d) Time course of RBC count measured by our method. The selected red dashed box window highlights a decrease in RBC count.
4. Discussion
Both the theoretical model and experimental study showed that our method is applicable when the particle count in the detection volume is sufficiently small such that the particle Brownian motion dominates the PA signal fluctuation. If we can control the photon count fluctuation coefficient within 1%, the maximum count of particles that we can measure is on the order of 1000 (). By contrast, the minimum measurable count of particles is limited by . If the count of particles in the detection volume is too small, noise reduces the measuring accuracy significantly. Either particles with larger absorption cross sections or greater detection volumes can reduce the minimum. Based on our experimental results [Figs. 4(b)–4(d)], we conclude that our method can measure as few as three RBCs in the detection volume.
As shown in Sec. 3 (Fig. 5), our measured particle counts are slightly larger than the preset absolute counts estimated based on the detection volume of . This is most likely due to the inaccurate estimation of the detection volume. We calculated the detection volume based on the detection sensitivity field. However, particles not in this volume can still generate PA signals, which will contribute to the total PA signals. If we take those particles into account, the actual detection volume becomes greater.
In addition, as shown in Figs. 4(a), 5(a), and 6(a), when becomes high enough, the measured particle counts are independent of the and laser fluence. Although we examined the complete trend in this study with varying , a measurement with a single, high enough is sufficient to measure the fluence-independent particle counts in the detection volume, as we have done in the in vivo experiment.
In our experiments, we chose a flowing medium for the following two reasons. First, we focused on measuring counts of RBCs, which usually flow constantly in vivo. Second, using a flowing medium can avoid potential heat accumulation and photobleaching, which, however, can be mitigated by decreasing the pulse repetition rate. For example, the heat diffusion time is about 0.2 ms in our experiment (characteristic dimension: 5 μm; thermal diffusivity: ).5 Thus, a laser repetition rate of 1 kHz causes minimal heat accumulation, which is further reduced by blood perfusion.
Finally, we may be able to apply our method in deep tissue imaging modalities such as acoustic resolution PAM and PA computed tomography where fluence compensation is even more challenging. However, compared with OR-PAM, their greater detection volume may require even lower particle concentrations. Although it may be difficult to detect absolute RBC counts, we can use our method to monitor the absolute counts of other cells in blood, such as intact or labeled white blood cells,27 which are much sparser in the blood stream.
5. Conclusion
To the best of our knowledge, this is the first study using PAM for fluence-independent particle count measurement by statistically analyzing PA signals. This method has been experimentally verified by using different kinds of samples, including RBCs. We also demonstrated the feasibility of our method in the in vivo experiment. Therefore, our method shows promise for quantitatively measuring biological samples in vivo.
Acknowledgments
The authors would like to thank James Ballard and Seema Dahlheimer for this paper editing. We also appreciate technical assistance and useful discussions with Jinyang Liang, Chi Zhang, Chenghung Yeh, Lidai Wang, Arie Krumholz and Da-Kang Yao. This work was sponsored in part by National Institutes of Health Grants Nos. DP1 EB016986 (NIH Director’s Pioneer Award), R01 CA186567 (NIH Director’s Transformative Research Award), R01 EB016963, R01 CA134539, R01 CA157277, and R01 CA159959. L.W. has a financial interest in Microphotoacoustics, Inc. and Endra, Inc., which, however, did not support this work. K.M. has a financial interest in Microphotoacoustics, Inc., which, however, did not support this work.
Biographies
Yong Zhou is currently a graduate student in biomedical engineering at Washington University in St. Louis, under the supervision of Lihong V. Wang, Gene K. Beare Distinguished Professor. His research focuses on the development of photoacoustic imaging systems.
Junjie Yao is currently a research associate at Washington University in St. Louis, Missouri, under the supervision of Lihong V. Wang, Gene K. Beare Distinguished Professor. His research interests are the development of novel biomedical imaging techniques including photoacoustic imaging and ultrasonic imaging.
Lihong V. Wang the Beare Distinguished Professorship at Washington University. His book titled “Biomedical Optics” won the Goodman Award. He has published 365 journal articles with an h-index of 85 (>28000 citations) and delivered 380 keynote/plenary/invited talks. His laboratory invented functional photoacoustic CT and 3D photoacoustic microscopy. He serves as the editor-in-chief of the Journal of Biomedical Optics. He was awarded OSA’s C.E.K. Mees Medal, NIH Director’s Pioneer Award, and IEEE’s Biomedical Engineering Award.
Konstantin I. Maslov: Biography is not available.
References
- 1.Zhang C., et al. , “Slow-sound photoacoustic microscopy,” Appl. Phys. Lett. 102(16), 163702 (2013). 10.1063/1.4803444 [DOI] [PMC free article] [PubMed] [Google Scholar]
- 2.Zhou Y., et al. , “Calibration-free in vivo transverse blood flowmetry based on cross correlation of slow time profiles from photoacoustic microscopy,” Opt. Lett. 38(19), 3882–3885 (2013). 10.1364/OL.38.003882 [DOI] [PMC free article] [PubMed] [Google Scholar]
- 3.Kim C., Favazza C., Wang L. V., “In vivo photoacoustic tomography of chemicals: high-resolution functional and molecular optical imaging at new depths,” Chem. Rev. 110(5), 2756–2782 (2010). 10.1021/cr900266s [DOI] [PMC free article] [PubMed] [Google Scholar]
- 4.Yao J., et al. , “Label-free oxygen-metabolic photoacoustic microscopy in vivo,” J. Biomed. Opt. 16(7), 076003 (2011). 10.1117/1.3594786 [DOI] [PMC free article] [PubMed] [Google Scholar]
- 5.Wang L. V., Wu H., Biomedical Optics: Principles and Imaging, Wiley, Hoboken, New Jersey: (2007). [Google Scholar]
- 6.Liang J., et al. , “Cross-correlation-based transverse flow measurements using optical resolution photoacoustic microscopy with a digital micromirror device,” J. Biomed. Opt. 18(9), 96004 (2013). 10.1117/1.JBO.18.9.096004 [DOI] [PMC free article] [PubMed] [Google Scholar]
- 7.Zhou Y., et al. , “Photoacoustic microscopy of bilirubin in tissue phantoms,” J. Biomed. Opt. 17(12), 126019 (2012). 10.1117/1.JBO.17.12.126019 [DOI] [PMC free article] [PubMed] [Google Scholar]
- 8.Yao D. K., et al. , “In vivo label-free photoacoustic microscopy of cell nuclei by excitation of DNA and RNA,” Opt. Lett. 35(24), 4139–4141 (2010). 10.1364/OL.35.004139 [DOI] [PMC free article] [PubMed] [Google Scholar]
- 9.Wang H. W., et al. , “Label-free bond-selective imaging by listening to vibrationally excited molecules,” Phys. Rev. Lett. 106(23), 238106 (2011). 10.1103/PhysRevLett.106.238106 [DOI] [PMC free article] [PubMed] [Google Scholar]
- 10.Zhang C., et al. , “Label-free photoacoustic microscopy of cytochromes,” J. Biomed. Opt. 18(2), 020504 (2013). 10.1117/1.JBO.18.2.020504 [DOI] [PMC free article] [PubMed] [Google Scholar]
- 11.Zhang C., Maslov K., Wang L. V., “Subwavelength-resolution label-free photoacoustic microscopy of optical absorption in vivo,” Opt. Lett. 35(19), 3195–3197 (2010). 10.1364/OL.35.003195 [DOI] [PMC free article] [PubMed] [Google Scholar]
- 12.Zhou Y., Yao J., Wang L. V., “Optical clearing-aided photoacoustic microscopy with enhanced resolution and imaging depth,” Opt. Lett. 38(14), 2592–2595 (2013). 10.1364/OL.38.002592 [DOI] [PMC free article] [PubMed] [Google Scholar]
- 13.Rajian J. R., Carson P. L., Wang X., “Quantitative photoacoustic measurement of tissue optical absorption spectrum aided by an optical contrast agent,” Opt. Express 17(6), 4879–4889 (2009). 10.1364/OE.17.004879 [DOI] [PMC free article] [PubMed] [Google Scholar]
- 14.Laufer J., et al. , “Quantitative spatially resolved measurement of tissue chromophore concentrations using photoacoustic spectroscopy: application to the measurement of blood oxygenation and haemoglobin concentration,” Phys. Med. Biol. 52(1), 141–168 (2007). 10.1088/0031-9155/52/1/010 [DOI] [PubMed] [Google Scholar]
- 15.Yuan Z., Jiang H. B., “Quantitative photoacoustic tomography: recovery of optical absorption coefficient maps of heterogeneous media,” Appl. Phys. Lett. 88(23), 231101 (2006). 10.1063/1.2209883 [DOI] [Google Scholar]
- 16.Bauer A. Q., et al. , “Quantitative photoacoustic imaging: correcting for heterogeneous light fluence distributions using diffuse optical tomography,” J. Biomed. Opt. 16(9), 096016 (2011). 10.1117/1.3626212 [DOI] [PMC free article] [PubMed] [Google Scholar]
- 17.Kumavor P. D., et al. , “Target detection and quantification using a hybrid hand-held diffuse optical tomography and photoacoustic tomography system,” J. Biomed. Opt. 16(4), 046010 (2011). 10.1117/1.3563534 [DOI] [PMC free article] [PubMed] [Google Scholar]
- 18.Esenaliev R. O., et al. , “Optoacoustic technique for noninvasive monitoring of blood oxygenation: a feasibility study,” Appl. Opt. 41(22), 4722–4731 (2002). 10.1364/AO.41.004722 [DOI] [PubMed] [Google Scholar]
- 19.Laufer J., et al. , “In vitro measurements of absolute blood oxygen saturation using pulsed near-infrared photoacoustic spectroscopy: accuracy and resolution,” Phys. Med. Biol. 50(18), 4409–4428 (2005). 10.1088/0031-9155/50/18/011 [DOI] [PubMed] [Google Scholar]
- 20.Petrov Y. Y., et al. , “Multiwavelength optoacoustic system for noninvasive monitoring of cerebral venous oxygenation: a pilot clinical test in the internal jugular vein,” Opt. Lett. 31(12), 1827–1829 (2006). 10.1364/OL.31.001827 [DOI] [PubMed] [Google Scholar]
- 21.Wang Y., Wang R. K., “Photoacoustic recovery of an absolute optical absorption coefficient with an exact solution of a wave equation,” Phys. Med. Biol. 53(21), 6167–6177 (2008). 10.1088/0031-9155/53/21/018 [DOI] [PubMed] [Google Scholar]
- 22.Guo Z., Hu S., Wang L. V., “Calibration-free absolute quantification of optical absorption coefficients using acoustic spectra in 3D photoacoustic microscopy of biological tissue,” Opt. Lett. 35(12), 2067–2069 (2010). 10.1364/OL.35.002067 [DOI] [PMC free article] [PubMed] [Google Scholar]
- 23.Guo Z., et al. , “Quantitative photoacoustic microscopy of optical absorption coefficients from acoustic spectra in the optical diffusive regime,” J. Biomed. Opt. 17(6), 066011 (2012). 10.1117/1.JBO.17.6.066011 [DOI] [PMC free article] [PubMed] [Google Scholar]
- 24.Wang Y., Wang R. K., “Measurement of particle concentration in flow by statistical analyses of optical coherence tomography signals,” Opt. Lett. 36(11), 2143–2145 (2011). 10.1364/OL.36.002143 [DOI] [PMC free article] [PubMed] [Google Scholar]
- 25.Yao J., et al. , “Double-illumination photoacoustic microscopy,” Opt. Lett. 37(4), 659–662 (2012). 10.1364/OL.37.000659 [DOI] [PMC free article] [PubMed] [Google Scholar]
- 26.Beekvelt M. C., et al. , “Performance of near-infrared spectroscopy in measuring local O2 consumption and blood flow in skeletal muscle,” J. Appl. Physiol. 90(2), 511–519 (2001). [DOI] [PubMed] [Google Scholar]
- 27.Baatz H., et al. , “Kinetics of white blood cell staining by intravascular administration of Rhodamine 6G,” Int. J. Microcirc. 15(2), 85–91 (1995). 10.1159/000178955 [DOI] [PubMed] [Google Scholar]