

Abstract
Objective
Intrauterine growth has been associated with atopic conditions. Growth and adult height have been associated with cardiovascular disease, cancers and mortality but are highly genetic traits. The objectives of the study were as follows: first, to define a height measure indicating an individual's height below or above that which could be expected based on parental height (genetic inheritance) and growth charts. It was named ‘the additional height index’ (AHI), defined as (attained—expected) height; second, to investigate possible associations of AHI with atopic versus non-atopic health outcomes and with ischaemic heart disease (IHD) and IHD mortality.
Design
General population-based study.
Setting
Research centre.
Participants
A random sample of 2656 men and women living in greater Copenhagen took part in the MONICA10 study (the Danish monitoring trends and determinants of cardiovascular disease). In total, 1900 participants with information of parental height were selected.
Outcome measures
Atopic sensitisation (serum IgE), questionnaire information of atopic dermatitis, rhinoconjunctivitis, asthma or wheezing, and registry-based diagnoses of IHD/IHD mortality from National Registries.
Results
Increasing levels of AHI were inversely associated with non-atopic asthma, non-atopic wheezing, IHD and IHD mortality (IHD-all). For one SD increase of AHI, the OR or HR with CI in adjusted analyses was non-atopic asthma OR=0.52 (0.36 to 0.74), non-atopic wheezing OR=0.67 (0.51 to 0.89), and IHD-all HR=0.89 (0.78 to 1.01). The level of AHI was higher among individuals with atopic dermatitis, allergic rhinoconjunctivitis and atopic sensitisation (all p values <0.001) compared with individuals without those conditions; however, the associations were not confirmed in adjusted analyses.
Conclusions
Individuals with childhood conditions that led them to attain tallness higher than expected from their parents’ height may be at lower risk of non-atopic asthma/wheeze and IHD/IHD mortality but possibly at higher risk of atopic conditions. The measure of tallness below or above the expected height could be a sensitive alternative to normal height in epidemiological analyses.
Strengths and limitations of this study.
The strengths include he definition of a new height measure, the ‘Additional Height Index’. It is designed to take genetic inheritance in height into account when using height measures in epidemiological studies.
A population-based cohort of 1900 adults with blood samples to test for atopic sensitisation and follow-up of participants in national registries.
The design of the additional height index is not validated and the study is based on a single cohort.
Introduction
The prevalence of allergic diseases has increased worldwide, apparently in parallel to increasing affluence,1 first in westernised countries followed by low-income and middle-income countries.2–4 Possible explanations have included improved hygiene and decreasing sibship size, for example, leading to fewer infections.5–8 However, a secular change along with increasing affluence and hygienic standards is health-focused behaviour in these societies, for example, parental focus on nutrients and frequent meals for their children. This most likely contributes to the increased prenatal and postnatal growth of children as well as increased growth in adolescence that has been observed in different countries and ethnic groups following affluence.9–12 Since the rise in allergic diseases has developed in parallel with these changes in growth and health-focused behaviour, it may be speculated that factors leading to increased growth also can induce, for example, changes in the immune system towards an increased susceptibility to allergies.
Childhood health is supposedly reflected by balanced growth during gestation, through early infancy to adulthood, and children who do not follow the normal growth pattern seem to have a higher risk of different diseases. For instance, small babies who exhibit catch-up growth have an increased risk of developing cardiovascular diseases (CVDs), impaired lung function and asthma compared with small babies who stay small.13 14 Catch-up growth may also be more predictive of childhood asthma than birth weight and length, which have otherwise been associated with such diseases.14 15 One study found an association between restricted growth in late gestation and an increased rate of later development of an atopic phenotype, whereas another found contrasting results.16 17 Similarly, anthropometric measures pointing to growth that is slower than normal in the prepubertal period, such as low adult leg length, leg : trunk ratio and total height, have been linked to higher rates of coronary heart disease, diabetes and mortality, although to lower rates of non-smoking-related cancers.18–23
As a proxy for different patterns of imbalanced growth throughout childhood, we considered constructing a measure that would assess an individual's attained ‘extra height’ (positive or negative) compared with the height that could be expected based on the height of their parents. In general, genetic inheritance accounts for around 80% of the variance in height.24 Thus, the ‘extra height’ measure could be a sensitive marker of relative growth below or beyond genetic inheritance, and could possibly be used as an indicator of health or the risk of different diseases.
In this paper, we tested the hypothesis that positive values of ‘extra height’ would be positively associated with allergic rhinoconjunctivitis, atopic dermatitis and atopic sensitisation but inversely associated with non-atopic asthma and non-atopic wheezing. We also tested the consistency of the results by testing the hypothesis that ‘extra height’ would be inversely associated with ischaemic heart disease (IHD) and mortality, both of which are known to be influenced by an individual’s height or that of their parents.19 25
Methods
Study population
The current study took advantage of the previous MONICA (the Danish monitoring trends and determinants of cardiovascular disease) studies that were part of the international WHO coordinated study, MONICA. The Danish MONICA1 was conducted during 1982–1984, whereas MONICA10 was conducted during 1993–1994. For MONICA1, a random sample of 4807 men and women born in 1922, 1932, 1942 or 1952 and living in 1 of 11 municipalities in greater Copenhagen were invited. After exclusion of 226 individuals of non-Danish origin, those eligible for the study were 4581 individuals. The participation rate was 78.8% ( n/N= 3608/4581).26 MONICA10: all of the original 4581 individuals eligible for MONICA1were eligible for invitation to MONICA10 but 451 had either died, emigrated or could not be reached; thus, 4130 were invited. The participation rate was 64.3% (n/N = 2656/4130), as shown in a flowchart in an earlier publication.27 For the current study, we selected all of the participants from MONICA10 with complete data on their mother’s and father’s heights, N=1900. We used data from the MONICA10 health examination and self-administered questionnaires, while we used data of IgE seropositivity from the MONICA1 study.
The study was conducted in accordance with the second Helsinki Declaration and written informed content was obtained from all participants.
Definition of the additional height index
The additional height index (AHI) was designed as: An individual's measured height [minus sign] an individual's expected height. It takes both positive and negative values. The concept of an expected height was based on the national growth charts of Danish boys and girls.28 The calculation of AHI was made as:
 |
 |
where ADH=average deviated height=((AHM-APHM)+(APHF-AHF))/2, and where AHM=average height males, APHM=average mid-parental height males, AHF=average height females, and APHF=average mid-parental height females. Thus, ADH is the average that men are higher than their parents plus the average that women are lower than their parents divided by two.
The formula for ADH minimises the effect of statistical fluctuations in height of the parents between the group of males and females. Several alternatives for the calculation of AHI and ADH are elaborated in the online supplementary material.
Physical examination and blood tests
Height and weight of the study participants were measured by the study nurses with participants wearing light clothes and no shoes. The heights of the parents were reported by the study participants. Body mass index (BMI) was calculated. Blood pressure was measured twice with the study participants sitting after 5 min rest and the average calculated. Atopy was defined as a qualitative detection of IgE antibodies specific to 19 common inhalant allergens in serum using the ADVIA Centaur Allergy Screen Assay, as described previously.29 Total cholesterol, high-density lipoprotein and triglycerides were measured by enzymatic procedures (Roche, Mannheim, Germany), as described previously.30
Self-administered questionnaire from MONICA10
The self-administered questionnaire included information on lifestyle habits, medical history, sociodemographic variables and other potential confounders.
Symptoms of allergic rhinoconjunctivitis were defined as positive answers to all of the following questions: ‘have you had itching or stinging from the eyes?’, ‘have you had itching or stinging from the nose?’, and ‘have you had a running nose without having a cold within the last 12 months?’ Atopic dermatitis was defined as a positive answer to ‘has a physician ever told you that you have atopic dermatitis?’ Asthma was defined as positive answers to both ‘has a physician ever told you that you have asthma?’ and ‘have you had an attack of asthma within the last 12 months?’ Wheezing was defined as positive answers to: ‘have you been wheezing within the last 12 months?’, and ‘have you been woken up by wheezing or whistling in the chest?’ Non-atopic asthma and wheezing were defined as asthma/wheezing in individuals without atopy.
Educational level was categorised in four groups (none, low, medium and high) ranging from no vocational qualifications apart from primary and secondary school to >4 years of theoretical education following high school. The average weekly alcohol intake was categorised in five groups as 0, 1–7, >7–14, >14–21, >21 standard drinks (approximately 1.5 cl or 12 g ethanol) per week. Leisure time physical activity was reported as sedentary, light, moderate and vigorous. Smoking status was categorised as never-smoker, ex-smoker or current smoker at <15, ≥15–25 or ≥25 g of tobacco or cigarettes/day, respectively.
Registry-based diagnosis of IHD and mortality due to IHD
From the Danish National Patient Register,31 including all patients admitted to hospitals in Denmark, and from the Danish Registry of Causes of Death,32 we obtained information of an individual's first diagnosis of IHD in a hospital and/or death caused by IHD as the primary cause, respectively. The included diagnoses from International Classification of Diseases (ICD), Eighth Revision (ICD8) were 410–414 and from ICD10 were I20–25 in both registers. Denmark never used ICD9. The outcomes used in the paper were: IHD event (participant still alive), death by IHD, and IHD-all (IHD event and/or death by IHD). Participants were followed until 31 October 2012.
Statistics
Statistical analyses were performed using the R-statistical package, V.2.13.0 (http://www.r-project.org/). All p values were two tailed and statistical significance was defined as p<0.05. p Values of likelihood ratio tests were used to test for the significance of all multivariate analyses.
Initially, we divided the population into three equally sized groups (in the following referred to as ‘tertiles’) with low, medium or high values of additional height (table 2). We used χ2 tests for trend to examine differences between these three groups with respect to the prevalence of atopic sensitisation, allergic rhinoconjunctivitis, atopic dermatitis, asthma, wheeze, IHD and IHD mortality.
Table 2.
Frequencies of diseases in three groups of the additional height index
| Level of the additional height index | Low |
Middle |
High |
||||
|---|---|---|---|---|---|---|---|
| Per cent | (n/N) | Per cent | (n/N) | Per cent | (n/N) | p Value | |
| History of atopic dermatitis | 1.58 | (10/633) | 3.17 | (20/631) | 2.69 | (17/632) | 0.204 |
| Symptoms of allergic rhinoconjunctivitis | 3.66 | (23/629) | 5.11 | (32/626) | 6.02 | (38/631) | 0.093 |
| Allergic sensitisation* | 18.20 | (102/564) | 18.01 | (107/573) | 21.32 | (123/592) | 0.243 |
| All wheezing | 4.74 | (30/633) | 3.17 | (20/630) | 2.54 | (16/630) | 0.033 |
| Non-atopic wheezing | 4.14 | (26/628) | 3.05 | (19/623) | 1.75 | (11/630) | 0.013 |
| Allergic wheezing | 0.64 | (4/629) | 0.16 | (1/626) | 0.79 | (5/629) | NA |
| All physician diagnosed asthma | 4.11 | (26/632) | 2.69 | (17/631) | 1.58 | (10/631) | 0.002 |
| Non-allergic physician diagnosed asthma | 3.03 | (19/628) | 2.08 | (13/624) | 0.64 | (4/629) | 0.001 |
| Allergic physician diagnosed asthma | 0.95 | (6/629) | 0.64 | (4/626) | 0.95 | (6/631) | NA |
| IHD | 14.87 | (91/612) | 13.13 | (81/617) | 10.56 | (66/625) | 0.036 |
| Death IHD | 4.89 | (31/634) | 3.48 | (22/633) | 1.74 | (11/633) | 0.005 |
| IHD or death IHD | 16.83 | (103/612) | 14.26 | (88/617) | 11.20 | (70/625) | 0.007 |
p Value obtained by χ2 test for trend.
*Positive test to ADIVIA Centaur Allergy Screen.29
IHD, ischaemic heart disease; NA, not available
We used logistic regression to model non-atopic asthma, non-atopic wheezing, atopic sensitisation, allergic rhinoconjunctivitis and atopic dermatitis (figures 2 and 3). We did not model atopic asthma/wheeze because of the few participants in these categories. We checked for non-linear associations between all explanatory variables and logit of the dichotomous outcomes using P-splines within the generalised additive model (R ‘mgcv’ package). We used Cox regression models with age as the underlying time to analyse events of IHD and IHD mortality (figures 2 and 3). We checked the fit of the models by plotting pseudoresiduals against covariate values.33 Assumptions of linearity were obtained in all logistic regression and Cox regression models. Thus, the estimates of these models (figures 2 and 3) can be interpreted as the increased (or decreased) risk of a health outcome with every one SD increase of AHI.
Figure 2.

The association of the additional height index (1 SD) with eight health outcomes. OR or HR (ischaemic heart disease (IHD), IHD mortality) with error bars indicate the CIs of the estimates. Diamonds, adjusted for age and gender; squares, additionally adjusted for body mass index, educational level, smoking status, alcohol consumption and physical activity during leisure time. Adjustment of the IHD models also includes serum levels of triglycerides, low-density lipoprotein, high-density lipoprotein and systolic blood pressure.
Figure 3.

The association of height (1 SD) with eight health outcomes. OR or HR (ischaemic heart disease (IHD), IHD mortality) with error bars indicate the CIs of the estimates. Diamonds, adjusted for age and gender; squares, additionally adjusted for body mass index, educational level, smoking status, alcohol consumption and leisure time physical activity. Adjustment of the IHD models also includes serum levels of triglycerides, low-density lipoprotein, high-density lipoprotein and systolic blood pressure.
We performed all analyses with and without BMI to investigate whether part of the effect of AHI seemed to be mediated by BMI; we also tested for possible interactions between BMI and AHI. We then performed all analyses with and without height and weight separately to investigate whether part of the effect of AHI seemed to be mediated by either height or weight alone. Finally, we repeated all analyses with and without ‘the educational level’ (our best measure of socioeconomic position) of the participants to investigate whether the educational level could account for the effect of AHI.
Sensitivity analyses included repeated analyses in the different strata of age groups and analyses without the highest and lowest percentiles of explanatory variables. Further, we repeated all analyses with AHI with incorporated corrections for secular changes in height and for regression to the mean effects.
Results
The distribution of additional height is given in figure 1. The mean additional height was 0.90 cm (SD=5.71 cm), meaning that the mean attained height of the participants was approximately 1 cm higher than expected from the height of their parents alone but with some variance between study participants. The characteristics of the study population are given in table 1 along with the level of AHI for each characteristic. AHI had significantly different levels in groups of most available characteristics/confounders (table 1). There was no difference between individuals with and without complete data on mother’s and father’s height with respect to other variables, such as age, gender, BMI or any of the modelled outcomes. Sensitivity analyses did not change the pattern of results presented below.
Figure 1.
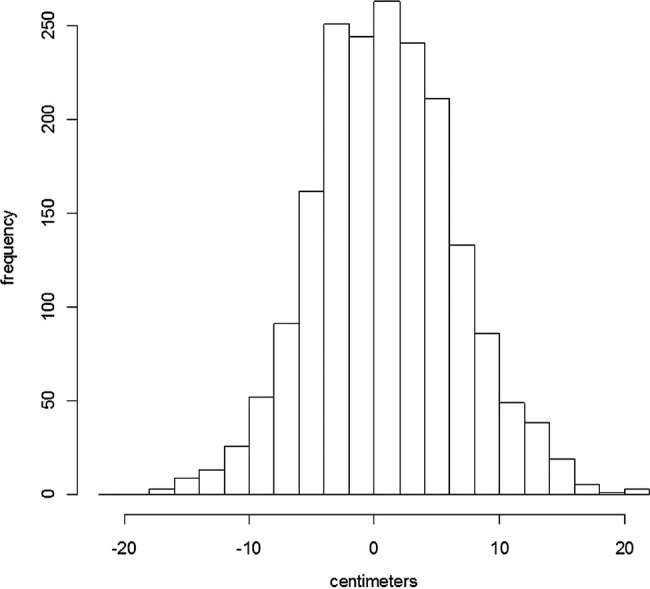
The distribution of the additional height index (measured height–expected height) in a general population of Danish adults, n=1900.
Table 1.
Characteristics of the study population and level of additional height index
| Characteristics (n missing) | Level of AHI (cm) |
|||
|---|---|---|---|---|
| Percentage of all (n group) | Mean | SD | p Value*,† | |
| Age and gender | ||||
| 41 | 30.3 (576) | 2.68 | 5.61 | |
| 51 | 29.5 (560) | 1.16 | 5.61 | |
| 61 | 24.7 (469) | 0.11 | 5.61 | |
| 71 | 15.5 (295) | −1.81 | 5.61 | <0.001 |
| Males | 51.4 (977) | 0.90 | 5.88 | |
| Females | 48.6 (923) | 0.90 | 5.53 | 0.003 |
| Body mass index | ||||
| <18.5 (kg/m2) | 0.7 (14) | 0.48 | 5.45 | |
| ≥18.5 to <25 (kg/m2) | 46.1 (875) | 1.06 | 5.81 | |
| ≥25 to <30 (kg/m2) | 38.5 (732) | 1.07 | 5.70 | |
| ≥30 (kg/m2) | 14.7 (279) | −0.03 | 5.36 | <0.001 |
| Smoking | ||||
| Current | 45.3 (859) | 0.93 | 5.77 | |
| Former | 27.8 (527) | 0.76 | 5.76 | |
| Never | 26.9 (510) | 1.01 | 5.57 | 0.032† |
| Alcohol (10) | ||||
| None | 12.9 (243) | 0.37 | 5.67 | |
| ≦14 units/week | 63.1 (1193) | 0.83 | 5.71 | |
| >14 units/week | 24 (454) | 1.39 | 5.75 | 0.109† |
| Vocational training | ||||
| Level 1 | 19.6 (373) | −0.26 | 5.87 | |
| Level 2 | 56.1 (1066) | 0.92 | 5.67 | |
| Level 3 | 19 (360) | 1.71 | 5.58 | |
| Level 4 | 5.3 (101) | 2.06 | 5.31 | 0.132† |
| Physical activity leisure time (24) | ||||
| Sedentary | 20.6 (387) | 0.61 | 5.45 | |
| Walking | 56.2 (1054) | 0.92 | 5.76 | |
| Active/competition | 23.2 (435) | 1.16 | 5.86 | <0.001 |
| Allergic sensitisation‡ (171) | ||||
| Not present | 80.8 (1397) | 0.91 | 5.78 | |
| Present | 19.2 (332) | 1.41 | 5.49 | <0.001 |
| Atopic dermatitis (4) | ||||
| Not present | 97.5 (1849) | 0.88 | 5.73 | |
| Present | 2.5 (47) | 1.72 | 5.06 | <0.001 |
| Allergic rhinoconjunctivitis (14) | ||||
| Not present | 95.1 (1793) | 0.89 | 5.72 | |
| Present | 4.9 (93) | 1.57 | 5.56 | <0.001 |
| Wheezing (7) | ||||
| Present no allergies | 3 (56) | −1.31 | 5.33 | |
| Not present | 96.5 (1827) | −0.76 | 5.80 | |
| Present and allergies present | 0.5 (10) | 2.36 | 7.58 | <0.001 |
| Physician diagn. Asthma (6) | ||||
| Present no allergies | 1.9 (36) | −2.58 | 5.59 | |
| Not present | 97.2 (1841) | −1.33 | 6.17 | |
| Present and allergies present | 0.9 (16) | 1.81 | 6.56 | <0.001 |
| IHD event (46) | ||||
| Not present | 89.8 (1665) | 1.08 | 5.76 | |
| Present | 10.2 (189) | 0.12 | 5.09 | 0.083 |
| IHD death (46) | ||||
| Not present | 88.7 (1645) | 0.98 | 5.71 | |
| Present | 11.3 (209) | −1.39 | 5.36 | 0.310 |
p Value obtained by:
*χ2 test or
†χ2 test for trend.
‡Positive test to ADIVIA Centaur Allergy Screen.29
AHI, additional height index; diagn., diagnosed; IHD, ischaemic heart disease
The mean level of AHI was higher among individuals with atopic sensitisation, atopic dermatitis and allergic rhinoconjunctivitis than among individuals without (table 1). Also, the mean level of AHI was higher among individuals with atopic asthma/wheeze than among those without (table 1). Further, higher prevalences of atopic sensitisation, allergic rhinoconjunctivitis and atopic dermatitis were recorded among participants within the highest tertile of AHI compared with within the lowest tertile, but this was not statistically significant (table 2). Neither did the regression analyses confirm the associations of AHI with either allergic rhinoconjunctivitis or atopic dermatitis alone (figure 2), but the OR for having either allergic rhinoconjunctivitis or atopic dermatitis was 1.44 (0.84 to 2.44) for one SD increase in AHI.
In contrast, the prevalence of non-atopic asthma/wheeze, IHD and IHD mortality decreased significantly through increasing tertiles of AHI (table 2). Further, in regression analyses, we found significant inverse associations of increasing levels of AHI with non-atopic asthma/wheeze, and inverse associations close to a 5% significance level with IHD/IHD mortality (figure 2, squares). The associations of AHI and these health outcomes were not attenuated by adjustment with potential confounders (figure 2, diamonds). In the case of non-atopic asthma, the adjusted OR is 0.54 (0.38 to 0.77) per one SD of AHI (figure 2). This means that for individuals 5.7 cm (1 SD) taller than expected based on the height of the parents, the odds of having non-atopic asthma is reduced by approximately 46% compared with individuals with the expected height. Thus, our results suggest that for every 5.7 cm increase of AHI, the probability of having non-atopic asthma is approximately halved. Adjustment with weight did not change the associations (data not shown), and there were no interactions or trends towards interactions between AHI and gender (data not shown).
Mid-parental height and parents’ height as separate variables were not associated with the outcomes (data not shown). However, to some extent, the study participants’ own height resembled the results obtained for AHI (figure 3), as the most noticeable difference was the generally broader CI for height. Results obtained with alternative calculations of AHI are presented in the online supplementary material.
Discussion
We created the AHI that we propose reflects health circumstances in childhood independent of the inherited height. We found higher levels of additional height among individuals with atopic sensitisation, allergic rhinoconjunctivitis and atopic dermatitis, but we could not confirm this in adjusted regression analyses. However, we found significant inverse associations of AHI with non-atopic asthma/wheezing and inverse associations with IHD/IHD mortality close to a 5% significance level. The associations with IHD are in line with earlier findings of associations between growth measures and coronary heart disease, mortality, type 2 diabetes and insulin resistance in different ethnic groups and lend support to AHI as an indicator of childhood health.18–20 22 23
We speculated that health-focused behaviour in affluent societies could present a supplementary explanation of the increased prevalence of allergic conditions otherwise explained by hygiene and fewer infections. Health focus could lead to changes in dietary patterns and nutritional intake that would again be reflected by changed growth patterns both prenatally and postnatally. Thus, we speculated that increased growth could basically reflect a slightly different construction of organs, cell regulatory mechanisms and function of the immune system that would again lead to a different risk set of several health outcomes, for example, higher risk of allergic conditions and some cancers but lower risks of CVDs. However, increased growth could also reflect lower exposure to infections prenatally and postnatally, and our observations are thus not incompatible with the hygiene hypothesis.
We find some support for our speculations: prenatally, one study found that mothers’ changed intake of fatty acids from fish to fatty acids from plants may increase the risk of atopy but possible changes in growth were not recorded.34 Similarly, another study indicated that poor fetal growth may reduce the risk of skin prick test reactivity during childhood.17 Considering the childhood period, decreasing risks of asthma, rhinitis and allergic sensitisation in 4-year-old children have been found with increasing socioeconomic position, something that may influence dietary patterns.35 Finally, changes on a population level, such as decreased stunting in Brazil during fairly similar decades of increases of allergic health outcomes,4 36 do not contradict our hypotheses. For the same time period, there is some evidence that increased growth may be associated with increased risk of non-smoking-related cancers.10 Prenatal growth parameters such as birth weight and head circumference have been associated with several childhood cancers in Nordic populations born from 1967.37 Thus, these findings relate to a period of increasing wealth of Nordic societies, especially of Finland. Further, in a Danish population including participants born between 1930 and 1989, late childhood growth has been associated with thyroid cancer,38 and early adolescence growth with prostate cancer.39 These long-term risk sets are complex and the underlying pathways leading to growth, cancer risk and possibly other health outcomes such as allergic conditions are unknown, although insulin-like growth factor levels, overall energy intake and nutritional supplementations have been mentioned.40 41
On an overall level, we speculate that a balance between healthy growth and adaptive mechanisms to less optimal conditions could be ‘tipped to the healthy side’ in allergic diseases. Few periods of relative starvation (skipping meals), which modern and affluent parents tend to avoid but were more common before the 20th century's increase in living standards, could lead to ‘less resistance’ of the child, for instance via a different set of intestinal microbes,42 and subsequent to allergies. One study hypothesised that alternate day calorie restriction decreases asthma and seasonal allergies, among other disorders,43 while another study found that reduced calorie intake could reduce symptoms in atopic dermatitis.44 Thus, when some studies indicate an effect of hygiene standards or sibship size to the development of allergic disease with fewer allergies among those born last,8 we speculate that parents may have been more observant of, for example, nutrients and feeding of their oldest children. However, our results could only partly support these ideas.
AHI was inversely associated with asthma/wheeze among IgE-negative individuals. In this way, our results are in line with other studies defining a separate entity of asthma not responding to corticosteroid treatment,45 driven by neutrophils,46 associated with obesity47 and with onset in adulthood.45 With the present paper, we further suggest that this entity of non-atopic asthma more commonly occurs in individuals with less optimal health and growth during childhood. A possible explanation for this finding is that reduced airway calibre along with overall reduced growth leads to increased susceptibility to asthma and wheeze. However, a supplementary association between less optimal childhood conditions and late-onset disease cannot be excluded and would correspond to the tendency of an inverse association of growth with risk of IHD that we also observed in this study. In accordance, one study found an inverse association between increasing height and adult-onset asthma,48 and another found more asthma symptoms within the past 12 months specifically among adults in deprived areas.49 It is well documented that steroid inhalation therapy for asthma leads to restricted growth and lower adult height.50 However, the participants in our study were children before the introduction of steroid inhalation therapy in Denmark in the 1980s, and thus we do not think that our results are affected by reduced height due to steroid inhalation therapy. Even though adiposity was a potential confounder, our results were robust to adjustments for BMI/weight; thus, we consider it unlikely that the effect of AHI was simply mediated through adiposity.
The concept of AHI was constructed for the purpose of this study. Therefore, we made an indirect validation of the concept by finding expected inverse associations between AHI and IHD. Further, to test the robustness of the concept, we calculated AHI in three slightly different ways to account for secular changes in height alone and secular changes in height difference between males and females (see online supplementary material), and all three methods subsequently gave essentially similar associations with the health outcomes presented in this paper. Further, we estimated and adjusted AHI for possible regression to the mean effect in heights. We found that even this adjustment did not alter the results presented. Therefore, the idea of AHI seems robust. Further, AHI most likely has the advantage over ordinary height in that it more accurately measures growth of individuals who are, for example, tall but were supposed to be slightly taller. In this case, AHI will assign a slight negative value, whereas ordinary height simply measures ‘tallness’ (a positive value). Opposite is the case for short individuals. This may be the exact reason for the more tight CIs of the analyses of AHI (figure 2) as compared with height (figure 3) in our study. We tested the association of mid-parental height and parents’ height separately with the outcomes, but we did not find associations, as have been reported in other studies.25 51
The limitations of the study include possible selection bias. First, individuals were lost to follow-up between MONICA1 and MONICA10. Second, among those actually invited for MONICA10, some chose not to participate. We cannot exclude that they may have chosen not to participate due to causes related to exposure and outcomes of the study. This may also have had an impact on the generalisability of the study. However, in respect of the registry-based outcomes, we had no loss to follow-up with regard to mortality and incidence of CVD. The definitions of allergic rhinoconjunctivitis, atopic dermatitis, asthma and wheezing all came from questionnaires and may have been subject to recall bias or misclassification. Educational level was the best measure of social class, and residual confounding could in theory have caused the associations found. However, most of these methodological shortcomings would likely have led to attenuation of the estimates, and yet we found results that were consistent with the literature (IHD) and differences between atopic asthma/wheezing and non-atopic asthma/wheezing.
In conclusion, we propose AHI as a measure that reflects living circumstances mainly in infancy, childhood and adolescence and suggest that the level of attained additional height may indicate the chance of certain health or disease outcomes during adult life. We speculate that allergic conditions, in contrast to non-atopic asthma, wheeze and IHD, are associated with healthy living during childhood.
Supplementary Material
Footnotes
Contributors: RVF and TS analysed the data. RVF wrote the first draft of the manuscript. RVF, CV, AG-Q, LLNH and AL contributed to the writing of the manuscript. All the authors agreed with the manuscript results and conclusions.
Funding: This work was funded by the Danish Lung Society, Aase and Einar Danielsens Foundation, and the Danish Scientific Research Council (Sag 106402).
Competing interests: None.
Ethics approval: The approval was given by the Ethical Committee for Copenhagen County (project number KA93054).
Provenance and peer review: Not commissioned; externally peer reviewed.
Data sharing statement: No additional data are available.
Reference
- 1.von Hertzen LC, Haahtela T. Asthma and atopy—the price of affluence? Allergy 2004;59:124–37 [DOI] [PubMed] [Google Scholar]
- 2.Linneberg A, Nielsen NH, Madsen F, et al. Secular trends of allergic asthma in Danish adults. The Copenhagen Allergy Study. Respir Med 2001;95:258–64 [DOI] [PubMed] [Google Scholar]
- 3.Umetsu DT, McIntire JJ, Akbari O, et al. Asthma: an epidemic of dysregulated immunity. Nat Immunol 2002;3:715–20 [DOI] [PubMed] [Google Scholar]
- 4.Bjorksten B, Clayton T, Ellwood P, et al. Worldwide time trends for symptoms of rhinitis and conjunctivitis: Phase III of the International Study of Asthma and Allergies in Childhood. Pediatr Allergy Immunol 2008;19:110–24 [DOI] [PubMed] [Google Scholar]
- 5.da Costa LR, Victora CG, Menezes AM, et al. Do risk factors for childhood infections and malnutrition protect against asthma? A study of Brazilian male adolescents. Am J Public Health 2003;93:1858–64 [DOI] [PMC free article] [PubMed] [Google Scholar]
- 6.Linneberg A, Ostergaard C, Tvede M, et al. IgG antibodies against microorganisms and atopic disease in Danish adults: the Copenhagen Allergy Study. J Allergy Clin Immunol 2003;111:847–53 [DOI] [PubMed] [Google Scholar]
- 7.Kinra S, Davey SG, Jeffreys M, et al. Association between sibship size and allergic diseases in the Glasgow Alumni Study. Thorax 2006;61:48–53 [DOI] [PMC free article] [PubMed] [Google Scholar]
- 8.Karmaus W, Botezan C. Does a higher number of siblings protect against the development of allergy and asthma? A review. J Epidemiol Community Health 2002;56:209–17 [DOI] [PMC free article] [PubMed] [Google Scholar]
- 9.Johnson W, Choh AC, Soloway LE, et al. Eighty-year trends in infant weight and length growth: the Fels Longitudinal Study. J Pediatr 2012;160:762–8 [DOI] [PMC free article] [PubMed] [Google Scholar]
- 10.Davey SG, Hart C, Upton M, et al. Height and risk of death among men and women: aetiological implications of associations with cardiorespiratory disease and cancer mortality. J Epidemiol Community Health 2000;54:97–103 [DOI] [PMC free article] [PubMed] [Google Scholar]
- 11.Chen TJ, Ji CY. Secular change in stature of urban Chinese children and adolescents, 1985–2010. Biomed Environ Sci 2013;26: 13–22 [DOI] [PubMed] [Google Scholar]
- 12.Tanner JM, Hayashi T, Preece MA, et al. Increase in length of leg relative to trunk in Japanese children and adults from 1957 to 1977: comparison with British and with Japanese Americans. Ann Hum Biol 1982;9:411–23 [DOI] [PubMed] [Google Scholar]
- 13.Victora CG, Barros FC. Commentary: the catch-up dilemma—relevance of Leitch's ‘low-high’ pig to child growth in developing countries. Int J Epidemiol 2001;30:217–20 [DOI] [PubMed] [Google Scholar]
- 14.Tedner SG, Ortqvist AK, Almqvist C. Fetal growth and risk of childhood asthma and allergic disease. Clin Exp Allergy 2012;42:1430–47 [DOI] [PMC free article] [PubMed] [Google Scholar]
- 15.Sevelsted A, Bisgaard H. Neonatal size in term children is associated with asthma at age 7, but not with atopic dermatitis or allergic sensitization. Allergy 2012;67:670–5 [DOI] [PubMed] [Google Scholar]
- 16.Pike KC, Crozier SR, Lucas JS, et al. Patterns of fetal and infant growth are related to atopy and wheezing disorders at age 3 years. Thorax 2010;65:1099–106 [DOI] [PMC free article] [PubMed] [Google Scholar]
- 17.Ferraz E, Garcia CA, Bettiol H, et al. Atopy risk factors at birth and in adulthood. J Pediatr (Rio J) 2011;87:336–42 [DOI] [PubMed] [Google Scholar]
- 18.Schooling CM, Jiang C, Lam TH, et al. Height, its components, and cardiovascular risk among older Chinese: a cross-sectional analysis of the Guangzhou Biobank Cohort Study. Am J Public Health 2007;97:1834–41 [DOI] [PMC free article] [PubMed] [Google Scholar]
- 19.Whitley E, Martin RM, Davey SG, et al. The association of childhood height, leg length and other measures of skeletal growth with adult cardiovascular disease: the Boyd-Orr cohort. J Epidemiol Community Health 2012;66:18–23 [DOI] [PubMed] [Google Scholar]
- 20.Asao K, Kao WH, Baptiste-Roberts K, et al. Short stature and the risk of adiposity, insulin resistance, and type 2 diabetes in middle age: the Third National Health and Nutrition Examination Survey (NHANES III), 1988–1994. Diabetes Care 2006;29:1632–7 [DOI] [PubMed] [Google Scholar]
- 21.Smits MM, Boyko EJ, Utzschneider KM, et al. Arm length is associated with type 2 diabetes mellitus in Japanese-Americans. Diabetologia 2012;55:1679–84 [DOI] [PMC free article] [PubMed] [Google Scholar]
- 22.Gunnell DJ, Davey SG, Frankel S, et al. Childhood leg length and adult mortality: follow up of the Carnegie (Boyd Orr) Survey of Diet and Health in Pre-war Britain. J Epidemiol Community Health 1998;52:142–52 [DOI] [PMC free article] [PubMed] [Google Scholar]
- 23.Lee CM, Barzi F, Woodward M, et al. Adult height and the risks of cardiovascular disease and major causes of death in the Asia-Pacific region: 21,000 deaths in 510,000 men and women. Int J Epidemiol 2009;38:1060–71 [DOI] [PubMed] [Google Scholar]
- 24.Morris DH, Jones ME, Schoemaker MJ, et al. Familial concordance for height and its components: analyses from the Breakthrough Generations Study. Am J Hum Biol 2012;24:22–7 [DOI] [PubMed] [Google Scholar]
- 25.Gray L, Davey SG, McConnachie A, et al. Parental height in relation to offspring coronary heart disease: examining transgenerational influences on health using the west of Scotland Midspan Family Study. Int J Epidemiol 2012;41:1776–85 [DOI] [PMC free article] [PubMed] [Google Scholar]
- 26.Linneberg A, Hertzum I, Husemoen LL, et al. Association between alcohol consumption and aeroallergen sensitization in Danish adults. Clin Exp Allergy 2006;36:714–21 [DOI] [PubMed] [Google Scholar]
- 27.Rasmussen SL, Torp-Pedersen C, Borch-Johnsen K, et al. Normal values for ambulatory blood pressure and differences between casual blood pressure and ambulatory blood pressure: results from a Danish population survey. J Hypertens 1998;16:1415–24 [DOI] [PubMed] [Google Scholar]
- 28.Andersen E, Hutchings B, Jansen J, et al. Højde og vægt hos danske børn. Ugeskr Laeger 1982;144:1760–5 [PubMed] [Google Scholar]
- 29.Linneberg A, Husemoen LL, Nielsen NH, et al. Screening for allergic respiratory disease in the general population with the ADVIA Centaur Allergy Screen Assay. Allergy 2006;61:344–8 [DOI] [PubMed] [Google Scholar]
- 30.Aadahl M, von Huth SL, Pisinger C, et al. Five-year change in physical activity is associated with changes in cardiovascular disease risk factors: the Inter99 study. Prev Med 2009;48:326–31 [DOI] [PubMed] [Google Scholar]
- 31.Andersen TF, Madsen M, Jorgensen J, et al. The Danish National Hospital Register. A valuable source of data for modern health sciences. Dan Med Bull 1999;46:263–8 [PubMed] [Google Scholar]
- 32.Juel K, Helweg-Larsen K. The Danish registers of causes of death. Dan Med Bull 1999;46:354–7 [PubMed] [Google Scholar]
- 33.Skovgaard LT, Andersen PK. Regression with linear predictors. Springer, 2010 [Google Scholar]
- 34.Pike KC, Calder PC, Inskip HM, et al. Maternal plasma phosphatidylcholine fatty acids and atopy and wheeze in the offspring at age of 6 years. Clin Dev Immunol 2012;2012:474613. [DOI] [PMC free article] [PubMed] [Google Scholar]
- 35.Almqvist C, Pershagen G, Wickman M. Low socioeconomic status as a risk factor for asthma, rhinitis and sensitization at 4 years in a birth cohort. Clin Exp Allergy 2005;35:612–18 [DOI] [PubMed] [Google Scholar]
- 36.Monteiro CA, Benicio MH, Conde WL, et al. Narrowing socioeconomic inequality in child stunting: the Brazilian experience, 1974–2007. Bull World Health Organ 2010;88:305–11 [DOI] [PMC free article] [PubMed] [Google Scholar]
- 37.Bjorge T, Sorensen HT, Grotmol T, et al. Fetal growth and childhood cancer: a population-based study. Pediatrics 2013;132:e1265–75 [DOI] [PMC free article] [PubMed] [Google Scholar]
- 38.Kitahara CM, Gamborg M, Berrington de GA, et al. Childhood height and body mass index were associated with risk of adult thyroid cancer in a large cohort study. Cancer Res 2014;74:235–42 [DOI] [PMC free article] [PubMed] [Google Scholar]
- 39.Cook MB, Gamborg M, Aarestrup J, et al. Childhood height and birth weight in relation to future prostate cancer risk: a cohort study based on the Copenhagen School Health Records Register. Cancer Epidemiol Biomarkers Prev 2013;22:2232–40 [DOI] [PMC free article] [PubMed] [Google Scholar]
- 40.Frankel S, Gunnell DJ, Peters TJ, et al. Childhood energy intake and adult mortality from cancer: the Boyd Orr Cohort Study. BMJ 1998;316:499–504 [DOI] [PMC free article] [PubMed] [Google Scholar]
- 41.Klein EA, Thompson IM, Jr, Tangen CM, et al. Vitamin E and the risk of prostate cancer: the Selenium and Vitamin E Cancer Prevention Trial (SELECT). JAMA 2011;306:1549–56 [DOI] [PMC free article] [PubMed] [Google Scholar]
- 42.Russell SL, Finlay BB. The impact of gut microbes in allergic diseases. Curr Opin Gastroenterol 2012;28:563–9 [DOI] [PubMed] [Google Scholar]
- 43.Johnson JB, Laub DR, John S. The effect on health of alternate day calorie restriction: eating less and more than needed on alternate days prolongs life. Med Hypotheses 2006;67:209–11 [DOI] [PubMed] [Google Scholar]
- 44.Kouda K, Tanaka T, Kouda M, et al. Low-energy diet in atopic dermatitis patients: clinical findings and DNA damage. J Physiol Anthropol Appl Human Sci 2000;19:225–8 [DOI] [PubMed] [Google Scholar]
- 45.Haldar P, Pavord ID, Shaw DE, et al. Cluster analysis and clinical asthma phenotypes. Am J Respir Crit Care Med 2008;178:218–24 [DOI] [PMC free article] [PubMed] [Google Scholar]
- 46.Scott HA, Gibson PG, Garg ML, et al. Airway inflammation is augmented by obesity and fatty acids in asthma. Eur Respir J 2011;38:594–602 [DOI] [PubMed] [Google Scholar]
- 47.Fenger RV, Gonzalez-Quintela A, Vidal C, et al. Exploring the obesity-asthma link: do all types of adiposity increase the risk of asthma? Clin Exp Allergy 2012;42:1237–45 [DOI] [PubMed] [Google Scholar]
- 48.Huovinen E, Kaprio J, Koskenvuo M. Factors associated to lifestyle and risk of adult onset asthma. Respir Med 2003;97:273–80 [DOI] [PubMed] [Google Scholar]
- 49.Salmond C, Crampton P, Hales S, et al. Asthma prevalence and deprivation: a small area analysis. J Epidemiol Community Health 1999;53:476–80 [DOI] [PMC free article] [PubMed] [Google Scholar]
- 50.Kelly HW, Sternberg AL, Lescher R, et al. Effect of inhaled glucocorticoids in childhood on adult height. N Engl J Med 2012;367:904–12 [DOI] [PMC free article] [PubMed] [Google Scholar]
- 51.Galobardes B, McCormack VA, McCarron P, et al. Social inequalities in height: persisting differences today depend upon height of the parents. PLoS One 2012;7:e29118. [DOI] [PMC free article] [PubMed] [Google Scholar]
Associated Data
This section collects any data citations, data availability statements, or supplementary materials included in this article.