

Abstract
Ewes treated prenatally with testosterone (T) develop metabolic deficits, including insulin resistance, in addition to reproductive dysfunctions that collectively mimic polycystic ovarian syndrome (PCOS), a common endocrine disease in women. We hypothesised that metabolic deficits associated with prenatal T excess involve alterations in arcuate nucleus (ARC) neurones that contain either agouti-related peptide (AgRP) or proopiomelanocortin (POMC). Characterization of these neurones in the ewe showed that immunoreactive AgRP and POMC neurones were present in separate populations in the ARC, that AgRP and POMC neurones co-expressed either neuropeptide Y or cocaine- and amphetamine-regulated transcript, respectively, and that each population had a high degree of colocalization with androgen receptors. Examination of the effect of prenatal T exposure on the number of AgRP and POMC neurones in adult ewes showed that prenatal T excess significantly increased the number of AgRP but, not POMC neurones compared to controls; this increase was restricted to the middle division of the ARC, was mimicked by prenatal treatment with dihydrotestosterone, a non-aromatizable androgen, and was blocked by co-treatment of prenatal T with the anti-androgen, flutamide. The density of AgRP fibre immunoreactivity in the preoptic area, paraventricular nucleus, lateral hypothalamus and dorsomedial hypothalamic nucleus was also increased by prenatal T exposure. Thus, ewes that were exposed to androgens during foetal life showed alterations in the number of AgRP-immunoreactive neurones and the density of fibre immunoreactivity in their projection areas, suggestive of permanent prenatal programming of metabolic circuitry that may, in turn, contribute to insulin resistance and increased risk of obesity in this model of PCOS.
Keywords: Sheep, Androgens, AgRP, POMC, PCOS
Introduction
Polycystic ovarian syndrome (PCOS) is a leading cause of infertility and the most prevalent infertility disorder seen in women of reproductive age (1–4). PCOS is characterised by a combination of reproductive and metabolic deficits, which include hyperandrogenemia, disrupted menstrual cycles and fertility complications, polycystic ovaries, hypersecretion of luteinizing hormone, reduced neuroendocrine steroid feedback, insulin resistance and accompanying hyperinsulinemia (1–4). PCOS is often associated with additional metabolic morbidities such as obesity, type II diabetes, and metabolic syndrome (5–7). Such relationships suggest that the etiology of PCOS may be intimately linked with the function of metabolic regulatory systems.
There is increasing evidence that prenatal exposure to excess testosterone (T) may be a contributing factor in the etiology of PCOS (8, 9). Supporting this hypothesis are studies showing that women with congenital disorders involving prenatal exposure to androgens, such as adrenal hyperplasia or adrenal virilizing tumors, are at increased risk of developing PCOS (10, 11). In addition, experimental research has shown that both female sheep and monkeys exposed in utero to excess levels of T develop reproductive and metabolic attributes in adulthood that are strikingly parallel to those seen in women with PCOS (8, 9, 12). In sheep, prenatal T excess leads to intrauterine growth restriction, postnatal catch up growth (13), impaired insulin sensitivity (14, 15), and hypertension (16), in addition to reproductive dysfunctions that are exacerbated by excess weight (17). Recently, we extended earlier physiologic studies focusing on neuroendocrine basis for reproductive deficits seen in female sheep exposed to excess prenatal T (18) to describe hypothalamic circuitry mediating gonadal feedback control of GnRH secretion (19). By contrast, underlying mechanisms responsible for metabolic deficits in the prenatal T-treated sheep model have not been previously explored.
Research in the neural control of food intake and metabolism has focused on two key subsets of neurones in the hypothalamus, neurones expressing either the agouti related peptide (AgRP) or proopiomelanocortin stimulating hormone (POMC). Both cell groups are located within the arcuate nucleus (ARC) of the hypothalamus and are largely responsible for stimulating and suppressing appetite, respectively (reviewed in (20)). POMC, a prohormone, is cleaved into a variety of peptides including melanocyte stimulating hormone, which acts directly to regulate appetite (21). Studies in rodents have shown that the majority of POMC expressing neurones co-express cocaine- and amphetamine-regulated transcript (CART) (22), also an appetite suppressing peptide, while the majority of AgRP expressing neurones co-express neuropeptide Y (NPY), which stimulates appetite (23). Leptin and insulin both function to reduce body weight (24, 25), and act on POMC and AgRP neurones, by activating and inhibiting them, respectively (22, 26–28). Together, these neurones function to maintain normal energy homeostasis; dysfunctions within this neural circuitry can lead to excessive weight loss or gain and altered metabolism, including leptin and/or insulin resistance.
In sheep, appetite regulatory peptides, AgRP, NPY, POMC and CART, are present in the hypothalamus and can be altered by exogenous factors during in utero development (29). In one study, pregnant ewes that were fed in excess produced offspring with increased mRNA levels of the gene encoding POMC in the hypothalamus (30). As such, the potential exists for appetite regulatory circuitry to be altered by prenatal factors, such as excess T exposure, which has an impact on growth trajectory (13). Furthermore, although POMC expressing neurones in sheep have been shown to express oestrogen receptor-alpha (ERα) (31), it is currently unknown whether they, or AgRP neurones, express androgen receptors (AR). Currently, the characterization of these neurones in the ewe, and whether androgens can act directly upon them, remains to be fully investigated.
We hypothesised that prenatal testosterone exposure affects the normal development of metabolic control neurones in the ARC of the ewe. This study had two main objectives: first, to characterise the distribution of AgRP and POMC expressing neurones in the female sheep hypothalamus and to determine whether these neurones possess features which would potentially enable them to be direct targets of androgen action; second, to determine whether prenatal T affects the number of immunoreactive AgRP or POMC neurones, and the density of immunoreactive fibres arising from these neurones. In addition, since prenatal T can permanently alter brain function by either its aromatization to oestrogen, or its reduction to dihydrotestosterone (DHT), we used co-treatment with flutamide (F), an anti-androgen, to determine whether any effects of prenatal T on metabolic circuitry were mediated by its androgenic action. In parallel, a separate group of animals were exposed to DHT to determine whether exposure to androgens alone would be sufficient to induce such changes. The results showed permanent and region-specific effects of prenatal androgens on the number of AgRP neurones and density of immunoreactive fibers, but not on POMC neurones, suggesting a potential basis for the long-lasting metabolic deficits produced by prenatal T exposure.
Materials and Methods
Animals Care and Treatment
Care of ewes, including nutrition, breeding and lambing, has been previously described (13, 32, 33). Animals were raised at the Sheep Research Facility at the University of Michigan (Ann Arbor, MI, 42° 18′N). Hormone treatments of ewes occurred in utero, given via the pregnant mother. During a 147 day gestational term pregnant ewes received treatment injections, each week, between days 30–90 of the term. Treatments included: T only (T, n=5), T and F co-treatment (T + F, n=4), and DHT only (DHT, n=4). Those assigned to the T group received two weekly injections of 100 mg T propionate (~1.2mg/kg; Sigma-Aldrich Corp., St. Louis, MO, USA), those assigned to T + F received T propionate as described, as well as 15 mg/kg F (Sigma-Aldrich) daily, and, finally, those assigned to DHT received two weekly injections of 100 mg dihydrotestosterone (DHT) propionate (Steraloids, Inc., Newport, RI, USA). In brief, both T and DHT treatments were given intramuscularly in 2 mL of cottonseed oil, while F was injected subcutaneously dissolved in dimethylsulfoxide (400mg/ml). Details of treatment and the impact of these prenatal treatments on neuroendocrine puberty have been previously described (34). Previous studies have demonstrated that the external genitalia of female ewes treated prenatally with T or DHT are masculinised, with a developed penis and empty scrotum (34). Control ewes (C, n=5) did not require vehicle, as previous experiments have demonstrated no difference between offspring of vehicle versus non-vehicle treated ewes (33). The final concentration of T in maternal and female fetuses was comparable to the range found in adult and foetal males (35). All animals used in the study barring two from singleton births came from twin pregnancies. In the case of twin births only one offspring from a given mother was used in the study.
At 3–4 weeks of age, all ewes were ovariectomised and received oestrogen implants to normalise the hormonal milieu, as previously described (34). The prenatal T-treated females showed similar growth trajectories to that of control lambs (36). Endocrine data from similar groups of control, T and DHT animals have been recently published (15) and showed higher basal insulin levels and increased insulin resistance in both T and DHT animals compared to control ewes, consistent with previous findings in prenatal T-treated female sheep in this model (14). All ewes were sacrificed at approximately one year, nine months of age during the breeding season. Briefly, animals were received hormonal implants designed to mimic an artificial follicular phase (37); animals for this study were intracranially perfused (see below) 22h after insertion of E2 implants, prior to the onset of the LH surge (37). All experimental procedures were approved by the University of Michigan Committee for the Use and Care of Animals and are consistent with National Research Council’s Guide for the Care and Use of Laboratory Animals.
Tissue Collection
Prior to sacrifice each animal received two intravenous injections of 25,000U heparin at 10 minute intervals. Ewes were then administered ~4000mg of intravenous sodium pentobarbital and sacrificed with rapid decapitation. Each head was perfused with 6L of 4% paraformaldehyde in 0.1M phosphate buffer (pH 7.3) mixed with 0.1% sodium nitrite and 10U/mL heparin, through the internal carotid artery. Brains were removed and stored in fixative solution at 4°C for 18 hours. A block of tissue containing the preoptic area and hypothalamus was removed, kept in 30% sucrose at 4°C to complete infiltration, and sectioned coronally using a freezing microtome into six parallel series (45μm slices) for each animal. Tissue was stored in cryoprotective solution (30% ethylene glycol, 1% polyvinylpyrrolidone, 30%sucrose in sodium phosphate buffer) at −20°C until processed for immunocytochemistry.
Experiment 1: Characterization of the AgRP and POMC Neurones
Dual-label immunofluorescence for AgRP/POMC, AgRP/NPY and POMC/CART
Tissue sections from the mediobasal hypothalamus of control ewes were used for these characterizations. All incubations were at room temperature; sections were free-floating under gentle agitation, and thoroughly rinsed with 0.1M phosphate buffered saline (PBS) between steps. Three sets of dual labeling were undertaken. In the first, tissue was immunoprocessed for both POMC and AgRP. The tissue was first blocked in incubation solution consisting of PBS with 0.4% Triton X-100 and 20% normal goat serum (NGS) (Jackson ImmunoResearch, West Grove, PA, USA) for one hour. Tissue was then incubated for 17 hours with primary antibodies diluted in incubation solution with 4% NGS: guinea pig anti-AgRP (1:1,000, Antibodies Australia, Cat. #GPAAGRP.1, Melbourne, Australia) and rabbit anti-POMC (1:4,000, Phoenix Pharmaceuticals, Cat. # H-029-30, Burlingame, CA, USA). Next, tissue was incubated with goat anti-guinea pig Alexa 488 and goat anti-rabbit Alexa 555 (each at 1:200, Molecular Probes, Inc., Eugene, OR, USA) consecutively for 30 minutes each. Finally, tissue was mounted onto positively charged slides and coverslipped with gelvatol (38). Additional tissue sections were immunoprocessed for both AgRP and NPY using the same protocol, with incubation of the primary antibodies: guinea pig anti-AgRP (1:1,000, Antibodies Australia) and rabbit anti-NPY (1:1,000, Diasorin, Cat. #22940, Stillwater, MN, USA). Respective secondary antibodies: goat anti-guinea pig Alexa 488 and goat anti-rabbit Alexa 555 (each at 1:200, Molecular Probes) were used.
Finally, additional brain sections were immunoprocessed for both POMC and CART. As both the POMC and CART primary antibodies were raised in rabbit, CART was visualised using a biotin-tyramide amplification procedure as described previously (39, 40). Tissue was incubated with 1% H2O2 for 10 minutes and with incubation solution containing 20% NGS for one hour, before incubation with rabbit anti-CART (17 hours; 1:80,000 in incubation solution with 4% NGS, Cat. # H-003-62, Phoenix Pharmaceuticals). Tissue was then incubated with biotinylated goat anti-rabbit IgG (1 hour; 1:500 in incubation solution with 4% NGS, Vector, Burlingame, CA, USA), ABC-elite (1 hour; 1:500 in PBS, Vector), biotinylated tyramine (10 minutes; 1:250 diluted in PBS with 1μl of 3% H202 per ml, Elmer Life Sciences, Boston, MA, USA), and Alexa 555 conjugated streptavidin (30 minutes; 1:100, Invitrogen, Carlsbad, CA, USA). Subsequently, tissue was incubated with rabbit anti-POMC (17 hours; 1:4,000 in incubation solution, Phoenix Pharmaceuticals), followed by goat anti-rabbit 488 (30 minutes; 1:500 in PBS, Molecular Probes). Controls included preabsorption with immunizing peptides (see below), or omission of primary antibodies, all of which eliminated staining in the appropriate wavelength.
Dual-label immunoperoxidase staining for AR/AgRP and AR/POMC
Two series of tissue sections from the mediobasal hypothalamus of control ewes (n=3) were immunoprocessed for AgRP, POMC and AR. As described above, all incubations were at room temperature; sections were free floating under gentle agitation, and thoroughly rinsed with 0.1M PBS between steps. The tissue was first blocked in incubation solution consisting of PBS with 0.4% Triton X-100 and 20% NGS (Jackson ImmunoResearch) for one hour. Tissue was then incubated with rabbit antiAR antibody (40 hours; 1:200 in incubation solution, Cat. # sc-816, Santa Cruz, CA, USA), biotinylated goat anti-rabbit IgG (1 hour; 1:250, Vector) and ABC-elite (1 hour; 1:250, Vector). Nuclear AR staining was visualised with 0.02% 3, 3′-diaminobenzidine tetrahydrochoride (DAB, Sigma), 0.08% nickel sulfate and 0.012% H2O2. Next, tissue was incubated with either guinea pig anti-AgRP antibody (17 hours; 1:5,000 in incubation solution with 4% NGS, Antibodies Australia), or rabbit anti-POMC antibody (17 hours; 1:120,000 in incubation solution with 4% NGS, Phoenix Pharmaceuticals), with secondary goat anti-guinea pig or goat anti-rabbit IgG (1 hour; 1:500, Vector) and ABC-elite (1 hour; 1:500, Vector). Reaction product for AgRP or POMC was visualised with DAB containing 0.012% H2O2 (10 minutes, diluted in PB). Sections were mounted onto Superfrost/Plus Microscope Slides (Fisher), dehydrated and cover-slipped with Depex Mountant. Controls included preabsorption with immunizing peptides (see below), which eliminated all staining.
Analysis
Fluorescent images of sections dual-labelled for AgRP/POMC, AgRP/NPY, and POMC/CART were captured with Leica DM5000B microscope and Leica DFC340fx camera. Each AgRP- or POMC-immunoreactive neurone through the entire mediobasal hypothalamus was examined for co-expression of nuclear AR, and percentage of AGRP and POMC cells expressing AR was calculated for each animal. Brightfield images were captured using Leica DM5000B microscope and Leica DFC420 camera.
Experiment 2: The Effect of Prenatal Androgens on AgRP and POMC Neurones
AgRP and POMC Cell Counts
Parallel series of tissue sections containing the preoptic area and hypothalamus from control, T, T + F, and DHT-treated groups were processed simultaneously for single-label immunocytochemical detection of AGRP or POMC. Again, all incubations were at room temperature; sections were free floating under gentle agitation, and thoroughly rinsed with 0.1M PBS between steps. Tissue was first blocked in incubation solution consisting of PBS with 0.4% Triton X-100 and 20% NGS (Jackson ImmunoResearch) for one hour, and then with guinea pig anti-AgRP (1:5,000, Antibodies Australia) or rabbit anti-POMC (1:40,000, Phoenix Pharmaceuticals) and DAB to visualise reaction products.
Analysis
The number of immunoreactive neurones was counted in sections through the level of the rostral, middle, and caudal ARC (n=3 sections/level) in each animal using Neurolucida© software (Microbrightfield Inc., city, USA). Repeated measures analysis of variance was used to test treatment differences and differences between rostro-caudal levels. Bonferroni correction was used to control type I error in post hoc tests.
To analyse the density of AgRP immunoreactivity in projection areas, images (n=3–4 images per animal/area of interest) were taken from the preoptic area (POA, 900×900 pixels, 150 threshold, exposure 13.05 ms), paraventricular nucleus (PVN, 800×800 pixels, 140 threshold, exposure 18.46 ms), dorsomedial hypothalamus (DMH, 1280×1024 pixels, 170 threshold, exposure 13.05 ms), and lateral hypothalamus (LH, 800×800 pixels, 185 threshold, exposure 13.05 ms) under brightfield illumination using an Optronics© camera and Neurolucida© software. All images were taken using the same magnification and camera settings. The density of immunoreactive fibres was measured using ImageJ© software (NIH, Bethesda, USA) with a fixed threshold. Mean densities were calculated for each area in each animal, and used to calculate the group means for each region. Repeated measures analysis of variance was used to test treatment differences and difference between brain regions. Bonferroni correction was used to control type I error in post hoc tests.
Immunocytochemical controls
Pre-absorption of the diluted primary antibodies for POMC and CART with their respective peptide antigens (Phoenix Pharmaceuticals) at concentrations of 1μg/mL and 10μg/mL for 24 h at 4° C eliminated all immunostaining corresponding to the appropriate antibody. Similarly, pre-absorption of AR antibody with its peptide antigen (Santa Cruz) at concentration of 1 μg/ml yielded no immunoreactive staining. AgRP antibody specificity has been previously confirmed by preabsorption of the antisera with 0.5mg/ml of the peptide, which also abolished staining in the ovine ARC (41). The NPY antibody (Diasorin) used in this study has been previously characterised and produces bands on Western blots at the appropriate size for this peptide (42).
Results
Distribution and characterization of AgRP and POMC neurones
AgRP- and POMC-immunoreactive cells were seen in two separate and distinct populations of neurones within the ARC of the ovine hypothalamus (Fig. 1). While the distribution of AgRP and POMC neurones overlapped within the ARC, POMC neurones were scattered more laterally and dorsally compared with the AgRP neurones, which were located in more medial and periventricular locations (Fig. 2). A small number of both AgRP and POMC neurones extended ventromedially into the internal zone of the median eminence (Fig. 2). Nearly all (>95%) AgRP-immunoreactive neurones in the ARC also contained NPY (Fig. 1). Similarly, a large majority (83%) of POMC-immunoreactive neurones colocalised CART (Fig. 1).
Figure 1.

Immunofluorescent detection of agouti-related peptide (AgRP), proopiomelanocortin (POMC), neuropeptide Y (NPY) and cocaine- and amphetamine- regulated transcript (CART) in the arcuate nucleus of control ewes. AgRP and POMC expressing neurones formed separate and distinct subpopulations in the ARC (top row), while AgRP and NPY (middle row) and POMC and CART (bottom row) were colocalised in the same neurones. Scale bar = 20μm.
Figure 2.

Illustrations created using Neurolucida© depicting the rostral (top) to caudal (bottom) distribution of AgRP (A) and POMC neurones (B) within rostral, middle and caudal levels (top to bottom) of the arcuate nucleus in control ewes. Individual, immunolabelled neurones are shown as filled circles. Abbreviations: Fornix (f), mamillary recess (mr), mammillothalamic tract (mt), median eminence (me), optic tract (ot), third ventricle (3v).
Colocalization of AgRP and POMC neurones with androgen receptor
Sections through the ARC double-labelled for AR and either AgRP or POMC revealed extensive co-localization of AR with both cell types. In control ewes (n=3), the mean percentage (±SEM) of AgRP neurones throughout the entire ARC which also contained AR was 78.2±2.3 (Fig. 3A), while a slightly smaller percentage of POMC-immunoreactive neurones, 64.6±8.3, were found to colocalise AR (Fig. 3B). We saw no differences in the percentage of colocalization between AgRP or POMC cells located at different rostral-caudal levels of the ARC (data not shown). However, at each level, AgRP and POMC neurones which colocalised AR were predominantly located medially within the ARC, while those which contained solely AgRP or POMC were located more laterally.
Figure 3.
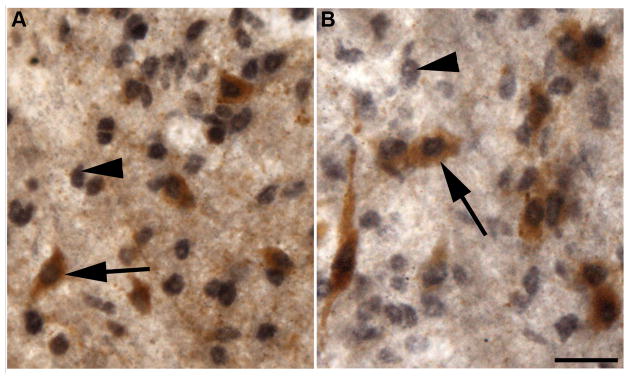
Examples of colocalization of androgen receptors within AgRP (A) and POMC (B) neurones in control ewes. AR expressing neurones are identified by black nuclear staining; both single-(arrowheads) and dual-(arrows) labelled neurones can be seen. Scale bar = 20μm.
Effects of prenatal androgens on AgRP and POMC neurones
There was a significant interaction between treatment and rostral-caudal subdivisions of the ARC (p<0.01), indicating that the effect of prenatal androgens differed among subdivisions. Further comparison between treatment groups within each subdivision showed a significant treatment effect only in the middle subdivision of the ARC (p<0.01) and not in the caudal (p=0.74) or rostral divisions (p=0.85). Further post hoc tests in the middle subdivision showed that prenatal T treatment significantly increased the mean number of AgRP-immunoreactive neurones in the middle ARC, (control: 107.57 ± 15.10; mean ± SEM, prenatal T: 251.00 ± 17.04; p<0.01)(Fig. 4A). Co-treatment of prenatal T with an anti-androgen, F, significantly reduced the number of AgRP-immunoreactive neurones when compared with ewes treated with T only (168.75 ± 26.55; p<0.01); however, this number was also significantly higher compared to control ewes (p=0.02) (Fig. 4A). Finally, ewes treated with prenatal DHT also showed a significantly greater number of AgRP-immunoreactive neurones in the middle ARC (215.75 ± 17.63; p<0.01) (Fig. 4A). Thus, at the level of the middle ARC, both T and DHT treatments increased the number of AgRP neurones compared to controls, while co-treatment with F partially blocked the effect of T alone (Fig. 4B).
Figure 4.

Numbers of AgRP and POMC-positive neurones at the level of the rostral, middle and caudal arcuate nucleus. Treatment groups include untreated control (C), testosterone (T), testosterone and flutamide (T+F), and dihydrotestosterone (DHT). Graphs illustrate the mean (±SEM) number of AgRP (A) or POMC (C) expressing neurones. (*) indicates significant difference from control (p<0.01), (#) indicates significant difference from T (p<0.01). B and D show representative low power (5X magnification) images of AgRP and POMC neurones from the middle arcuate of control and experimental animals. Scale bar = 200μm.
In contrast to the effects of prenatal T and DHT on AgRP neurones, we found no significant differences in the number of POMC-immunoreactive neurones between any of the treatment groups at any level of the arcuate nucleus (Fig. 4C, D). There was no significant treatment and subdivision interaction, and no treatment effect (p=0.49).
Because of the changes we observed in AgRP cell number in prenatal T-treated ewes, we analysed the density of AgRP fibre immunoreactivity in four projection areas known to be implicated in energy balance and appetite regulation: the POA, PVN, LH, and DMH (Fig. 5). There was no significant interaction between treatment and brain region, but significant treatment (p<0.01) and brain region (p<0.01) differences, indicating that the treatment effect did not differ between subdivisions. Further post hoc tests showed that prenatal T-treated ewes exhibited a significantly higher density of AgRP fibre immunoreactivity compared with control animals (p<0.01; Fig. 6A–E). Animals receiving the T+F treatment showed a significant decrease in density of AgRP fibre immunoreactivity compared with those receiving T only (p<0.01) and did not differ from control ewes (p=0.52). A trend was seen towards increased density of AgRP fibre immunoreactivity in DHT-treated ewes in comparison with control ewes but these differences did not reach significance (p=0.053).
Figure 5.

Low and high power views of AgRP fibres in the ovine preoptic area (POA) (A), paraventricular nucleus (PVN) (B), dorsomedial hypothalamus (DMH) (C), and lateral hypothalamus (LH) (D) from control ewes. Black square indicates the approximate areas from which images were captured for analysis. Inset - higher magnification of each area of interest. Abbreviations: anterior commissure (ac), fornix (f), mammillothalamic tract (mt), median eminence (me) optic chiasm (oc), optic tract (ot), suprachiasmatic nucleus (SCN), ventromedial hypothalamus (vmh), third ventricle (3v). Scale bar = 1mm.
Figure 6.

Measurements of AgRP fibre density in the preoptic area (POA) (A), paraventricular nucleus (PVN) (B), lateral hypothalamus (LH) (C), and the dorsomedial hypothalamus (DMH) (D). Optical densities were measured as percentage of area above threshold level (see Methods). Treatment groups include untreated control (C), testosterone (T), testosterone and flutamide (T+F), and dihydrotestosterone (DHT) animals. (*) indicates significant difference from control (p<0.01) and T+F groups (p<0.01). E shows representative images (10X magnification) from the DMH of each treatment group. Scale bar = 100μm.
Discussion
The results from this study present novel evidence suggesting that metabolic control neurones of the ARC are influenced by exposure to prenatal androgens. Specifically, we found that prenatal T treated ewes have altered AgRP neurones in a restricted level of the ARC nucleus, while POMC neurones throughout the ARC were unaffected. The effect of prenatal T on AgRP neurones was reflected by changes in both the number of AgRP-immunoreactive neurones and the density of AgRP-immunoreactive fibres in areas of the hypothalamus implicated in energy balance and regulation. Notably, these differences were found in the adult ewe, suggesting a permanent alteration in this metabolic circuitry as a result of prenatal androgen exposure.
Characterization of AgRP/NPY and POMC/CART Neurones
The first objective of this study was to characterise the distribution pattern of AgRP- and POMC-containing neurones in the adult ewe. In rodents, AgRP and POMC are expressed in two separate populations, with AgRP neurones colocalising another orexigenic peptide, NPY (23), whereas POMC neurones colocalise another anorexigenic peptide, CART (43). Thus, two distinct cell types exist: AgRP/NPY neurones, which act to stimulate appetite, and POMC/CART neurones, which act to suppress appetite. AgRP/NPY and POMC/CART neurones have also been shown to express receptors for both insulin and leptin (22, 26, 27, 44). In sheep, this system has not been as widely explored. In rams, POMC mRNA has been found to be co-localised with CART mRNA, however, no evidence exists to describe co-localization of AgRP and NPY in this species, although NPY is co-localised with the leptin receptor consistent with its role as a metabolic control neurone (45, 46). Our present observations extend this work, and confirm that co-localisation of AgRP/NPY and POMC/CART is conserved in a majority of neurones in the adult ewe. Further, as in the rodent brain, AgRP/NPY and POMC/CART neurones are present as completely distinct and separate subpopulations of the ARC although they largely overlap in location within the nucleus.
The role of gonadal steroid hormones in the development and function of this metabolic circuitry remains to be fully characterised. Gender differences exist in the neural control of energy balance; for example, females and males differ in their sensitivity to insulin and leptin (47, 48). POMC neurones, specifically, have been shown to respond in a sexually dimorphic manner to leptin (49). Previous studies have shown the potential for a direct action of estradiol on POMC/CART neurones, as well as AgRP/NPY neurones, since each of these cell types express ERα (31, 50). However, the role of androgenic steroid hormones on the physiology and functions of AgRP/NPY and POMC/CART neurones has not been explored.
Our results demonstrate that the majority of both AgRP/NPY and POMC/CART neurones in the arcuate express AR, suggesting a possible substrate through which T may directly influence energy balance in the ewe at the level of the hypothalamus. Colocalization of AR within AgRP neurones has not previously been described, however, our findings with respect to AR/POMC colocalization are in contrast to a previous study in the rat where only 3% of POMC/CART neurones were found to co-express AR (51). Several factors may account for this discrepancy, including the fact that the earlier work used male rats, employed colchicine injections to enhance peptide detection, and identified POMC neurones by immunodetection of β-endorphin (βEND) rather than POMC. Hence differences in gender, species, protocol pre-treatment, and peptide marker may have each contributed to the differences between these results.
Prenatal Programming of Metabolic Circuitry by Testosterone
The concept of prenatal programming of adult disease (52) suggests that factors present in utero can have long lasting effects on the organism, which increase the risk of disease later in life. Appetite regulatory peptides, as well as leptin receptors, are expressed in the ARC of the sheep hypothalamus before birth (29), and their expression can be altered by exogenous factors, such as maternal nutritional intake, during development (29, 30). Furthermore, AR mRNA is present in the POA and hypothalamus of the foetal sheep at day 64 of gestation (53), although the precise cell types in which it is expressed have not yet been identified. The presence of AgRP/NPY, POMC/CART, and AR during this critical developmental stage allows the opportunity for reprogramming by prenatal T excess.
Our results suggest that prenatal T indeed programmes this metabolic circuitry, as we found that adult ewes that were treated prenatally with T showed alterations in the number of AgRP-containing neurones, and the density of their immunoreactive fibres, when compared to untreated animals. This study does not address potential alterations in NPY, CART, AR or leptin receptors, all of which, as mentioned above, also hold the potential for prenatal programming of metabolic function. Although we have focused on AgRP, it is possible that alterations involving multiple peptides/receptors may be implicated in the metabolic phenotype seen in our animal model.
We do not know whether the prenatal T-induced increase in AgRP cell number we observed is due to an increase in AgRP peptide expression resulting in greater numbers of immunodetectable cells, or to alterations in either cell death and/or proliferation during development. Similarly, the changes we observed in the density of AgRP-immunoreactive fibres may reflect either increased peptide content and/or increased numbers of fibres. Recent observations of KNDy neurones, a neighboring subset of ARC neurones which co-express three neuropeptides, kisspeptin (Kiss), neurokinin B (NKB) and dynorphin (DYN), may be relevant to this issue: prenatal T, in the same paradigm as used here, decreases NKB and DYN in this subpopulation while expression of Kiss in the same cells remains unchanged (19). This suggests that prenatal T does not affect neuronal survival, but rather the level of peptide expression in individual cells, which may also be true of AgRP/NPY subpopulation. In rats, however, a greater number of NPY mRNA expressing neurones are found in the ARC of male brains in comparison to females, suggesting a sex difference in the absolute number of AgRP/NPY neurones (54). Additional studies in sheep to determine whether prenatal T influences both mRNA and peptide levels of AgRP and NPY, as well as a comparison between rams and ewes, may help to resolve this question.
T can be either aromatised to oestrogen or reduced to DHT, and thus may exert its effect on AgRP neurones through an oestrogenic or androgenic action. T and DHT both act on the androgen receptor, with DHT having a more potent effect than T. In this study, to differentiate between the oestrogenic and androgenic effects of prenatal T, one group of pregnant ewes was co-treated with both prenatal T and the anti-androgen, Flutamide. Flutamide is a drug commonly used in the treatment of prostate cancer as well as androgen excess syndromes in women, where it acts to effectively bind the androgen receptor, blocking the actions of both T and DHT (55). We found that co-treatment with Flutamide blocked the increase in number of AgRP-immunoreactive neurones, suggesting that prenatal T exerts its action on AgRP neurones predominantly through androgenic rather than oestrogenic pathways. DHT treatment mimicked that of T treatment, providing further support for the androgenic action of prenatal T. These effects of T and DHT on AgRP neurones parallel those recently reported on metabolic endocrine defects in the same model, where the effects of prenatal T on insulin resistance were mimicked by prenatal DHT treatment (15). However, it should be noted that in the prenatal T exposed ewe some reproductive defects arise from the aromatization of T to estrogen (56–58). In contrast to effects at the level of AgRP cell bodies, DHT treatment did not significantly increase the density of AgRP fibre immunoreactivity in target areas of these neurones. Thus, we cannot rule out the contributions from oestrogenic actions of T on all aspects of prenatal T-induced changes in metabolic control circuitry, and further work will be needed to resolve this issue.
The effects of prenatal T on the number of AgRP-immunoreactive neurones were restricted to cells at the level of the middle ARC, and were not seen in either rostral or caudal subdivisions of the nucleus. It is currently unknown whether there are functional differences between the AgRP/NPY neurones at different levels of the ARC. A rostral-caudal difference has been found in the colocalization of ERα in NPY neurones in ewes, with 3% of NPY neurones co-expressing ERα in the rostral ARC and 10% in the caudal ARC (50). Our results, however, did not reveal any significant regional differences in the percentage of AR/AgRP or AR/POMC colocalization within the ARC. AgRP neurones located at different rostral-caudal levels may differ in their pattern of efferent projections; although we found a significant prenatal T-induced increase in the density of fibre immunoreactivity in each of the areas analyzed (POA, PVN, LH, DMH), we did not examine all areas containing AgRP fibres, and it may be that AgRP neurones of the middle ARC share a pattern of efferents that distinguishes them from either rostral or caudal neurones.
In each of the four areas we analyzed (POA, PVN, LH and DMH), ewes that received prenatal T treatments possessed a higher density of AgRP fibre immunoreactivity compared to controls. Possible explanations for this increase in the density of immunoreactive fibres include an increase in transport of AgRP peptide towards terminals, a decrease in AgRP release and subsequent accumulation of immunoreactive peptide, or morphological changes in the absolute number of AgRP fibers. If the increased density of immunoreactivity correlates with an increase in peptide release, it would be worthwhile in the future to determine whether prenatal T has any effect on the postsynaptic receptors for AgRP, namely the melanocortin 4 receptor, which is found in the ARC, POA, PVN, DMH, and LH regions (59, 60). While prenatal T increased the density of fibre immunoreactivity in each of the AgRP target regions examined, DHT treatment did not completely mimic this effect suggesting that in addition to androgenic effects, part of the influence of prenatal T on AgRP expression may be conveyed by its aromatization to estradiol (see above).
AgRP, Insulin & PCOS
As AgRP plays an important role in the control of energy balance and body weight, the increased number of AgRP-immunoreactive neurones in the prenatal T-treated ewes may be a factor contributing to the metabolic dysfunction in these animals. AgRP neurones respond to increased levels of circulating leptin and insulin by decreasing AgRP expression, contributing to the normal homeostatic control of body weight and metabolism (reviewed in (61)). Thus, one possible explanation for the insulin resistance exhibited by prenatal T animals (14) may be the inability to respond to circulating insulin by decreasing AgRP gene expression. Preliminary evidence in our lab suggests that AgRP neurones in the sheep ARC contain insulin receptors, and it may be that the increased AgRP cell number seen in the middle ARC is due to decreased insulin receptor colocalisation within that subpopulation. Further studies are needed to determine whether the expression of insulin and/or leptin receptors, or components of their intracellular signalling pathways, are altered in the hypothalamus following prenatal T exposure.
Reduced insulin sensitivity is highly prevalent in women with PCOS and contributes to the high risk of type II diabetes seen in this population. Adolescent girls with PCOS are significantly more likely to exhibit symptoms of the metabolic syndrome than their peers, and this risk is increased with the presence of hyperandrogenemia (62). Weight gain in both prenatal T-treated ewes (17) and PCOS women (63) appears to correlate with ovulatory dysfunction. Elucidating the role of prenatal androgens in programming metabolic circuitry is therefore critical in understanding the mechanistic basis for the association between PCOS and metabolic syndrome. The present results reveal a new role for prenatal androgen in programming metabolic neuronal circuitry in an animal model of PCOS, the prenatal T-treated ewe. The ability of prenatal T to alter the number of AgRP neurones and the density of their immunoreactive fibres, along with the colocalization of AR in these neurones, suggests that androgens may act directly on these and perhaps other metabolic control neurones during development to permanently alter their structure and function.
Acknowledgments
We are grateful to: Mr. Douglas Doop for assistance with breeding/lambing, his expert and conscientious animal care, and Sheep Facility management; Dr. Douglas Foster for the generation of the steroid-treated animals as part of his investigations centering on sexual differentiation of the brain; Dr. Leslie Jackson and Ms. Katie Timmer for assistance with prenatal steroid treatment and procurement of tissues; Dr. Theresa M. Lee for assistance with procurement of brains, Dr. Guanliang Cheng for technical assistance in the performance of this study, and Dr. Wen Ye for help with the statistical analyses. This research was supported by NIH R01 HD041098 to V.P. and P01 HD044232 to V.P. and M.N.L.
Footnotes
Disclosure Summary: The authors have nothing to disclose
References
- 1.Azziz R, Carmina E, Dewailly D, Diamanti-Kandarakis E, Escobar-Morreale HF, Futterweit W, Janssen OE, Legro RS, Norman RJ, Taylor AE, Witchel SF. The Androgen Excess and PCOS Society criteria for the polycystic ovary syndrome: the complete task force report. Fertil Steril. 2009;91(2):456–88. doi: 10.1016/j.fertnstert.2008.06.035. [DOI] [PubMed] [Google Scholar]
- 2.Franks S. Polycystic ovary syndrome. Trends Endocrinol Metab. 1989;1(2):60–3. doi: 10.1016/1043-2760(89)90003-9. [DOI] [PubMed] [Google Scholar]
- 3.Blank SK, McCartney CR, Marshall JC. The origins and sequelae of abnormal neuroendocrine function in polycystic ovary syndrome. Hum Reprod Update. 2006;12(4):351–61. doi: 10.1093/humupd/dml017. [DOI] [PubMed] [Google Scholar]
- 4.Dunaif A. Insulin resistance and the polycystic ovary syndrome: mechanism and implications for pathogenesis. Endocr Rev. 1997;18(6):774–800. doi: 10.1210/edrv.18.6.0318. [DOI] [PubMed] [Google Scholar]
- 5.Barber TM, McCarthy MI, Wass JA, Franks S. Obesity and polycystic ovary syndrome. Clin Endocrinol (Oxf) 2006;65(2):137–45. doi: 10.1111/j.1365-2265.2006.02587.x. [DOI] [PubMed] [Google Scholar]
- 6.Essah PA, Nestler JE. The metabolic syndrome in polycystic ovary syndrome. J Endocrinol Invest. 2006;29(3):270–80. doi: 10.1007/BF03345554. [DOI] [PubMed] [Google Scholar]
- 7.Hart R, Norman R. Polycystic ovarian syndrome--prognosis and outcomes. Best Pract Res Clin Obstet Gynaecol. 2006;20(5):751–78. doi: 10.1016/j.bpobgyn.2006.04.006. [DOI] [PubMed] [Google Scholar]
- 8.Abbott DHDD, Levine JE, Dunaif A, Padmanabhan V. Animal models and fetal programming of PCOS. Contemporary Endocrinology. 2006:2259–72. [Google Scholar]
- 9.Padmanabhan V, Manikkam M, Recabarren S, Foster D. Prenatal testosterone excess programs reproductive and metabolic dysfunction in the female. Mol Cell Endocrinol. 2006;246(1–2):165–74. doi: 10.1016/j.mce.2005.11.016. [DOI] [PubMed] [Google Scholar]
- 10.Barnes RB, Rosenfield RL, Ehrmann DA, Cara JF, Cuttler L, Levitsky LL, Rosenthal IM. Ovarian hyperandrogynism as a result of congenital adrenal virilizing disorders: evidence for perinatal masculinization of neuroendocrine function in women. The Journal of clinical endocrinology and metabolism. 1994;79(5):1328–33. doi: 10.1210/jcem.79.5.7962325. [DOI] [PubMed] [Google Scholar]
- 11.Phocas I, Chryssikopoulos A, Sarandakou A, Rizos D, Trakakis E. A contribution to the classification of cases of non-classic 21-hydroxylase-deficient congenital adrenal hyperplasia. Gynecol Endocrinol. 1995;9(3):229–38. doi: 10.3109/09513599509160451. [DOI] [PubMed] [Google Scholar]
- 12.Dumesic DA, Abbott DH, Padmanabhan V. Polycystic ovary syndrome and its developmental origins. Rev Endocr Metab Disord. 2007;8(2):127–41. doi: 10.1007/s11154-007-9046-0. [DOI] [PMC free article] [PubMed] [Google Scholar]
- 13.Manikkam M, Crespi EJ, Doop DD, Herkimer C, Lee JS, Yu S, Brown MB, Foster DL, Padmanabhan V. Fetal programming: prenatal testosterone excess leads to fetal growth retardation and postnatal catch-up growth in sheep. Endocrinology. 2004;145(2):790–8. doi: 10.1210/en.2003-0478. [DOI] [PubMed] [Google Scholar]
- 14.Recabarren SE, Padmanabhan V, Codner E, Lobos A, Duran C, Vidal M, Foster DL, Sir-Petermann T. Postnatal developmental consequences of altered insulin sensitivity in female sheep treated prenatally with testosterone. American journal of physiology. 2005;289(5):E801–6. doi: 10.1152/ajpendo.00107.2005. [DOI] [PubMed] [Google Scholar]
- 15.Padmanabhan V, Veiga-Lopez A, Abbott DH, Recabarren SE, Herkimer C. Developmental programming: impact of prenatal testosterone excess and postnatal weight gain on insulin sensitivity index and transfer of traits to offspring of overweight females. Endocrinology. 2010;151(2):595–605. doi: 10.1210/en.2009-1015. [DOI] [PMC free article] [PubMed] [Google Scholar]
- 16.King AJ, Olivier NB, Mohankumar PS, Lee JS, Padmanabhan V, Fink GD. Hypertension caused by prenatal testosterone excess in female sheep. American journal of physiology. 2007;292(6):E1837–41. doi: 10.1152/ajpendo.00668.2006. [DOI] [PubMed] [Google Scholar]
- 17.Steckler TL, Herkimer C, Dumesic DA, Padmanabhan V. Developmental Programming: excess weight gain amplifies the effects of prenatal testosterone excess on reproductive cyclicity -implication to PCOS. Endocrinology. 2008 doi: 10.1210/en.2008-1256. [DOI] [PMC free article] [PubMed] [Google Scholar]
- 18.Foster DL, Jackson LM, Padmanabhan V. Programming of GnRH feedback controls timing puberty and adult reproductive activity. Mol Cell Endocrinol. 2006:254–255. 109–19. doi: 10.1016/j.mce.2006.04.004. [DOI] [PubMed] [Google Scholar]
- 19.Cheng G, Coolen LM, Padmanabhan V, Goodman RL, Lehman MN. The kisspeptin/neurokinin B/dynorphin (KNDy) cell population of the arcuate nucleus: sex differences and effects of prenatal testosterone in sheep. Endocrinology. 2010;151(1):301–11. doi: 10.1210/en.2009-0541. [DOI] [PMC free article] [PubMed] [Google Scholar]
- 20.Cone RD. Anatomy and regulation of the central melanocortin system. Nat Neurosci. 2005;8(5):571–8. doi: 10.1038/nn1455. [DOI] [PubMed] [Google Scholar]
- 21.Mountjoy KG, Wong J. Obesity, diabetes and functions for proopiomelanocortin-derived peptides. Molecular and cellular endocrinology. 1997;128(1–2):171–7. doi: 10.1016/s0303-7207(96)04017-8. [DOI] [PubMed] [Google Scholar]
- 22.Elias CF, Lee C, Kelly J, Aschkenasi C, Ahima RS, Couceyro PR, Kuhar MJ, Saper CB, Elmquist JK. Leptin activates hypothalamic CART neurons projecting to the spinal cord. Neuron. 1998;21(6):1375–85. doi: 10.1016/s0896-6273(00)80656-x. [DOI] [PubMed] [Google Scholar]
- 23.Hahn TM, Breininger JF, Baskin DG, Schwartz MW. Coexpression of Agrp and NPY in fasting-activated hypothalamic neurons. Nat Neurosci. 1998;1(4):271–2. doi: 10.1038/1082. [DOI] [PubMed] [Google Scholar]
- 24.Halaas JL, Gajiwala KS, Maffei M, Cohen SL, Chait BT, Rabinowitz D, Lallone RL, Burley SK, Friedman JM. Weight-reducing effects of the plasma protein encoded by the obese gene. Science (New York, NY. 1995;269(5223):543–6. doi: 10.1126/science.7624777. [DOI] [PubMed] [Google Scholar]
- 25.Woods SC, Lotter EC, McKay LD, Porte D., Jr Chronic intracerebroventricular infusion of insulin reduces food intake and body weight of baboons. Nature. 1979;282(5738):503–5. doi: 10.1038/282503a0. [DOI] [PubMed] [Google Scholar]
- 26.Benoit SC, Air EL, Coolen LM, Strauss R, Jackman A, Clegg DJ, Seeley RJ, Woods SC. The catabolic action of insulin in the brain is mediated by melanocortins. J Neurosci. 2002;22(20):9048–52. doi: 10.1523/JNEUROSCI.22-20-09048.2002. [DOI] [PMC free article] [PubMed] [Google Scholar]
- 27.Hakansson ML, Brown H, Ghilardi N, Skoda RC, Meister B. Leptin receptor immunoreactivity in chemically defined target neurons of the hypothalamus. J Neurosci. 1998;18(1):559–72. doi: 10.1523/JNEUROSCI.18-01-00559.1998. [DOI] [PMC free article] [PubMed] [Google Scholar]
- 28.Sato I, Arima H, Ozaki N, Watanabe M, Goto M, Hayashi M, Banno R, Nagasaki H, Oiso Y. Insulin inhibits neuropeptide Y gene expression in the arcuate nucleus through GABAergic systems. J Neurosci. 2005;25(38):8657–64. doi: 10.1523/JNEUROSCI.2739-05.2005. [DOI] [PMC free article] [PubMed] [Google Scholar]
- 29.Muhlhausler BS, McMillen IC, Rouzaud G, Findlay PA, Marrocco EM, Rhind SM, Adam CL. Appetite regulatory neuropeptides are expressed in the sheep hypothalamus before birth. Journal of neuroendocrinology. 2004;16(6):502–7. doi: 10.1111/j.1365-2826.2004.01197.x. [DOI] [PubMed] [Google Scholar]
- 30.Muhlhausler BS, Adam CL, Findlay PA, Duffield JA, McMillen IC. Increased maternal nutrition alters development of the appetite-regulating network in the brain. FASEB J. 2006;20(8):1257–9. doi: 10.1096/fj.05-5241fje. [DOI] [PubMed] [Google Scholar]
- 31.Lehman MN, Karsch FJ. Do gonadotropin-releasing hormone, tyrosine hydroxylase-, and beta-endorphin-immunoreactive neurons contain estrogen receptors? A double-label immunocytochemical study in the Suffolk ewe. Endocrinology. 1993;133(2):887–95. doi: 10.1210/endo.133.2.8102098. [DOI] [PubMed] [Google Scholar]
- 32.Manikkam M, Steckler TL, Welch KB, Inskeep EK, Padmanabhan V. Fetal programming: prenatal testosterone treatment leads to follicular persistence/luteal defects; partial restoration of ovarian function by cyclic progesterone treatment. Endocrinology. 2006;147(4):1997–2007. doi: 10.1210/en.2005-1338. [DOI] [PubMed] [Google Scholar]
- 33.Veiga-Lopez A, Ye W, Phillips DJ, Herkimer C, Knight PG, Padmanabhan V. Developmental programming: deficits in reproductive hormone dynamics and ovulatory outcomes in prenatal, testosterone-treated sheep. Biology of reproduction. 2008;78(4):636–47. doi: 10.1095/biolreprod.107.065904. [DOI] [PubMed] [Google Scholar]
- 34.Jackson LM, Timmer KM, Foster DL. Sexual differentiation of the external genitalia and the timing of puberty in the presence of an antiandrogen in sheep. Endocrinology. 2008;149(8):4200–8. doi: 10.1210/en.2007-1382. [DOI] [PMC free article] [PubMed] [Google Scholar]
- 35.Veiga-Lopez AST, Abbott DH, Welch K, MohanKumar PS, Padmanabhan V. Developmental programming: impact of prenatal testosterone excess on maternal and fetal steroid milieu. Biol Reprod; 42nd Annual Meeting of the Society for the Study of Reproduction; Pittsburgh, (USA). 2009. p. 818449. Oral presentation # 84. Biology of Reproduction. Special Issue. [Google Scholar]
- 36.Steckler TL, Herkimer C, Dumesic DA, Padmanabhan V. Developmental programming: excess weight gain amplifies the effects of prenatal testosterone excess on reproductive cyclicity--implication for polycystic ovary syndrome. Endocrinology. 2009;150(3):1456–65. doi: 10.1210/en.2008-1256. [DOI] [PMC free article] [PubMed] [Google Scholar]
- 37.Van Cleef J, Karsch FJ, Padmanabhan V. Characterization of endocrine events during the periestrous period in sheep after estrous synchronization with controlled internal drug release (CIDR) device. Domest Anim Endocrinol. 1998;15(1):23–34. doi: 10.1016/s0739-7240(97)00059-3. [DOI] [PubMed] [Google Scholar]
- 38.Lennette DA. An improved mounting medium for immunofluorescence microscopy. American Journal of Clinical Pathology. 1978;69(6):647–8. doi: 10.1093/ajcp/69.6.647. [DOI] [PubMed] [Google Scholar]
- 39.Foradori CD, Amstalden M, Goodman RL, Lehman MN. Colocalisation of dynorphin a and neurokinin B immunoreactivity in the arcuate nucleus and median eminence of the sheep. Journal of neuroendocrinology. 2006;18(7):534–41. doi: 10.1111/j.1365-2826.2006.01445.x. [DOI] [PubMed] [Google Scholar]
- 40.Hunyady B, Krempels K, Harta G, Mezey E. Immunohistochemical signal amplification by catalyzed reporter deposition and its application in double immunostaining. J Histochem Cytochem. 1996;44(12):1353–62. doi: 10.1177/44.12.8985127. [DOI] [PubMed] [Google Scholar]
- 41.Goodman RL, Lehman MN, Smith JT, Coolen LM, de Oliveira CV, Jafarzadehshirazi MR, Pereira A, Iqbal J, Caraty A, Ciofi P, Clarke IJ. Kisspeptin neurons in the arcuate nucleus of the ewe express both dynorphin A and neurokinin B. Endocrinology. 2007;148(12):5752–60. doi: 10.1210/en.2007-0961. [DOI] [PubMed] [Google Scholar]
- 42.Yang L, Scott KA, Hyun J, Tamashiro KL, Tray N, Moran TH, Bi S. Role of dorsomedial hypothalamic neuropeptide Y in modulating food intake and energy balance. J Neurosci. 2009;29(1):179–90. doi: 10.1523/JNEUROSCI.4379-08.2009. [DOI] [PMC free article] [PubMed] [Google Scholar]
- 43.Kristensen P, Judge ME, Thim L, Ribel U, Christjansen KN, Wulff BS, Clausen JT, Jensen PB, Madsen OD, Vrang N, Larsen PJ, Hastrup S. Hypothalamic CART is a new anorectic peptide regulated by leptin. Nature. 1998;393(6680):72–6. doi: 10.1038/29993. [DOI] [PubMed] [Google Scholar]
- 44.Cowley MA, Smart JL, Rubinstein M, Cerdan MG, Diano S, Horvath TL, Cone RD, Low MJ. Leptin activates anorexigenic POMC neurons through a neural network in the arcuate nucleus. Nature. 2001;411(6836):480–4. doi: 10.1038/35078085. [DOI] [PubMed] [Google Scholar]
- 45.Adam CL, Archer ZA, Findlay PA, Thomas L, Marie M. Hypothalamic gene expression in sheep for cocaine- and amphetamine-regulated transcript, pro-opiomelanocortin, neuropeptide Y, agouti-related peptide and leptin receptor and responses to negative energy balance. Neuroendocrinology. 2002;75(4):250–6. doi: 10.1159/000054716. [DOI] [PubMed] [Google Scholar]
- 46.Williams LM, Adam CL, Mercer JG, Moar KM, Slater D, Hunter L, Findlay PA, Hoggard N. Leptin receptor and neuropeptide Y gene expression in the sheep brain. Journal of neuroendocrinology. 1999;11(3):165–9. doi: 10.1046/j.1365-2826.1999.00293.x. [DOI] [PubMed] [Google Scholar]
- 47.Woods SC, Gotoh K, Clegg DJ. Gender differences in the control of energy homeostasis. Experimental biology and medicine (Maywood, NJ) 2003;228(10):1175–80. doi: 10.1177/153537020322801012. [DOI] [PubMed] [Google Scholar]
- 48.Clegg DJ, Brown LM, Woods SC, Benoit SC. Gonadal hormones determine sensitivity to central leptin and insulin. Diabetes. 2006;55(4):978–87. doi: 10.2337/diabetes.55.04.06.db05-1339. [DOI] [PubMed] [Google Scholar]
- 49.Shi H, Strader AD, Sorrell JE, Chambers JB, Woods SC, Seeley RJ. Sexually different actions of leptin in proopiomelanocortin neurons to regulate glucose homeostasis. American Journal of Physiology. 2008;294(3):E630–9. doi: 10.1152/ajpendo.00704.2007. [DOI] [PubMed] [Google Scholar]
- 50.Skinner DC, Herbison AE. Effects of photoperiod on estrogen receptor, tyrosine hydroxylase, neuropeptide Y, and beta-endorphin immunoreactivity in the ewe hypothalamus. Endocrinology. 1997;138(6):2585–95. doi: 10.1210/endo.138.6.5208. [DOI] [PubMed] [Google Scholar]
- 51.Fodor M, Delemarre-van de Waal HA. Are POMC neurons targets for sex steroids in the arcuate nucleus of the rat? Neuroreport. 2001;12(18):3989–91. doi: 10.1097/00001756-200112210-00027. [DOI] [PubMed] [Google Scholar]
- 52.Barker DJ. The fetal and infant origins of adult disease. BMJ. 1990;301(6761):1111. doi: 10.1136/bmj.301.6761.1111. [DOI] [PMC free article] [PubMed] [Google Scholar]
- 53.Roselli CE, Resko JA, Stormshak F. Expression of steroid hormone receptors in the fetal sheep brain during the critical period for sexual differentiation. Brain Research. 2006;1110(1):76–80. doi: 10.1016/j.brainres.2006.06.070. [DOI] [PubMed] [Google Scholar]
- 54.Urban JH, Bauer-Dantoin AC, Levine JE. Neuropeptide Y gene expression in the arcuate nucleus: sexual dimorphism and modulation by testosterone. Endocrinology. 1993;132(1):139–45. doi: 10.1210/endo.132.1.8419120. [DOI] [PubMed] [Google Scholar]
- 55.Bennett CL, Tosteson TD, Schmitt B, Weinberg PD, Ernstoff MS, Ross SD. Maximum androgen-blockade with medical or surgical castration in advanced prostate cancer: A meta-analysis of nine published randomized controlled trials and 4128 patients using flutamide. Prostate Cancer Prostatic Dis. 1999;2(1):4–8. doi: 10.1038/sj.pcan.4500265. [DOI] [PubMed] [Google Scholar]
- 56.Veiga-Lopez A, Steckler TL, Abbott DH, Welch KB, Mohankumar PS, Phillips DJ, Refsal K, Padmanabhan V. Developmental Programming: Impact of Excess Prenatal Testosterone on Intra-Uterine Fetal Endocrine Milieu and Growth in Sheep. Biol Reprod. 2011;84(1):87–96. doi: 10.1095/biolreprod.110.086686. [DOI] [PMC free article] [PubMed] [Google Scholar]
- 57.Smith P, Steckler TL, Veiga-Lopez A, Padmanabhan V. Developmental programming: differential effects of prenatal testosterone and dihydrotestosterone on follicular recruitment, depletion of follicular reserve, and ovarian morphology in sheep. Biol Reprod. 2009;80(4):726–36. doi: 10.1095/biolreprod.108.072801. [DOI] [PMC free article] [PubMed] [Google Scholar]
- 58.Veiga-Lopez A, Astapova OI, Aizenberg EF, Lee JS, Padmanabhan V. Developmental programming: contribution of prenatal androgen and estrogen to estradiol feedback systems and periovulatory hormonal dynamics in sheep. Biol Reprod. 2009;80(4):718–25. doi: 10.1095/biolreprod.108.074781. [DOI] [PMC free article] [PubMed] [Google Scholar]
- 59.Mountjoy KG, Mortrud MT, Low MJ, Simerly RB, Cone RD. Localization of the melanocortin-4 receptor (MC4-R) in neuroendocrine and autonomic control circuits in the brain. Mol Endocrinol. 1994;8(10):1298–308. doi: 10.1210/mend.8.10.7854347. [DOI] [PubMed] [Google Scholar]
- 60.Kim MS, Rossi M, Abusnana S, Sunter D, Morgan DG, Small CJ, Edwards CM, Heath MM, Stanley SA, Seal LJ, Bhatti JR, Smith DM, Ghatei MA, Bloom SR. Hypothalamic localization of the feeding effect of agouti-related peptide and alpha-melanocyte-stimulating hormone. Diabetes. 2000;49(2):177–82. doi: 10.2337/diabetes.49.2.177. [DOI] [PubMed] [Google Scholar]
- 61.Schwartz MW, Woods SC, Porte D, Jr, Seeley RJ, Baskin DG. Central nervous system control of food intake. Nature. 2000;404(6778):661–71. doi: 10.1038/35007534. [DOI] [PubMed] [Google Scholar]
- 62.Coviello AD, Legro RS, Dunaif A. Adolescent girls with polycystic ovary syndrome have an increased risk of the metabolic syndrome associated with increasing androgen levels independent of obesity and insulin resistance. The Journal of Clinical Endocrinology and Metabolism. 2006;91(2):492–7. doi: 10.1210/jc.2005-1666. [DOI] [PubMed] [Google Scholar]
- 63.Welt CK, Gudmundsson JA, Arason G, Adams J, Palsdottir H, Gudlaugsdottir G, Ingadottir G, Crowley WF. Characterizing discrete subsets of polycystic ovary syndrome as defined by the Rotterdam criteria: the impact of weight on phenotype and metabolic features. The Journal of Clinical Endocrinology and Metabolism. 2006;91(12):4842–8. doi: 10.1210/jc.2006-1327. [DOI] [PubMed] [Google Scholar]