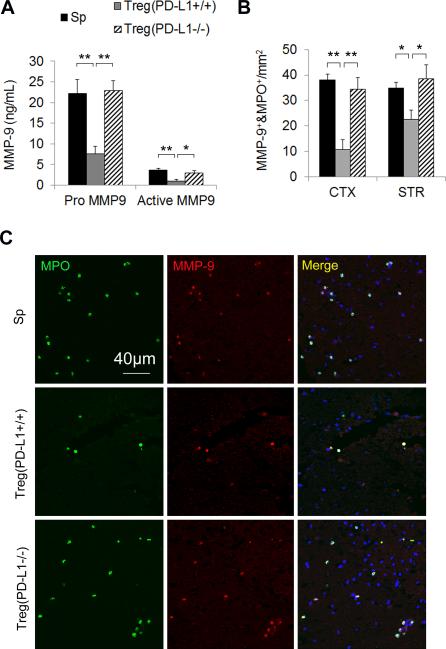
Figure 4. Tregs prepared from PD-L1 deficient mice fail to inhibit the rise of blood MMP-9 after MCAO.
Tregs were prepared from PD-L1 knockout mice and then adoptively transferred into MCAO animals after 2 h of reperfusion. (A) Quantification of plasma MMP-9 1 day after MCAO (n=5/group). (B) The infiltration of MMP-9+MPO+ neutrophils into the cortex (CTX) and striatum (STR) was quantified at 3 days after MCAO (n=5/group). (C) Representative images of MMP-9 and MPO double staining on brain sections. Images are representative of brain sections from five mice in each group. Scale bar represents 40 μm *P<0.05, **P<0.01. Sp = splenocytes.

