

Abstract
This study investigated whether animals sustaining experimental damage to the basal forebrain cholinergic system would benefit from treatment with exogenous neurotrophic factors. Specifically, we set out to determine whether neurotrophic factors would rescue damaged cholinergic neurons and improve behavioral performance on a spatial learning and memory task. Adult rats received bilateral injections of either saline (controls) or 192 IgG-saporin to damage basal forebrain cholinergic neurons (BFCNs). Two weeks later, animals received implants of an Alzet mini-pump connected to cannulae implanted bilaterally in the lateral ventricles. Animals received infusions of nerve growth factor (NGF), neurotrophin 3 (NT3), a combination of NGF and NT3, or a saline control over a 4-week period. Compared to saline-treated controls, animals sustaining saporin-induced damage to BFCNs took significantly more trials to learn a delayed match to position task and also performed more poorly on subsequent tests, with increasing delays between test runs. In contrast, animals infused with neurotrophins after saporin treatment performed significantly better than animals receiving saline infusions; no differences were detected for performance scores among animals infused with NGF, NT3, or a combination of NGF and NT3. Studies of ChAT immunnocytochemical labeling of BFCNs revealed a reduction in the numbers of ChAT-positive neurons in septum, nucleus of diagonal band, and nucleus basalis in animals treated with saporin followed by saline infusions, whereas animals treated with infusions of NGF, NT3 or a combination of NGF and NT3 showed only modest reductions in ChAT-positive neurons. Together, these data support the notion that administration of neurotrophic factors can rescue basal forebrain cholinergic neurons and improve learning and memory performance in rats.
Keywords: basal forebrain, ChAT, choline acetyltransferase, cholinergic, neurotrophins, NGF, NT3, target selection, neuronal plasticity
INTRODUCTION
Basal forebrain cholinergic neurons (BFCNs) comprise a population of neurons that are distributed through the medial septum, diagonal band, substantia innominata, and medial globus pallidus (Mesulam et al., 1983; Butcher and Woolf, 2004). Cholinergic neurons in the substantia innominata and medial globus pallidus are sometimes considered to form the nucleus basalis, a term more appropriate for the human brain (nucleus basalis of Meynert) but also sometimes applied to rodents (nucleus basalis magnocellularis, nBM). The axons of this system provide much of the cholinergic innervation of the cerebral cortex (Mesulam et al., 1983; Baratta et al., 2001; Butcher and Woolf, 2004; Bruel-Jungerman et al., 2011). Experimental damage to BFCNs in laboratory animals has been shown to lead to deficits in learning and memory tasks, particularly those related to spatial memory (Johnson et al., 2002; Ricceri et al., 2004; Marques Pereira et al., 2005; Deiana et al., 2011). In addition, specific cholinergic lesions of the nBM can lead to the long-lasting reduction of acetylcholinesterase (AChE) positive fibers in the cerebral cortex (Szigeti et al. 2013). These results from laboratory animals have supported the idea that loss of cholinergic function in humans is associated with diminished cognitive abilities and may contribute to the development of Alzheimer’s disease (Bartus et al., 1982; Perry et al., 1992; Mufson et al., 1999; Auld et al., 2002; Tuszynski et al., 2005; Craig et al., 2011).
The idea that cholinergic loss may contribute to Alzheimer’s disease has led to the suggestion that treatment regimens that target the cholinergic system, primarily neurotrophic factors, may offer a viable therapy against the development of Alzheimer’s disease (Tuszynski et al., 2005). Several studies have demonstrated that BFCNs are influenced by several neurotrophic factors, including nerve growth factor (NGF) and neurotrophic factor 3 (NT3) (Alderson et al., 1990; Dreyfus, 1989; Gähwiler et al., 1987; Morse et al., 1993; Li et al., 1995; Ha et al., 1996; Nonomura et al., 1996; Ha et al., 1999). These neurotrophic factors are produced by cells in the region of BFCN cell bodies, as well as in the cortical target regions of BFCN axonal projections, and they contribute to the development and maintenance of these cholinergic neurons and their projections (Gähwiler et al., 1987; Dreyfus et al., 1989; van der Zee et al., 1992; Lauterborn et al., 1994; Ha et al., 1999; Robertson et al., 2006).
The present study used an experimental model to determine whether exogenous neurotrophic factors might reduce the deleterious consequences of BFCN damage. Following treatment of rats with 192 IgG-saporin to partially damage the basal forebrain cholinergic system, animals were tested to determine if administration of NGF, NT3, or a combination of NGF and NT3 would improve performance on a delayed match to position (DMP) test and whether these treatment regimens would reduce atrophy of BFCNs.
EXPERIMENTAL PROCEDURES
Animals
Experiments were performed with adult Sprague-Dawley rats, purchased from Charles River (Hollister, CA) and housed in the UCI School of Medicine vivarium. At the beginning of these studies, rats were approximately 8 weeks of age and weighed approximately 180 gm. Animals were placed on a restricted food diet to maintain body weight at 85% of normal, (normal weights reported on the Charles River website) as described below.
All procedures were carried out in accordance with the National Institutes of Health Guide for the Care and Use of Laboratory Animals and were approved by the University of California, Irvine, Institutional Animal Care and Use Committee. All efforts were made to minimize animal suffering and to use only the number of animals necessary to produce reliable scientific data.
Materials
Reagents were purchased from Sigma Chemical Co. (St Louis, MO) unless otherwise noted.
Surgical Procedures
Animals were deeply anesthetized with sodium pentobarbital (40mg/kg; IP) and placed in a stereotaxic apparatus. Injections of 192 IgG-saporin (Chemicon, Temecula CA) in sodium phosphate-buffered saline (PBS) or PBS alone were made using a Hamilton microsyringe and an attached glass micropipette. Four injections were made in each animal; bilaterally in the medial septum (relative to the bregma skull suture, AP +0.2 mm, ML +/− 0.4mm, DV −7.5 mm) and bilaterally in the basal nucleus (AP −0.4mm, ML +/− 1.8mm, DV −8.0 mm) (Paxinos and Franklin, 2004). Injections (per site) were 0.2μl of either saline (0.1M sodium-phosphate buffered 0.9% saline) or 200 ng/μl 192 IgG-saporin, injected slowly over a period of 5 min, and the pipette tip left in place for an additional 5 minutes to facilitate diffusion into the tissue. Animals were placed in a temperature-controlled incubator until they recovered normal activity and then returned to the home cage. These injection parameters were selected in order to produce partial damage of BFCNs. An incomplete lesion was important to allow a remaining component of BFCNs as a target for treatment with neurotrophic factors.
Two weeks after the saporin injections, animals were again deeply anesthetized with pentobarbital (40mg/kg; IP) and placed in the stereotaxic apparatus. Two 28G cannulae were implanted bilaterally in the lateral ventricles (stereotaxic targets AP: −0.9 mm; ML: +/− 2.0 mm; DV: −3.5 mm below the brain surface). Cannulae were connected through a ‘Y’adapter to a polyethylene tube leading to an Alzet mini-pump (Alzet, Cupertino CA) that was implanted under the skin at the nape of the neck. The Alzet pumps used were model 2004 pumps, which deliver 0.25 μl/hr, or a total of 200 μl over 4 weeks.
The Alzet pumps contained either NGF (Life Technologies, InVitrogen; Carlsbad CA) or NT3 (Biosource, InVitrogen; Carlsbad CA), or a combination of both, dissolved in PBS (pH 7.4; 0.1M) at a concentration of 66 ng/μl, for a delivery of 400 ng/day. This treatment dosage is a relatively low dose (Johnson et al., 2002; Marques Pereira et al., 2005; Pappas and Sherren, 2003; Robertson et al., 1998). Six different sets of animals were used, with 5 conditions in each set. Condition 1 (Sap+NGF group) received saporin treatment followed by infusions of NGF alone, over 4 weeks. Condition 2 (Sap+NT3 group) received saporin treatment followed by infusions of NT3 alone. Condition 3 (Sap+NGF, NT3 Combo group) received saporin treatment followed by a combination of NGF and NT3, each at 200 ng/day so the total dose of neurotrophins would be similar to the single neurotrophin groups. Condition 4 (Sap+Sal Control) received saporin followed by vehicle control infusions of sodium-phosphate buffered saline. Condition 5 (Sal+Sal Control) received control intracranial injections of saline followed by infusions of saline. Each set of animals (with 5 conditions in each set) received surgeries, implants and behavioral testing together and was euthanized and tissues processed together for immunocytochemistry.
Behavioral Tests
The behavioral task employed was the delayed match to position (DMP) T-maze; performance on this test has been demonstrated to be impaired by lesions of the forebrain cholinergic system (Johnson et al., 2002). Further, this test offsets the rats’ natural tendency to alternate between arms of the maze (Rabinovitch and Rosvold, 1951; Still, 1966). The experimenters in all cases were blinded to the treatment condition.
All animals were placed on a restricted food diet to maintain body weight at 85% of normal (normal weights as described on the Charles River website). Animals were housed 1 per cage and were provided 3 gm of rat chow per 100 gm body weight per day. Each day, after completion of the behavioral tests, animals were weighed and returned to their home cage, at which time they receive 3 gm of standard rat chow per 100 gm body weight. This procedure resulted in animals being food motivated when they underwent training the following day.
Behavioral testing began 2 weeks after the onset of the neurotrophin treatments. A standard T maze was used for the DMP test. Maze components were 5″ wide and 5″ high. The runway was 14″ long and each arm was 12″ long. During the first week, animals were adapted to the T maze by placing them in the maze with 2–3 reward pellets (45 mg sucrose tab/peanut butter pellets; Test Diet, Richmond IN) for 10 min each day for 5 days. On the second week, animals were trained to run to the end of the maze arms by a series of forced choices over another 5 days. The DMP training consisted of 10 trial pairs/day; each trial consisted of a forced choice to one side or the other, followed immediately by an open choice. A two pellet reward was given when the subject correctly returned to the same arm; an incorrect run to the opposite arm resulted in no pellet reward and brief (10 sec) confinement to that arm. Thus, the task was for the animal to remember which side of the maze was entered in the last trial and to return to that side. The rewarded side was randomized and balanced (right or left). Between trials within a session, animals were returned to their cage for approximately 5 min. Animals received 10 trial pairs/day until the criterion of at least 8 of 10 correct choices was met for two consecutive sessions.
An additional 6 days of testing followed the training sessions; these tests incorporated increasing delays between the forced and open choices of the trial pairs. Delays were 60, 90, and 120 sec, with 2 days of tests per delay period.
The data from the animals were averaged for each of the groups and groups were compared for the acquisition phase and delay tests. Analysis was performed on days to criterion, percent correct choices over acquisition, and post criterion performance compared the five groups (GraphPad InStat; LaJolla CA). In addition, groups were compared by days to criterion using a non-parametric Kuskal-Wallis ANOVA. The group scores were compared for the post-criterion delay tests, using one-way ANOVA.
Tissue Preparation
At the conclusion of the behavioral studies for each set, animals were deeply anesthetized (sodium pentobarbital, 100 mg/kg; IP) and euthanized by vascular perfusion with 0.1M PBS followed with 4% paraformaldehyde and 0.5% glutaraldehyde, in 0.1M PBS. Brains remained in fixative overnight before being transferred to 30% sucrose for cryoprotection. Brains were frozen and then cut in the transverse plane, at a thickness of 40 μm, using a sliding microtome. Transverse sections were collected from the level of the genu of the corpus callosum posteriorly to the splenium of the corpus callosum. Every fifth section through the medial septum and nucleus basalis was processed for ChAT immunocytochemistry; another set of every 5th section was processed for Nissl staining.
ChAT Immunocytochemistry
Sections were treated with 10% DMSO in PBS for 15 min and then blocked with 3% normal rabbit serum (Chemicon, Temecula CA) for 1 hr at room temperature. Sections were incubated overnight at 4°C in goat anti-ChAT (Chemicon AB144P) primary antibody, 1:500 in normal rabbit serum. Sections were rinsed in PBS and then incubated in biotinylated rabbit anti-goat secondary antibody (Vector Labs, Burlingame CA) for 1 hr at room temperature. Sections were stained according to the Vectastain Elite ABC Kit from Vector laboratories (Burlingame CA), using diamino benzidine as the chromagen, with nickel (0.04% nickel chloride) intensification. Sections were mounted, dehydrated, cleared in xylenes, and coverslipped for examination under a light microscope. Selected sections were counterstained with cresyl violet to document the relationship between ChAT-positive cells and local cytoarchitecture.
Data Analysis
Immunocytochemically processed sections from each set of animals were examined under bright field illumination with a Nikon Optiphot to determine the relative numbers of ChAT-positive neurons in basal forebrain nuclei. Borders of nuclear groups were determined from adjacent Nissl sections. Photographic images were taken using a Nikon DS 5M digital camera. Exposure parameters were adjusted manually to ensure that photographic parameters remained consistent within each group set; this allowed for accurate comparison of labeling intensity between sections within each set of animals. Images were loaded into Photoshop (Adobe Photoshop 7.0; Adobe Systems, Mountain View CA). When constructing photographic plates, contrast and brightness were adjusted for photographs within the same plate; no other manipulation of the images was performed.
Analyses compared the 5 different experimental conditions (Sal+Sal control; Sap+Sal; Sap+NT3; Sap+NGF, Sap+Comb), with emphasis on determining whether the presence of neurotrophin affected the number of ChAT-positive neurons in the basal forebrain. Counts were made of the numbers of ChAT+ cells in MS medial septum (MS), nucleus of the diagonal band (nDB), and nucleus basalis (nB) of each hemisphere; cells were assigned to two different categories. Type 1 cells were ChAT positive cells that appeared morphologically normal (each with a clearly stained soma with an identifiable nucleus and at least 2 well stained dendrites). Type 2 cells were ChAT positive cells that appeared atrophic (each with an apparently shrunken soma and with short or apparently shrunken dendrites). Comparisons were made of total numbers of cells across the groups, as well as numbers of Type 1 and Type 2 cells.
RESULTS
Performance in the DMP task
The mean correct choices on the acquisition phase of the DMP test for each day of training for each group of animals are shown in Fig. 1. The groups had similar scores on the initial day of testing and all groups of animals showed improved performance over time on the DMP test. The Sap+Sal treated animals scored significantly more poorly on the test than did the Sal+Sal control animals, indicating the deleterious effects of the saporin treatment (Two-way ANOVA with Bonferroni post-tests). Treatment with neurotrophins of animals previously exposed to saporin (Sap+NGF, Sap+NT3, Sap+NGF&NT3) resulted in behavioral scores that were significantly better than the Sap+Sal and indistinguishable from the control animals (Sal+Sal).
Fig. 1.

Chart shows mean correct choices (of a possible total of 10) for each of 5 groups on the delayed match to position (DMP) task over a 15-day training period. Groups included Sal+Sal (received saline injection into basal forebrain followed by saline infusions), Sap+Sal (saporin injections in basal forebrain followed by saline infusions), Sap+NT3 (saporin injections followed by infusions of NT3), Sap+NGF (saporin injections followed by infusions of NGF), and Sap+ NT3&NGF (saporin injections followed by infusions of a combination of NT3 and NGF). Two-way ANOVA with Bonferroni post-tests: * p<0.05, *** p<0.005 vs. individual group at Days 1–5.
Figure 2 shows the results of the analysis of trials to criterion for each group. The saline-treated animals as a group performed well, with only one animal not reaching criterion and the other members of this group reaching criterion in 7, 9, 10, and 14 days. In contrast, only one member of the saporin-treated group reached criterion, at 9 days, while the other 4 members failed to reach criterion. The groups receiving saporin injections and subsequent treatment with neurotrophins were not distinguishable from the controls (Sal+Sal).
Fig. 2.

Chart shows trials to criterion (8 correct choices in 10 trials for 2 consecutive days) for individuals in each of the 5 groups on the DMP task. Criterion needed to be met in 15 or fewer trials. Individual trial to criterion is depicted by the horizontal bars. Note that only 1 of the saline group did not reach criterion, while only 1 of the saporin group did reach criterion.
Data for the acquisition phase were analyzed further by dividing the results into blocks of training. Figure 3 shows that for the first 5 days of training (Days 1–5), no significant differences were detected between groups. By the second block of trials, days 6–10, the neurotrophin-treated animals had significantly more correct choices per session than did the saporin-treated group (Sap+Sal) and the neurotrophin-treated groups were not significantly different from saline-treated controls (Sal+Sal). These differences between groups continued into the third block of sessions (Days 11–15), again with the saporin-treated animals performing more poorly than the saline controls and more poorly than the groups that received neurotrophin treatment following saporin injections (Two-way ANOVA with Bonferroni post-tests: * p<0.05, *** p<0.005 vs. individual group at Days 1–5).
Fig. 3.
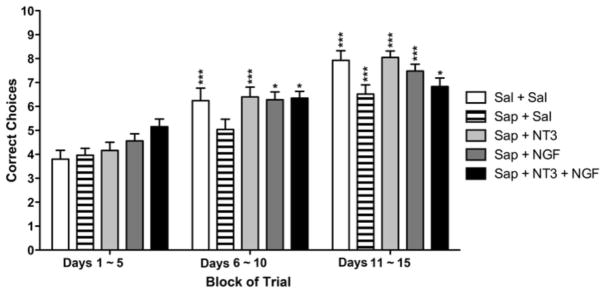
Mean correct choices on the DMP task, for each of the 5 groups, subdivided into blocks of 5 trial days. No differences between groups are evident during the first 5 days (Days 1–5). Differences in mean scores between saline and saporin groups appeared in trial days 6-10 and continued in days 11–15. The neurotrophin infusion groups were not significantly different from saline controls. However, there were significant differences among three blocks of 5 trial days. Two-way ANOVA with Bonferroni post-tests: * p<0.05, *** p<0.005 vs. individual group at Days 1–5.
The second phase of the DMP trials used increasingly longer delays between the first forced choice run and the second test run. As shown in Fig. 4, the shortest interval of 60 seconds did not reveal differences between the groups. That is, although the saline-treated control animals achieved more correct choices, this was not a statistically significant difference, and further, no differences were detected between the animals that received neurotrophin treatments and the animals that received only saporin. However, differences between the groups became apparent at the 120 second delay, with the saporin-treated animals performing more poorly than the saline controls and the neurotrophin-treated animals performing significantly better than the saporin-treated animals and not significantly different from saline-treated controls (Two-way ANOVA with Bonferroni post-tests).
Fig. 4.
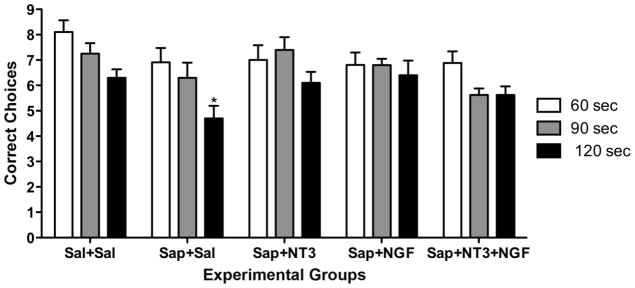
Histogram shows mean correct choices on the DMP test with increasing delays between forced and open choices. Differences between groups did not become apparent until a delay of 120 seconds, when the saporin group performed significantly more poorly. Two-way ANOVA with Bonferroni post-tests: * p<0.05 vs. group at the 60-second delay.
Morphological assessment of brains
After the completion of the behavioral tests, animals were euthanized and brain tissue was processed for ChAT immunocytochemistry. Fig. 5 presents photomicrographs of ChAT immunoreactivity through the septum and nucleus of the diagonal band from representative animals of each experimental group. The section from the saline-injected control animal (Fig. 5A, F) reveals patterns of ChAT-positive cells similar to those reported previously for normal animals (Butcher and Woolf, 2004; Mesulam et al., 1983; Robertson et al., 1998), with strongly labeled multipolar neurons and a few bipolar neurons seen in medial septum and in the vertical and horizontal limbs of the diagonal band. As reported previously (Johnson et al., 2002; Marques Pereira et al., 2005; Pappas and Sherren, 2003; Robertson et al., 1998) saporin treatment results in the loss of many BFCNs. In the present experiments, figures 5B and 5G illustrate a marked loss of ChAT-positive cells in the medial septum and in the nuclei of the diagonal band of the Sap+Sal animals. However infusion with neurotrophins following saporin treatment resulted in an apparent sparing of ChAT-positive cells, whether the treatment was with NT3 alone (Fig. 5C, H), NGF alone (Fig. 5D, I) or with a combination of NT3 and NGF (Fig. 5E, J).
Fig. 5.
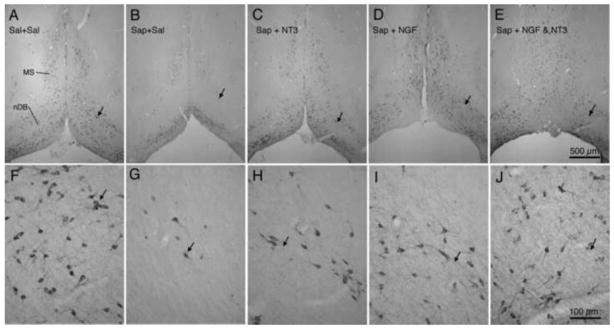
Photomicrographs show ChAT immunoreactivity in medial septum (MS) and nucleus of the diagonal band (nDB) in representative animals from each of the 5 groups. Photomicrographs in the upper row (A–E) represent lower magnification images of the basal forebrain regions, while photomicrographs in the lower row (F–J) represent higher magnification images of the same regions. The small arrows in each pair of photos indicate corresponding regions. Scale bar in E = 500 μm for A – E; bar in J = 100 μm for F – J.
Counts of ChAT+ cells were made from sections from each of the groups, as illustrated in figure 6. Counts were made in each hemisphere; no differences were detected between the two hemispheres, so counts were combined. The images in Fig. 6A and 6B show the pattern of ChAT+ cells in an animal of the Sal+Sal group. Comparable photomicrographs in 6A′ and 6B′ indicate the regions from which cell counts were made. The photomicrographs in Fig. 6C, 6E, and 6G show normal appearing Type 1 ChAT positive neurons from MS, nDB, and nB, respectively. For comparison, photomicrographs in Fig. 6D, 6F, and 6H show atrophic appearing Type 2 ChAT positive neurons from MS, nDB, and nB. Note that although the cells in Fig. 6D, 6F, and 6H are ChAT positive, the somata appear smaller and shrunken, as do the dendrites.
Fig. 6.

ChAT immunoreactivity in basal forebrain. Photomicrographs in A and B show patterns of immunoreactivity, while A′ and B′ indicate sites of cell counts in medial septum (MS – box 300 μm × 1000 μm), nucleus of the diagonal band (nDB – box 800 μm × 1000 μm), and nucleus basalis (nB – box 1000 μm × 1000 μm). Photomicrographs in the lower row (C–H) present higher magnification images of ChAT positive cells in these basal forebrain regions. Normal appearing cells (type 1) from animals treated with saporin followed by NT3 are shown in C (MS), E (nDB), and G (nB). Cells appearing atrophic (type 2) from animals treated with saporin followed by saline are shown in D (MS), F (nDB), and H (nB). Scale bar in A = 500 μm for A, A′, B, and B′. Scale bar in H = 50 μm for C – H.
The counts of total numbers of ChAT+ cells, as well as numbers of Type 1 and Type 2 cells, are presented by the histograms of figure 7. The Sap+Sal group had significantly fewer total ChAT+ cells than did the Sal+Sal control group for MS (Fig. 7A), nDB (Fig. 7B), and nB (Fig. 7C) (ANOVA, p<.01; Tukey-Kramer Multiple Comparisons Test; q=17 for MS; 19 for nDB; 9.3 for nB; all p<.01). Saporin treatment followed by infusions of neurotrophic factors, either NT3 (Sap+NT3) or NGF (Sap+NGF) did not result in significant loss of ChAT+ neurons compared to the Sal+Sal control group. Further, mean numbers of ChAT+ cells were significantly greater in the Sap+NT3 and the Sap+NGF groups than in the Sap+Sal group for MS (q=8.7 and 12.5, respectively), for nDB (q=9.8 and 7.4, respectively), and for nB (q=5.9 and 4.7, respectively).
Fig. 7.
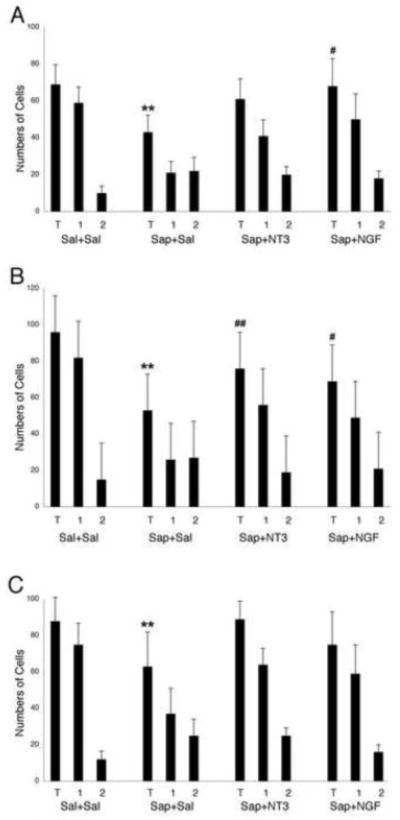
Histograms showing mean numbers of cells (error bars show standard deviation) in medial septum (A), nucleus of diagonal band (B), and nucleus basalis (C), from animal groups including Sal + Sal (left group), Sap + Sal (second group), Sap + NT3 (third group), and Sap + NGF (right group). In each grouping, histograms present means for total number of ChAT+ cells (T), for normal appearing (type 1) cells (1), and for atrophic appearing (type 2) cells (2). Two-way ANOVA with Tukey-Kramer Multiple Comparisons Test: ** p<0.01 vs. Sal + Sal group; # p<0.05, ## p<0.01 vs. Sap + Sal group
While sections from each brain region from each treatment group displayed both normal appearing (Type 1) and atrophic appearing (Type 2) cells, the ratios of Type 1 to Type 2 differed considerably between groups (ANOVA, p<.001). Comparisons of the Sal+Sal and the Sap+Sal groups reveal significant differences in ratios of Type 1 to Type 2 cells for the MS (q= 17.2; p<.001), nDB (q=16.4; p< .001), and nB (q=7.5; p<.01). Further, treatment in the Sap+NT3 resulted in increased ratios of Type 1 to Type 2 cells, relative to the Sap+Sal group. Differences in ratios were significant for MS (for the Sap+NGF group; q=4.9; p<.05) but not for the Sap+NT3 group. Differences in ratios were significant for nDB for both the Sap+NT3 group (q=6.1; p<.01) and the Sap+NGF group (q=4.5; p<.05). Differences were not significant in nB for either the Sap+NT3 group (q=1.13; p>.05) for the Sap+NGF group (q=2.5; p>.05).
DISCUSSION
The basal forebrain cholinergic system is well positioned to have a significant influence on crucial aspects of learning and memory. Basal forebrain derived axons provide much of the cholinergic innervation of the cerebral cortex (Baratta et al., 2001; Butcher and Woolf, 2004; Lysakowski et al., 1989; Mesulam, 1983). BFCN derived cholinergic axons extend to encompass essentially all of cortex, although regional differences occur (e.g., Lysakowski et al., 1989). Physiological studies have demonstrated that cholinergic activation of muscarinic and some nicotinic receptors serves to increase the efficacy of glutamatergic synaptic transmission (Dotigny et al., 2008; Klinkenberg et al., 2011; Phillis, 2005). Previous studies, both in humans and in laboratory animal models, have indicated that deficits in forebrain cholinergic function are associated with deficits in attention and in spatial memory tasks (Auld et al., 2002; Bartus et al., 1982; Deiana et al., 2011; Haense et al., 2012; Marques Pereira et al., 2005; Ricceri et al; 2004).
If loss of cholinergic function, either through loss of cholinergic neurons or through their inactivation, leads to deficits in a learning and memory task performance, then steps to reduce damage to or recover function of these cholinergic neurons may have a beneficial impact on behavior. It has been well demonstrated that BFCNs are influenced by several neurotrophic factors (Alderson et al., 1990; Dreyfus, 1989; Gähwiler et al., 1987; Ha et al., 1996; 1999; Li et al., 1995; Morse et al., 1993; Nonomura et al., 1996). These neurotrophins are obvious candidates to reduce damage, or the effects of damage, to the cholinergic system. In normal brain, these neurotrophic factors are produced by cells in the cortical target regions of basal forebrain cholinergic projections and also are produced locally in the region of cholinergic cell bodies (Friedman et al., 1998; Huang and Reichardt, 2001; Lauterborn et al., 1993; Volosin et al., 2006). Thus the availability of neurotrophic factors, either in the axonal terminal field or in the region of the cell bodies, likely contributes to the development and maintenance of cholinergic systems and could also contribute to their recovery following damage.
There is widespread agreement that NGF is a survival factor for developing basal forebrain cholinergic neurons and that in adults, loss of NGF leads to their atrophy (Cadete-Leite et al., 2003; Morse et al., 1993; Sofroniew et al., 1993; Volosin et al., 2006). Increasing the availability of NGF may serve to maintain cholinergic circuits later in life, perhaps providing a therapy for Alzheimer’s disease (Mufson et al., 1999; Tuszynski et al., 2005). Administering or upregulating NGF alone may not be sufficient, however. Recent findings from our laboratory (Robertson et al., 2006) suggest that NT3 has a functional role in directing cholinergic axons to their targets in cortex. That is, the expression of NT3 appears to induce extension of the cholinergic axons into cortical target regions and facilitates preterminal branching and synapse formation with dendrites of target neurons. Thus, the presence of NGF may help promote basal forebrain cholinergic neuron health and survival, while NT-3 may facilitate preferential targeting and maintenance of cholinergic terminal fields in cerebral cortex (Robertson et al., 2006).
If experimental supplements of neurotrophic factors are to be an effective therapy, it is essential that sufficient portions of the basal forebrain system be intact. In the present studies, relatively low doses of saporin were used to treat the experimental animals so as to induce only a partial loss of cholinergic neurons. Control animals that received saporin injections without neurotrophin supplements exhibited partial loss of ChAT-positive BFCNs from medial septum, the diagonal band, and nucleus basalis. The present data do not allow a determination to be made regarding whether the affected cells have been eliminated or whether reduced ChAT levels has left the cells below the level needed to be detected by our techniques. In either case, 4 weeks of infusing neutrophic factors resulted in the apparent sparing of most of the ChAT-positive neurons that appeared to be lost in the saporin only treated animals. Similar results were obtained irrespective of whether NT3, NGF, or a combination of NT3 and NGF were infused during the early post-lesion period. These data may be compared to results of studies that examined the fate of BFCNs following placement of lesions that destroyed their axons and/or terminal fields, although this issue remains controversial. Some investigators (e.g., Hagg et al., 1988; Sofroniew et al., 1993) report that BFCNs may lose their cholinergic phenotype, as regards their expression of ChAT or acetylcholinesterase (AChE), but that phenotype can be rescued by the administration of neurotrophins and hence the cells were not dead. In contrast, other investigators (e.g., Tuszynski et al., 1990) have demonstrated through retrograde labeling by fluorescent microspheres that axonal damage leads to the death of the vast majority of BFCNs.
Treatment with the 192 IgG saporin leads to the loss of a large portion of the BFCNs (Ha et al., 1999; Johnson et al., 2002; Pappas and Sherren, 2003; Ricceri et al., 2004; Robertson et al., 1998; Szigeti et al., 2013). Although it is known that saporin is able to kill cells by inactivating ribosomes and thereby shutting down protein synthesis (Daniels-Wells et al., 2013), it is not yet clear how a partial, sublethal (to the cell) dose may affect the cell. The present data suggest that smaller doses of saporin, even when targeted to the specific population of BFCNs by the 192 IgG saporin, may impact a population of cells so that they appear atrophic but are still viable. Following saporin administration, later treatment with neurotrophic factors appears able to rescue some of the cells, in the dual sense that more ChAT+ positive cells are detected and that the proportion of normal appearing cells is increased.
Animals that received saporin injections into the basal forebrain region performed significantly more poorly on the DMP task than did control animals that received saline injections into the basal forebrain; this result corroborates a previous report that saporin damage to basal forebrain cholinergic circuits impaired DMP performance (Johnson et al., 2002). Interestingly, the performance of animals that received saporin treatment followed by neurotrophin infusions was indistinguishable from that of the saline injected control group. Further, performance on the DMP test between saline controls and saporin-treated animals with neurotrophic infusions was indistinguishable, irrespective of whether the animals received infusions of NT3, NGF, or a combination of NT3 and NGF.
Clearly, treatment of BFCN-damaged animals with neurotrophic factors results in increased numbers of detectable BFCNs and also improvement of performance on the DMP task. Furthermore, it is interesting that the result was similar irrespective of whether NGF, NT3 or a combination of NGF and NT3 was administered to the animals. It could be, for example, that treatment with NGF allowed more BFCNs to survive the saporin treatment, and these neurons were able to maintain, or re-establish connections with cortical neurons. Further, treatment with NT3 could serve to maintain BFCN connections with cortical neurons, and this connectivity with associated retrograde transport of neurotrophins (Sofroniew et al., 1993) could maintain the somata of BFCNs. Further studies examining more time points between saporin treatment-induced damage and the therapeutic application of neurotrophic factors could shed further light on these issues.
Highlights.
NGF and NT3 rescue basal forebrain cholinergic neurons damage
Neurotrophic factors improve behavioral tests after cholinergic neurons lesion
Re-establish of cholinergic pathways by neurotrophic factors
Acknowledgments
Supported in part by the Alzheimer’s Association IIRG 06-25497 (to RTR) and the National Institute of Neurological Disorders and Stroke grants NS069765 (to Y-S.L.).
Footnotes
Publisher's Disclaimer: This is a PDF file of an unedited manuscript that has been accepted for publication. As a service to our customers we are providing this early version of the manuscript. The manuscript will undergo copyediting, typesetting, and review of the resulting proof before it is published in its final citable form. Please note that during the production process errors may be discovered which could affect the content, and all legal disclaimers that apply to the journal pertain.
References
- 1.Alderson RF, Alterman AL, Barde YA, Lindsay RA. Brain-derived neurotrophic factor increases survival and differentiated functions of rat septal cholinergic neurons in cultures. Neuron. 1990;5:297–306. doi: 10.1016/0896-6273(90)90166-d. [DOI] [PubMed] [Google Scholar]
- 2.Mufson EJ, Kroin JS, Sendera TJ, Sobreviela T. Distribution and retrograde transport of trophic factors in the central nervous system: functional implications for the treatment of neurodegenerative diseases. Prog Brain Res. 1999;57:451–484. doi: 10.1016/s0301-0082(98)00059-8. [DOI] [PubMed] [Google Scholar]
- 3.Auld DS, Kornecook TJ, Bastianetto S, Quirion R. Alzheimer’s disease and the basal forebrain cholinergic system: relations to &beta-amyloid peptides, cognition and treatment strategies. Progr Neurobiol. 2002;68:209–245. doi: 10.1016/s0301-0082(02)00079-5. [DOI] [PubMed] [Google Scholar]
- 4.Baratta J, Ha DH, Yu J, Robertson RT. Evidence for target preferences by cholinergic axons originating from different subdivisions of the basal forebrain. Dev Brain Res. 2001;132:15–21. doi: 10.1016/s0165-3806(01)00290-5. [DOI] [PubMed] [Google Scholar]
- 5.Bartus R, Dean RL, Beer C, Lippa AS. The cholinergic hypothesis of geriatric memory dysfunction. Science. 1982;217:408–417. doi: 10.1126/science.7046051. [DOI] [PubMed] [Google Scholar]
- 6.Bruel-Jungerman E, Lucassen PJ, Francis F. Cholinergic influences on cortical development and adult neurogenesis. Behav Brain Res. 2011;221:379–388. doi: 10.1016/j.bbr.2011.01.021. [DOI] [PubMed] [Google Scholar]
- 7.Butcher LL, Woolf NJ. Cholinergic neurons and networks revisited. In: Paxinos G, editor. The Rat Nervous System. 3. Elsevier Academic Press; 2004. pp. 1257–1268. [Google Scholar]
- 8.Cadete-Leite A, Periera PA, Madeira MD, Paula-Barbosa MM. Nerve growth factor prevents cell death and induces hypertrophy of basal forebrain cholinergic neurons in rats withdrawn from prolonged ethanol intake. Neuroscience. 2003;119:1055–1069. doi: 10.1016/s0306-4522(03)00205-7. [DOI] [PubMed] [Google Scholar]
- 9.Craig LA, Hong NS, McDonald RJ. Revisiting the cholinergic hypothesis in the development of Alzheimer’s disease. Neurosci Biobehav Rev. 2011;35:1397–1409. doi: 10.1016/j.neubiorev.2011.03.001. [DOI] [PubMed] [Google Scholar]
- 10.Daniels-Wells TR, Helguera G, Rodriguez JA, Leo LS, Erb MA, Diamente G, Casero D, Pelligrini M, Martinez-Maza O, Penichet ML. Insights into the mechanism of cell death induced by saporin delivered into cancer cells by an antibody fusion protein targeting the transferrin receptor 1. Toxicology in Vitro. 2013;27:220–231. doi: 10.1016/j.tiv.2012.10.006. [DOI] [PMC free article] [PubMed] [Google Scholar]
- 11.Deiana S, Platt B, Riedel G. The cholinergic system and spatial learning. Behav Brain Res. 2011;221:389–411. doi: 10.1016/j.bbr.2010.11.036. [DOI] [PubMed] [Google Scholar]
- 12.Dotigny F, Ben Amor AY, Burke M, Vaucher E. Neuromodulatory role of acetylcholine in visually-induced cortical activation: behavioral and neuroanatomical correlates. Neuroscience. 2008;154:1607–1618. doi: 10.1016/j.neuroscience.2008.04.030. [DOI] [PubMed] [Google Scholar]
- 13.Dreyfus CF. Effects of nerve growth factor on cholinergic brain neurons. Trends Pharm Sci. 1989;10:145–149. doi: 10.1016/0165-6147(89)90166-1. [DOI] [PubMed] [Google Scholar]
- 14.Friedman WJ, Black IB, Kaplan DR. Distribution of the neurotrophin brain-derived neurotrophic factor, neurotrophin-3 and neurotrophin-4/5 in the postnatal rat brain: an immunocytochemical study. Neuroscience. 1998;84:101–114. doi: 10.1016/s0306-4522(97)00526-5. [DOI] [PubMed] [Google Scholar]
- 15.Gähwiler BH, Enz A, Hefti F. Nerve growth factor promotes development of the rat septo-hippocampal cholinergic projection in vitro. Neurosci Lett. 1987;75:6–10. doi: 10.1016/0304-3940(87)90066-8. [DOI] [PubMed] [Google Scholar]
- 16.Ha DH, Robertson RT, Ribak CE, Weiss JH. Cultured basal forebrain cholinergic neurons in contact with cortical cells display synapses, enhanced morphological features and decreased dependence on nerve growth factor. J Comp Neurol. 1996;373:451–465. doi: 10.1002/(SICI)1096-9861(19960923)373:3<451::AID-CNE9>3.0.CO;2-1. [DOI] [PubMed] [Google Scholar]
- 17.Ha DH, Robertson RT, Roshanaei M, Weiss JH. Enhanced survival and morphological features of basal forebrain cholinergic neurons in vitro: role of neurotrophins and other potential cortically derived cholinergic trophic factors. J Comp Neurol. 1999;406:156–170. [PubMed] [Google Scholar]
- 18.Haense C, Kalbe E, Herholz K, Hohmann C, Neumaier B, Krais R, Hess WD. Cholinergic system function and cognition in mild cognitive impairment. Neurobiol Aging. 2012;33:867–877. doi: 10.1016/j.neurobiolaging.2010.08.015. [DOI] [PubMed] [Google Scholar]
- 19.Hagg T, Manthorpe M, Vahlsing HL, Varon S. Delayed treatment with NGF reverses the apparent loss of cholinergic neurons after acute brain injury. Exp Neurol. 1988;101:303–312. doi: 10.1016/0014-4886(88)90013-1. [DOI] [PubMed] [Google Scholar]
- 20.Huang EJ, Reichardt LF. Neurotrophins: roles in neuronal development and function. Ann Rev Neurosci. 2001;24:677–736. doi: 10.1146/annurev.neuro.24.1.677. [DOI] [PMC free article] [PubMed] [Google Scholar]
- 21.Johnson DA, Zambon NJ, Gibbs RB. Selective lesion of cholinergic neurons in the medial septum by 192 IgG-saporin impairs learning in a delayed matching to position T-maze paradigm. Brain Res. 2002;943:132–141. doi: 10.1016/s0006-8993(02)02623-9. [DOI] [PubMed] [Google Scholar]
- 22.Lauterborn JC, Isackson PJ, Gall CM. Cellular localization of NGF and NT-3 mRNAs in postnatal rat forebrain. Mol Cell Neurosci. 1994;5:46–62. doi: 10.1006/mcne.1994.1005. [DOI] [PubMed] [Google Scholar]
- 23.Li Y, Holtzman DM, Kromer LF, Kaplan DR, Chua-Couzens J, Clary DO, Knusel B, Mobley WC. Regulation of TrkA and ChAT expression in developing rat basal forebrain: evidence that both exogenous and endogenous NGF regulate differentiation of cholinergic neurons. J Neurosci. 1995;15:2888–2905. doi: 10.1523/JNEUROSCI.15-04-02888.1995. [DOI] [PMC free article] [PubMed] [Google Scholar]
- 24.Klinkenberg I, Sambeth A, Blokland A. Acetylcholine and attention. Behav Brain Res. 2011;221:430–442. doi: 10.1016/j.bbr.2010.11.033. [DOI] [PubMed] [Google Scholar]
- 25.Lysakowski A, Wainer BH, Bruce G, Hersh LB. An atlas of the regional and laminar distribution of choline acetyltransferase immunoreactivity in rat cerebral cortex. Neuroscience. 1989;28:291–336. doi: 10.1016/0306-4522(89)90180-2. [DOI] [PubMed] [Google Scholar]
- 26.Marques Pereira P, Cosquer B, Schimchowitsch S, Cassel JC. Hebb-Williams performance and scopolamine challenge in rats with partial immunotoxic hippocampal cholinergic deafferentation. Brain Res Bull. 2005;64:381–394. doi: 10.1016/j.brainresbull.2004.09.007. [DOI] [PubMed] [Google Scholar]
- 27.Mesulam M, Mufson EJ, Wainer BH, Levey AI. Central cholinergic pathways in the rat: an overview based on an alternative nomenclature (Ch1-Ch6) Neuroscience. 1983;10:1185–1201. doi: 10.1016/0306-4522(83)90108-2. [DOI] [PubMed] [Google Scholar]
- 28.Morse JK, Wiegeand SJ, Anderson K, You Y, Cai N, Carnahan J, Miller JG, Mufson EJ, Kroin JS, Sendera TJ, Sobreviela T. Distribution and retrograde transport of trophic factors in the central nervous system: functional implications for the treatment of neurodegenerative diseases. Prog Brain Res. 1999;57:451–484. doi: 10.1016/s0301-0082(98)00059-8. [DOI] [PubMed] [Google Scholar]
- 29.Nonomura T, Nishio C, Lindsay RM, Hatanaka H. Cultured basal forebrain cholinergic neurons from postnatal rats show both overlapping and non-overlapping responses to the neurotrophins. Brain Res. 1996;683:129–139. doi: 10.1016/0006-8993(95)00357-v. [DOI] [PubMed] [Google Scholar]
- 30.Pappas BA, Sherren N. Neonatal 192 IgG-saporin lesion of forebrain cholinergic neurons: focus on the life span? Neurosci Biobehav Rev. 2003;27:365–376. doi: 10.1016/s0149-7634(03)00067-8. [DOI] [PubMed] [Google Scholar]
- 31.Paxinos G, Franklin KBJ. The Mouse Brain in Stereotaxic Coordinates. Elsevier Academic Press; Amsterdam: 2004. [Google Scholar]
- 32.Perry EK, Johnson M, Kerwin JM, Piggott MA, Court JA, Shaw PJ, Ince PG, Brown A, Perry RH. Convergent cholinergic activities in aging and Alzheimer’s disease. Neurobiol Aging. 1992;13:393–400. doi: 10.1016/0197-4580(92)90113-c. [DOI] [PubMed] [Google Scholar]
- 33.Phillis JW. Acetylcholine release from the central nervous system: a 50-year retrospective. Crit Rev Neurobiol. 2005;17:161–217. doi: 10.1615/critrevneurobiol.v17.i3-4.30. [DOI] [PubMed] [Google Scholar]
- 34.Rabinovitch MS, Rosvold HE. A closed-field intelligence test for rats. Can J Psychol. 1951;5:122–128. doi: 10.1037/h0083542. [DOI] [PubMed] [Google Scholar]
- 35.Ricceri L, Minghetti L, Moles A, Popoli A, Confaloni A, DeSimone R, Piscopo P, Scattoni ML, di Luca M, Calamandrei G. Cognitive and neurological deficits induced by early and prolonged basal forebrain cholinergic hypofunction in rats. Exp Neurol. 2004;189:162–172. doi: 10.1016/j.expneurol.2004.05.025. [DOI] [PubMed] [Google Scholar]
- 36.Robertson RT, Gallardo KA, Claytor KJ, Ha DH, Ku KH, Yu BP, Lauterborn JC, Wiley RG, Yu J, Gall CM, Leslie FM. Neonatal treatment with 192 IgG-saporin produces long-term forebrain cholinergic deficits and reduces dendritic branching and spine density of neocortical pyramidal neurons. Cereb Cortex. 1998;8:142–155. doi: 10.1093/cercor/8.2.142. [DOI] [PubMed] [Google Scholar]
- 37.Robertson RT, Baratta J, Yu J, Guthrie KM. A role for neurotrophin 3 in target selection by developing cholinergic axonal projections to cerebral cortex. Neuroscience. 2006;143:523–539. doi: 10.1016/j.neuroscience.2006.09.003. [DOI] [PubMed] [Google Scholar]
- 38.Szigeti C, Bencsik N, Simonka AJ, Legradi A, Kasa P, Gulya K. Long-term effects of selective immunolesions of cholinergic neurons of the nucleus basalis magnocellularis on the ascending cholinergic pathways in the rat: A model for Alzheimer’s disease. Brain Res Bull. 2013;94:9–16. doi: 10.1016/j.brainresbull.2013.01.007. [DOI] [PubMed] [Google Scholar]
- 39.Sofroniew MV, Cooper JD, Svendsen CN, Crossman P, Ip NY, Lindsay RM, Zafra F, Lindholm D. Atrophy but not death of adult septal cholinergic neurons after ablation of target capacity to produce mRNAs for NGF, BDNF, and NT3. J Neurosci. 1993;12:5263–5276. doi: 10.1523/JNEUROSCI.13-12-05263.1993. [DOI] [PMC free article] [PubMed] [Google Scholar]
- 40.Still AW. Spontaneous alternation and exploration in rats. Nature. 1966;210:657–658. doi: 10.1038/210657a0. [DOI] [PubMed] [Google Scholar]
- 41.Tuszynski MH, Armstrong DM, Gage FH. Basal forebrain cell loss following fimbria/fornix transection. Brain Res. 1990;508:241–248. doi: 10.1016/0006-8993(90)90402-w. [DOI] [PubMed] [Google Scholar]
- 42.Tuszynski MH, Thal L, Pay M, Salmon DP, UHS, Bakay R, Patel P, Blesch A, Vahlsing HL, Ho G, Tong G, Potkin SG, Fallon J, Hansen L, Mufson EJ, Kordower JH, Gall C, Conner J. A phase 1 clinical trial of nerve growth factor gene therapy for Alzheimer disease. Nat Med. 2005;11:551–555. doi: 10.1038/nm1239. [DOI] [PubMed] [Google Scholar]
- 43.van der Zee CE, Keijser JN. Localization of pre- and postsynaptic cholinergic markers in rodents forebrain: a brief history and comparison of rat and mouse. Behav Brain Res. 2011;221:356–366. doi: 10.1016/j.bbr.2010.11.051. [DOI] [PubMed] [Google Scholar]
- 44.Volosin M, Song W, Almeida RD, Kaplan DR, Hempstead BL, Friedman WJ. Interaction of survival and death signaling in basal forebrain neurons: roles of neurotrophins and proneurotrophins. J Neurosci. 2006;26:7756–7766. doi: 10.1523/JNEUROSCI.1560-06.2006. [DOI] [PMC free article] [PubMed] [Google Scholar]