

Significance
The mechanistic or mammalian target of rapamycin (mTOR) is an evolutionarily conserved serine/threonine kinase that integrates various environmental signals/cues to regulate cell growth, proliferation, metabolism, and survival. The promyelocytic leukemia zinc-finger transcription factor (PLZF) is known to be critical not only for invariant natural killer T (iNKT)-cell development and effector program differentiation of lymphocytes, but also for many other developmental programs. Our study demonstrates that mTOR is a crucial regulator of PLZF via control of PLZF localization to special nuclear compartments, which is essential for iNKT-cell lineage development and effector function.
Keywords: TNFα, IL-4, IFN-γ, PLZF
Abstract
The mechanisms that control invariant natural killer T (iNKT)-cell development and function are still poorly understood. The mechanistic or mammalian target of rapamycin (mTOR) integrates various environmental signals/cues to regulate cell growth, proliferation, metabolism, and survival. We report here that ablation of mTOR complex 1 (mTORC1) signaling by conditionally deleting Raptor causes severe defects in iNKT-cell development at early stages, leading to drastic reductions in iNKT-cell numbers in the thymus and periphery. In addition, loss of Raptor impairs iNKT-cell proliferation and production of cytokines upon α-galactosylceramide stimulation in vitro and in vivo, and inhibits liver inflammation in an iNKT cell-mediated hepatitis model. Furthermore, Raptor deficiency and rapamycin treatment lead to aberrant intracellular localization and functional impairment of promyelocytic leukemia zinc-finger, a transcription factor critical for iNKT-cell development and effector programs. Our findings define an essential role of mTORC1 to direct iNKT-cell lineage development and effector function.
The invariant Vα14-Jα18 T-cell receptor (iVα14TCR)–expressing natural killer T (iNKT) cells play important roles in both innate and adaptive immunity and in the pathogenesis of disease. iNKT cells are derived from the CD4+CD8+ double-positive thymocytes, and their development has been divided into four stages, from the earliest stage 0 (CD24+CD44−NK1.1−), to stage 1 (CD24−CD44−NK1.1−), stage 2 (CD24−CD44+NK1.1−), and stage 3 (CD24−CD44+NK1.1+). In contrast to conventional αβ T (cαβT) cells, iNKT cells immediately secrete a broad range of cytokines, such as IL-4, IFN-γ, and TNF-α, after TCR stimulation. The prompt responses enable these cells to play important roles in both innate and adaptive immunity (1–5).
Extensive studies have revealed a large number of transcription factors required for iNKT-cell ontogeny. Among them, the promyelocytic leukemia zinc-finger transcription factor (PLZF) is a key regulator for early development and functional maturation in the iNKT-cell lineage. Deletion or natural mutation of PLZF in mice prevents the transition of stage 1 iNKT cells to stage 2 iNKT cells, as well as impairing effector function, such as cytokine production, upon activation (6, 7). PLZF interacts with other molecules, is posttranslationally modified, and functions within special speckle-like nuclear compartments, nuclear bodies (NBs). In addition to its role in iNKT cells, PLZF plays important roles in effector T-cell differentiation and in many other developmental programs (8). How PLZF is regulated during iNKT-cell maturation and other developmental programs is unknown.
The mechanistic or mammalian target of rapamycin (mTOR), a serine/threonine kinase, integrates various environmental signals/cues, such as growth factors, nutrients, energy, and stress, to control cell growth, proliferation, autophagy, and survival. This molecule signals through two signaling complexes: mTORC1 and mTORC2. mTORC1 promotes protein translation, nucleotide synthesis, and lipid/sterol synthesis. mTORC2 phosphorylates AKT, serum and glucocorticoid-regulated kinase 1, and PKC-α to promote nutrient uptake, cell survival, and actin rearrangement (9). Activation of mTORC1 and mTORC2 upon TCR stimulation depends on PI3K-AKT, as well as Ras guanyl releasing protein 1 (RasGRP1)-Ras-Erk1/2 pathways (10). Additional studies, including ours, have demonstrated that mTOR and its tight regulation by the tumor suppressor TSC1 play crucial roles in T-cell differentiation, survival, quiescence, and migration, as well as other immune cell development and function (11–17). However, the role of mTOR in iNKT cells is unclear.
We report here that deficiency of mTORC1 caused by conditional mTOR KO or Raptor KO in mice blocks iNKT-cell development at early stages, as well as its activation in vitro and in vivo, phenotypically similar to that caused by PLZF deficiency. The suppression of mTORC1 by Raptor deficiency and rapamycin dislocates PLZF from its functional nuclear compartment, suggesting that mTORC1 acts as an upstream regulator of PLZF to control iNKT-cell lineage development and function.
Results
mTOR Is Essential for iNKT-Cell Development.
To determine the role of mTOR in iNKT-cell development, we analyzed mTORf/f mice carrying a CD4-Cre transgene (mTOR-T-KO) using PBS57-loaded CD1d-tetramer (CD1d-tet) to detect the iNKT-cell population. Both the frequencies and numbers of CD1d-tet+TCR-β+ iNKT cells were severely decreased in the thymus, spleen, and liver of mTOR-T-KO mice compared with mTORf/f (WT) littermates (Fig. 1 A and B). mTOR-T-KO iNKT cells were highly enriched at CD24+ stage 0 compared with WT controls (Fig. 1C, Left). The percentages of CD44−NK1.1− stage 1 and CD44+NK1.1+ stage 3 populations from CD24− iNKT cells were drastically increased and decreased, respectively, compared with WT controls (Fig. 1C, Right). However, due to the great decrease in total iNKT-cell numbers, mTOR-T-KO mice actually contained 60% less stage 0 iNKT cells and a more drastic decrease of stage 1–3 iNKT cells than their corresponding WT controls (Fig. 1D). The total numbers of thymocytes, splenocytes, and liver mononuclear cells (MNCs) were similar in WT and mTOR-T-KO mice (Fig. 1E). Although it has been reported that mTOR deficiency causes an increase in the ratio of CD4 single-positive (CD4SP) to CD8SP cells in the thymus (18), we did not observe abnormal cαβT-cell frequencies and numbers in mTOR-T-KO thymus compared with WT controls based on CD4 and CD8 staining (Fig. 1F). These results show that mTOR is selectively required for early development of iNKT cells.
Fig. 1.
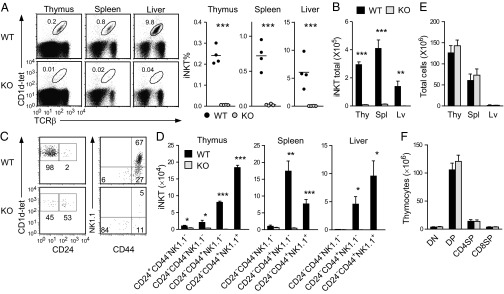
iNKT-cell development is blocked early in mTOR-deficient mice. (A) Percentages of iNKT cells in mTOR-T-KO and WT mice. iNKT-cell populations were determined by CD1d-tet+TCR-β+. Each dot in the bar graphs represents an individual mouse of the indicated genotype. Data are representative of three experiments. (B) Total iNKT-cell numbers in the thymus (Thy), spleen (Spl), and liver (Lv) of mTOR-T-KO and WT mice. Bar graphs are shown as mean ± SEM. (C) Thymic iNKT-cell developmental stages. CD24 expression on gated iNKT cells (Left) and CD44 and NK1.1 expression on CD24− iNKT cells (Right) are shown. Data are representative of three experiments. (D) iNKT-cell numbers at each developmental stage in mTOR-T-KO and WT mice. Bar graphs represent mean ± SEM (n = 4). (E) Total thymus, spleen, and liver MNC cellularity from WT and mTOR-T-KO mice (mean ± SEM, n = 4). (F) Thymocyte numbers of the indicated populations (n = 4). CD4SP, CD4+CD8− single positive; CD8SP, CD4−CD8+ single positive; DN, CD4−CD8− double negative; DP, CD4+CD8+ double positive. *P < 0.05; **P < 0.01; ***P < 0.001 determined by the Student t test.
Raptor/mTORC1 Deficiency Impairs iNKT-Cell Development.
To determine the contribution of mTORC1 to iNKT-cell development, we further examined iNKT development in Raptorf/f-CD4Cre (Raptor-T-KO) mice, because Raptor is an essential component for mTORC1 signaling (9). Thymic subsets based on CD4 and CD8 staining were similar between WT and Raptor-T-KO mice (Fig. 2A), which is consistent with previous observations in Raptorf/f-LckCre mice (19). Raptor protein level was obviously decreased in Raptor-T-KO thymocytes (Fig. 2B), suggesting efficient ablation of Raptor. The residual Raptor protein detected in Raptor-T-KO thymocytes could be caused by the expression of this protein in double-negative (DN) thymocytes before Cre transgene expression. Phosphorylation of S6 and 4E-BP1 (mTORC1-dependent events) but not Erk1/2, phospholipase C-γ1 (PLC-γ1; mTORC1-independent event), or AKT at serine 473 (mTORC2-dependent event) was considerably decreased in Raptor-T-KO thymocytes, indicating impaired mTORC1 signaling in these cells (Fig. 2C). In contrast to cαβT cells, Raptor deficiency led to drastic decreases of iNKT cells in the thymus, spleen, and liver (Fig. 2 D–F). Within Raptor-T-KO iNKT cells, the ratios of stage 0 and stage 1 iNKT cells were considerably increased, the ratio of stage 2 iNKT cells was not obviously altered, but the ratio of stage 3 iNKT cells was drastically reduced (Fig. 2G). However, due to the drastic decreases of total iNKT-cell numbers, the total numbers of stage 0 and stage 1 iNKT cells were not significantly different between WT and Raptor-T-KO mice, whereas stage 2 and 3 iNKT-cell numbers were strikingly decreased in Raptor-T-KO mice (Fig. 2H). Of note, the developmental blockade of iNKT cells in raptor-deficient mice occurs at stage 1 after positive selection of this lineage of cells. The lack of obvious effects of mTORC1 deficiency on cαβT-cell development in raptorf/f-CD4Cre mice could be due to insufficient deletion of mTORC1 during positive selection of these cells in the thymus. Nevertheless, our results demonstrated that mTORC1 is crucial for maturation of iNKT cells from stage 1 to stage 2.
Fig. 2.

Raptor is essential for iNKT-cell development. (A) Absolute numbers of the indicated populations in WT and Raptor-T-KO thymus (mean ± SEM, n = 5). (B) Western blotting analysis of Raptor protein levels in WT and Raptor-T-KO thymocytes. (C) Impaired mTORC1 signaling in Raptor-T-KO thymocytes following TCR engagement. WT and Raptor-T-KO thymocytes were rested in PBS at 37 °C for 30 min and then left unstimulated or stimulated with α-CD3ε antibody for 10 min. Cell lysates were subjected to Western blotting using the indicated antibodies. Data shown are representative of three experiments. (D) TCR-β and CD1d-tet staining of WT and Raptor-T-KO thymocytes, splenocytes, and liver MNCs. Percentages (E) and numbers (F) of iNKT cells in the thymus, spleen, and liver of Raptor-T-KO mice and their WT littermates are shown. Each dot in the graphs represents an individual mouse. Bar graphs represent mean ± SEM (n = 8) from eight experiments. (G) Analysis of iNKT-cell developmental stages in magnetic activated cell sorting (MACS)-enriched thymic CD1d-tet+ cells. Data are representative of five independent experiments. (H) Drastic reduction of stage 2 and stage 3 iNKT cells in Raptor-T-KO mice. Data shown are calculated from eight experiments. *P < 0.05; **P < 0.01; ***P < 0.001 determined by the Student t test.
Developmental Defect of Raptor-Deficient iNKT Cells Is Cell-Intrinsic.
Because Raptor was deleted not only in iNKT cells, but also in other cαβT cells in Raptor-T-KO mice, we sought to determine if the developmental defect of iNKT cells in these mice is due to cell-intrinsic mechanisms. In chimeric mice generated with mixed CD45.1+WT and CD45.2+Raptor-T-KO bone marrow (BM) cells at a 1:8 ratio (Fig. 3A), CD4−CD8−DN, CD4+SP, and CD8+SP thymocyte populations displayed close to 1:8 ratios of WT to Raptor-T-KO cells. The ratio was slightly increased in CD4+CD8+DP thymocyte populations, suggesting the possibility of Raptor playing a role in DP cell expansion and/or survival (Fig. 3B). Overall, Raptor is not essential for cαβT-cell development even in the competitive environment. In contrast to cαβT cells, the iNKT-cell ratio of thymic WT to Raptor-T-KO was increased to 1:0.6 (Fig. 3C). The WT to Raptor-T-KO ratio of stage 0 iNKT cells was similar to that of DP cells, suggesting that positive selection of iNKT cells was intact. The ratio of stage 1 iNKT cells was 1:8 (similar to SP thymocytes). However, the ratios of stage 2 and stage 3 iNKT cells were increased to 1:1 and 98:1, respectively. These data not only indicate that mTORC1 was dispensable for stage 0 to stage 1 but crucial for stage 1 to stage 2 maturation of iNKT cells, but also suggest a potential role of mTORC1 for stage 2 to stage 3 maturation. In addition, Raptor-T-KO iNKT-cell developmental defect is intrinsic, because the presence of WT thymocytes failed to restore normal development.
Fig. 3.
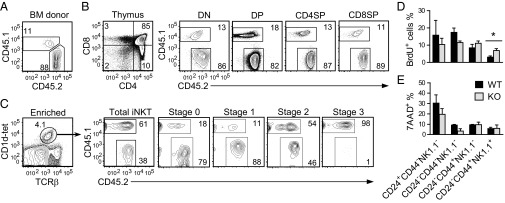
Effects of Raptor deficiency on iNKT-cell proliferation and survival. (A–C) WT (CD45.1+) and Raptorf/f-CD4Cre (CD45.2+) BM cells were mixed at a 1:8 ratio and adoptively transferred into sublethally irradiated TCR-β−/−δ−/− mice. Eight weeks later, thymocytes from the chimeric mice were analyzed for T-cell and iNKT-cell development. (A) CD45.1 and CD45.2 staining of mixed BM cells before injection. (B) cαβT-cell development in chimeric thymus. (C) iNKT-cell development in chimeric mice. CD1d-tet and TCR-β staining of MACS-enriched iNKT thymocytes (Left) and CD45.1 and CD45.2 staining on gated iNKT populations (Right) are shown. Data are representative of five individual chimeras from two experiments. (D) BrdU incorporation in WT and Raptor-T-KO thymic iNKT cells 16 h after BrdU injection. Data shown are mean ± SEM and are representative of three experiments. (E) Death in WT and Raptor-T-KO thymic iNKT cells based on 7AAD staining (mean ± SEM, n = 3). *P < 0.05 determined by the Student t test.
One potential mechanism for the decrease of iNKT cells in the absence of Raptor is impaired expansion of developing iNKT cells. Raptor-T-KO iNKT cells incorporated less BrdU at stage 1 but more at stage 3 than WT controls (Fig. 3D), suggesting that the decreased proliferation of stage 1 iNKT cells may have contributed to the slight reduction of these cells in Raptor-T-KO thymus. 7-Aminoactinomycin D (7AAD) staining did not reveal an increase of death in Raptor-T-KO iNKT cells (Fig. 3E). In fact, Raptor-deficient iNKT cells at stage 1 survived better than WT controls. Together, these results suggest that the decrease of iNKT-cell population by Raptor deficiency depends on, or at least partially on, reduced proliferation but not increased cell death.
mTORC1 Regulates PLZF Subcellular Localization and Function.
As mentioned earlier, PLZF is critical for iNKT-cell maturation from stage 1 to stage 2, as well as for acquisition of effector function in iNKT cells and other innate-like T cells and cαβT cells (6, 7). Because the developmental defect in Raptor-T-KO mice was similar to that in PLZF-deficient mice, it suggests possible cross-regulation between mTORC1 and PLZF. However, intracellular staining did not reveal obvious differences in PLZF protein levels between WT and Raptor-T-KO iNKT cells at stage 1, whereas S6 phosphorylation as a readout for mTORC1 activity was decreased in Raptor-T-KO iNKT cells (Fig. 4A). However, AKT phosphorylation at Ser473 was similar between WT and Raptor-T-KO iNKT cells. These observations suggest that the suppression of mTORC1 signal did not cause a decrease in PLZF expression in iNKT cells. The localization of PLZF in NBs is crucial for its function (8, 20–22). In WT stage 1 iNKT cells, PLZF was localized in both the cytoplasm and PLZF-NBs. However, in Raptor-T-KO stage 1 iNKT cells, PLZF was primarily found in the cytoplasm and PLZF-NBs were virtually undetectable (Fig. 4B). PLZF was also localized in both the cytoplasm and NBs in iNKT-cell hybridoma cells retrovirally transduced with PLZF (PLZF-3C3). Rapamycin treatment to inhibit mTORC1 signaling greatly reduced PLZF-NBs (Fig. 4D) without an obvious impact on PLZF protein expression (Fig. 4C).
Fig. 4.

Critical role of mTORC1 for PLZF localization to the NBs. (A) Intracellular PLZF, pAKT, and pS6 staining in stage 1 WT and Raptor-T-KO iNKT cells. Data are representative of three experiments. % Max, a percentage of maximum height of normalized events. (B) MACS-enriched and FACS-sorted stage 1 iNKT cells from WT and Raptor-T-KO thymocytes were fixed and stained with a mouse anti-PLZF primary antibody and detected with an FITC-conjugated anti-mouse secondary antibody. The nuclei were stained with DAPI (Magnification: 630×.) Data shown are representative of three experiments. 3C3 NKT hybridoma cells stably expressing PLZF (PLZF-3C3) were treated (Rapa) or not treated (Mock) with 2 nM rapamycin for 3 d, and intracellular staining (C) and immunofluorescence microscopic analysis (D) were then applied. Ctrl, cells stained with secondary antibody without primary antibody. Data shown are representative of three experiments. (E) Diminished association of PLZF with its target genes determined by ChIP and quantitative PCR. PLZF-3C3 cells were cultured in the presence or absence of 2 nM Rapa for 2 d and were subjected to ChIP with anti-FLAG or a control IgG, followed by quantitative PCR. Data (mean ± SEM) are presented as a percentage of immunoprecipitated DNA relative to the total input DNA of indicated genes and are representative of three independent experiments. *P < 0.05; **P < 0.01 analyzed by one-way ANOVA. (F) Relative mRNA levels of indicated genes in sorted WT and Raptor-T-KO thymic stage 1 iNKT cells. Data (mean ± SEM) are representative of three experiments. **P < 0.01; ***P < 0.001 analyzed by the Student t test.
PLZF possesses both transcriptional activation and repression functions. It promotes redd1 and maf but suppresses gfi1 transcription (20, 23, 24). Using ChIP and quantitative real-time PCR (qRT-PCR), we found diminished association of PLZF protein with gfi1, redd1, maf, and myc promoters in rapamycin-treated PLZF-3C3 cells compared with mock-treated cells (Fig. 4E). Moreover, mRNA levels of redd1 and maf were decreased and the mRNA level of gfi1 was increased in Raptor-T-KO stage 1 iNKT cells compared with WT controls (Fig. 4F). Together, these results suggest that mTORC1 is an important regulator for PLZF nuclear localization and function.
Raptor Deficiency Impairs iNKT-Cell Effector Function.
iNKT cells rapidly produce high levels of cytokines, such as TNF-α, IL-4, and IFN-γ, following activation. In the absence of PLZF, iNKT cells are defective in production of cytokines upon α-galactosylceramide (α-GalCer) stimulation (6, 7). To examine whether Raptor deficiency can modulate antigen-activated iNKT-cell function, we generated Raptorf/f-ERcre (eKO) mice. Short-term administration of tamoxifen efficiently induced Raptor deletion in eKO thymocytes without obviously affecting iNKT-cell numbers in the thymus, spleen, and liver (Fig. 5A). eKO iNKT cells produced much less TNF-α, IL-4, and IFN-γ than WT controls following stimulation with α-GalCer for 3 d, with the addition of phorbol 12-myristate 13-acetate (PMA), ionomycin, and Golgi-Plug (BD Biosciences) in the last 5 h (Fig. 5B). Moreover, eKO iNKT cells displayed reduced proliferation following α-GalCer stimulation visualized by 5,6-carboxy-fluorescein diacetate succinimidyl ester (CFSE) dilution (Fig. 5C). These results suggest that mTORC1 plays critical roles in antigen-induced iNKT-cell activation in vitro.
Fig. 5.
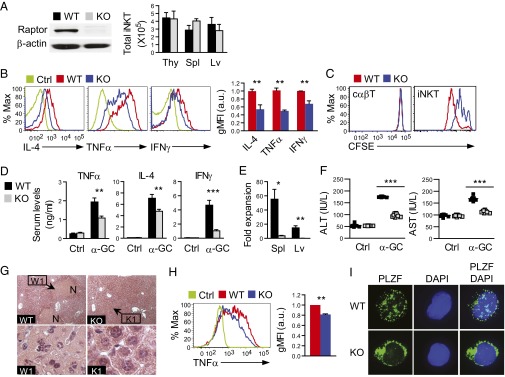
Raptor deficiency impairs iNKT-cell activation in vitro and in vivo. (A) Raptor protein expression in thymocytes and absolute iNKT-cell numbers in the thymus, spleen, and liver of eKO and WT littermates (mean ± SEM, n = 4) following three tamoxifen injections. (B) Decreased cytokine production by Raptor-deficient iNKT cells following antigen stimulation in vitro. Thymocytes from eKO and WT mice were incubated with 125 ng/mL α-GalCer for 3 d, with the addition of PMA plus ionomycin and Golgi-Plug in the last 5 h; overlaid histograms of intracellular cytokine staining in gated iNKT cells are displayed. Bar graphs represent relative geometric mean fluorescence intensity (gMFI) of TNF-α, IL-4, and IFN-γ (n = 3, mean ± SEM). Data shown are representative of or calculated from three experiments. a.u., arbitrary unit. (C) Impaired proliferation of Raptor eKO iNKT cells in vitro. Thymocytes from eKO and WT mice were labeled with CFSE, stimulated with α-GalCer for 3 d, and analyzed by FACS. Overlaid histograms show CFSE intensity in gated CD1d-tet+TCRβ+ iNKT cells and in CD1dTet−TCRβ+ cαβT cells. Data are representative of three experiments. (D) Decreased cytokine production by Raptor eKO iNKT cells in vivo. α-GalCer (0.5 μg) was injected i.v. into eKO and WT mice. Serum cytokine concentrations were accessed by ELISA after 2 h (TNF-α and IL-4) or 12 h (IFN-γ) of stimulation. Error bars represent mean ± SEM (n = 6) and are representative of two independent experiments. (E) Impaired iNKT-cell expansion in vivo following α-GalCer stimulation. Fold expansions represent ratios between the total number of iNKT cells in the spleen and liver 3 d after α-GalCer injection and those injected with PBS of the same genotype (n = 4, mean ± SEM) and are representative of two independent experiments. (F–H) α-GalCer–induced liver injury. Mice were injected i.v. with 2 μg of α-GalCer for 17 h, and the serum and liver tissue were then prepared for measurement of ALT and AST levels (F) and H&E staining (G), respectively. Black dots in scatter plots represent individual mice, and N in photographs designates a necrotic area. (Magnification: WT and KO, 100×; W1 and K1, 1,000×.) Data are representative of two independent experiments with similar results. (H) TNF-α expression in hepatic iNKT cells 90 min after α-GalCer injection. Bar graphs indicate gMFI of TNF-α (n = 3, mean ± SEM) and are representative of two independent experiments. (I) PLZF staining of FACS-sorted iNKT cells from WT and eKO thymocytes after in vitro α-GalCer stimulation for 3 d. (Magnification: 630×.) Data shown are representative of two experiments. *P < 0.05; **P < 0.01; ***P < 0.001 determined by the Student t test.
To determine the role of mTORC1 in iNKT-cell function in vivo further, we injected 0.5 μg of α-GalCer into eKO and WT mice. Administration of α-GalCer activates iNKT cells in vivo, leading to rapid cytokine production and expansion of iNKT cells (25). Consistent with the in vitro data, serum TNF-α, IL-4, and IFN-γ levels were decreased in eKO mice upon α-GalCer stimulation (Fig. 5D). iNKT-cell numbers were drastically increased in WT mice 3 d after α-GalCer injection. In contrast, iNKT-cell numbers in eKO mice remained low, suggesting impaired expansion of iNKT cells in the absence of Raptor (Fig. 5E). Together, these observations suggest that mTORC1 is important for iNKT-cell activation in vivo.
We further investigated the pathophysiological relevance of impaired iNKT-cell function in Raptor-deficient mice using a model of α-GalCer–induced hepatitis (26, 27). Seventeen hours after α-GalCer injection, serum levels of alanine transaminase (ALT) and aspartate transaminase (AST), markers of liver damage, were considerably elevated in WT mice. However, such ALT and AST elevation was diminished in Raptor eKO mice (Fig. 5F), suggesting milder liver damage in these mice than in WT control mice. H&E staining of paraffin-embedded liver thin sections showed patches of massive necrosis accompanying leukocyte infiltration in the liver of WT mice. In contrast, such massive necrosis was virtually absent in the liver of Raptor eKO mice (Fig. 5G). TNF-α released by hepatic iNKT cells plays an important role in liver damage following α-GalCer administration (26, 27). Hepatic iNKT cells isolated from Raptor eKO mice produced lower levels of TNF-α than WT controls (Fig. 5H), which may contribute to the reduced ability of Raptor eKO iNKT cells to induce liver damage. Similar to Raptor-T-KO iNKT cells, PLZF in eKO iNKT cells was predominantly localized in the cytosol but not in the nuclei (Fig. 5I), suggesting that mTORC1 also regulates PLZF NB formation in mature iNKT cells to control their function. Together, these observations indicate that mTORC1 activity is critical for iNKT-cell activation to cause liver damage.
Discussion
mTOR signaling controls diverse cellular processes, including growth, proliferation, differentiation, survival, and function. We demonstrate here a critical role of mTOR in early iNKT-cell development by selectively ablating mTOR in T cells. In T cell-specific mTOR-deficient mice, iNKT-cell numbers are greatly decreased, which started at stage 0. Using Raptor-deficient mice, we demonstrate further that mTORC1 deficiency impedes iNKT-cell maturation from stage 1 to stage 2. Moreover, deletion of Raptor in mature iNKT cells impairs antigen-induced activation of these cells in vitro and in vivo. Because the developmental defect of iNKT cells in Raptor-deficient mice occurs later than in mTOR-deficient mice, our data also suggest that mTORC1-independent mTOR signaling pathways, such as mTORC2 signaling, may play a role during early iNKT-cell development. In addition, TSC1 deficiency induces decreased iNKT cells correlated with hyperactivated mTORC1 (13), suggesting that both hypoactivation and hyperactivation of mTORC1 are detrimental for iNKT-cell development.
The ability of mTOR to sense both intracellular and environmental cues raises the question of how mTOR signaling is triggered during iNKT-cell development and activation. In developing thymocytes as well as peripheral T cells, acute TCR stimulation is able to induce mTOR activation (10). In thymocytes, both diacylglycerol-RasGRP1-Ras-Mek1/2-Erk1/2 and PI3K-PDK1-AKT pathways are activated following TCR engagement, and both are critical for TCR-induced mTOR activation (10). Interestingly, ablation or inhibition of these pathways has a profound impact on iNKT-cell development. RasGRP1-deficient mice display substantial decreases of not only total iNKT cells, but also stage 0 iNKT cells (28). In the absence of PDK1, stage 1–3 but not stage 0 iNKT cells are drastically decreased (29). Moreover, elevated expression of phosphatase and tensin homolog (the phosphatase catalyzing the reverse reaction-mediated PI3K) due to micro-RNA (miRNA) miR-181 deficiency also causes early iNKT-cell developmental defects (30, 31). Based on these observations, we propose that the RasGRP1-Ras-Erk1/2 and PI3K-PDK1-AKT pathways may relay the iVα14TCR signal and possibly other signals to mTOR for promoting iNKT-cell development.
Similar to mTOR, PLZF is a fundamentally important regulator of the development and effector program of iNKT cells (6, 7). In addition to iNKT cells, PLZF controls other lymphoid effector programs and is involved in many major developmental and biological processes, such as megakaryocytic development, stem cell renewal, limb development, and tumorigenesis (8, 32–35). PLZF nuclear localization to the NBs has been proposed to be important for its function. A recent study showed that PLZF binds and recruits E3 ligase Cullin 3 to the nucleus to promote iNKT-cell development (21). Defective PLZF nuclear localization to the NBs in Raptor-deficient iNKT cells and in an iNKT-cell hybridoma treated with rapamycin and diminished association of PLZF to its target genes suggest that mTORC1 may promote PLZF function during iNKT-cell development. Interestingly, mTORC1 has been demonstrated to control nuclear localization of multiple molecules both positively and negatively. It inhibits Lipin1 (a phosphatase for phosphatidic acid) and transcription factor EB nuclear translocation (36–38) but promotes RAR-related orphan receptor-γt nuclear accumulation (19). mTOR itself dynamically shuttles between the nucleus and cytoplasm in a rapamycin-dependent manner (39, 40). Future studies should determine how mTORC1 promotes PLZF localization to the NBs in the control of iNKT-cell development and possibly other important biological processes with both PLZF and mTORC1 playing important roles. Additionally, PLZF can oppose mTORC1 activity through the induction of Redd1 (23). PLZF may function as a negative feedback mechanism to dampen mTORC1 activation. Hyperactivation of mTORC1 poses detrimental effects in other immune cells (12–17). Fine-tuning of mTORC1 and PLZF activities may be crucial for the proper development and function of iNKT cells and many other cell types.
The severe decrease of iNKT cells caused by mTOR deficiency is in sharp contrast to the virtually normal populations of cαβT cells in the thymus of these mice, suggesting a differential requirement of mTOR activity for cαβT-cell and iNKT-cell development. Such difference may be due, in part, to the more dynamic nature of stage 0 and stage 1 iNKT cells than thymocytes committed to the cαβT lineages. Highly proliferative stage 0 and 1 iNKT cells may rely more stringently on mTOR for the proper metabolism and generation of sufficient building blocks necessary for growth and proliferation. In addition, mTOR signaling may be essential for the expression or function of yet to be identified factors other than PLZF that are critical for iNKT-cell maturation. For example, miRNAs have recently emerged as critical regulators of immune cell development and function (41). Expression of Dicer, an essential component of miRNA biogenesis, appears to be dependent on mTORC1 activity (42). miRNA networks have been found to regulate iNKT-cell development and/or function (43–47), but whether mTORC1 promotes iNKT maturation via miRNAs remains to be determined.
iNKT cells regulate the pathogenesis of many diseases. They are enriched in liver MNCs in both mice and humans. Evidence suggests that iNKT cells play complex roles in multiple liver diseases, such as hepatitis and fibrosis (48–50). Our findings that mTORC1 positively regulates iNKT-cell activation upon stimulation with a cognate antigen and is critical for the development of iNKT cell-mediated hepatitis suggest mTOR as a potential therapeutic target for liver autoimmune/inflammatory diseases in which iNKT cells may play an important role.
Materials and Methods
Mice.
mTORf/f, Raptorf/f, and CD4-Cre mice were purchased from the Jackson Laboratory or Taconic Farm. Estrogen receptor (ER)-Cre mice were previously reported (51). The 4- to 8-wk-old mTORf/f-CD4Cre, Raptorf/f-CD4-Cre, and Raptorf/f-ER-Cre mice and their respective Cre-negative (WT) littermates were used for the experiments, which were performed according to protocols approved by the Duke University Institute Animal Care and Use Committee.
Flow Cytometry.
Thymocytes, splenocytes, and liver MNCs were prepared according to published protocols (52). Cells were stained with appropriate fluorochrome-conjugated antibodies in PBS containing 2% (vol/vol) FBS on ice for 30 min, and data were collected using a FACSCanto II flow cytometer (BD Biosciences). Phycoerythrin (PE)- or allophycocyanin-labeled PBS57-loaded CD1d-tet was provided by the National Institutes of Health Tetramer Core Facility. Fluorochrome-conjugated anti-CD4 (GK1.5), CD8 (53-6.7), TCR-β (H57-597), NK1.1 (PK136), CD44 (IM7), CD24 (M1/69), CD45.1 (A20), and CD45.2 (104) were purchased from Biolegend.
Enrichment of iNKT Cells.
iNKT cells were enriched from thymocytes, as previously published (28), with slight modifications. Briefly, 50–100 million thymocytes in 500 μL of Iscove’s modified Dulbecco’s medium (IMDM) with 10% (vol/vol) FBS (IMDM-10) were stained with 2 μL of PE–CD1d-tet on ice for 30 min. After being washed two times, the cells were resuspended in 500 μL of IMDM-10 followed by the addition of 30 μL of anti–PE-conjugated microbeads (Miltenyi Biotec). Following incubation on ice for 30 min, iNKT cells were enriched using LS columns according to the manufacturer’s protocol. Enriched iNKT cells were used for additional staining and FACS analyses or sorting for iNKT cells using a MoFlo FACS (Beckman–Coulter). To detect intracellular PLZF, phospho-AKT (pAKT), or phospho-S6 (pS6), cells fixed and permeabilized using a Foxp3 staining kit (eBioscience) for PLZF and a BD CytoFix/CytoPerm kit (BD Pharmingen) for pS6 and pAKT, were labeled with mouse anti-PLZF (Santa Cruz Biotechnology), rabbit anti-pAKT (Ser473; Cell Signaling Technology), or rabbit anti-pS6 (Ser240/244; Cell Signaling Technology) antibodies and detected with FITC-conjugated anti-mouse or rabbit secondary antibodies (1:400). Data were analyzed using FlowJo Version 9.2 software (TreeStar).
Mixed BM Chimeric Mice.
Seven-week-old TCR-β/δ double-KO mice were subjected to sublethal irradiation (600 rad). Twelve hours later, BM cells from tibias and femurs of WT control (CD45.1) and Raptorf/f-CD4cre (CD45.2) mice were mixed at a 1:8 ratio, and a total of 1 × 10⁷ cells were i.v. injected into the irradiated mice. The chimeras were analyzed 6 wk later.
Western Blotting.
Thymocytes were rested in PBS at 37 °C for 30 min and left unstimulated or stimulated with an anti-CD3ε antibody (500A2) at 37 °C for 10 min. Cells were lysed in radioimmunoprecipitation assay buffer [0.1% SDS, 1% Triton X-100, 0.25% sodium deoxycholate, 150 mM NaCl, 50 mM Tris (pH 7.4)] with a freshly added protease inhibitor mixture and phosphatase inhibitors. Proteins were resolved by SDS/PAGE, transferred to a Trans-Blot Nitrocellulose membrane (Bio-Rad), and probed with the following antibodies: anti-Raptor, anti–phospho-4E-BP1 (Thr37/46) and total 4E-BP1, anti-pS6 (Ser235/236) and total S6, anti–phospho-Erk1/2 (Thr202/Tyr204) and total Erk1/2, anti–phospho-PLC-γ1 (Tyr783) and total PLC-γ1, and anti-pAKT (Ser473) antibodies from Cell Signaling Technology.
Immunofluorescence Microscopic Analysis.
Sorted stage 1 iNKT, α-GalCer–stimulated iNKT, or stably FLAG-PLZF–expressing 3C3 NKT hybridoma (PLZF-3C3) cells were cytospun on slides using a cytocentrifuge (Shandon Cytospin 3 cytocentrifuge; Thermo Scientific) at 600 rpm for 5 min, fixed with 4% paraformaldehyde, and then permeabilized with 0.1% Triton X-100. The samples were incubated with a mouse anti-PLZF antibody (4 μg/mL) for 1 h, further stained with an FITC-conjugated anti-mouse secondary antibody (1:400, Molecular Probes) for 30 min, and finally covered with VECTASHIELD mounting medium containing 1.5 μg/mL DAPI (Vector Laboratory). Images were collected using a Zeiss ApoTome system and AxioVision software (Carl Zeiss) with a 63× oil objective and a CoolSNAP HQ CCD camera (Roper Scientific). Photoshop (Adobe Systems) was used for postacquisition processing of brightness and contrast.
qRT-PCR.
Total RNAs were isolated from magnetic bead-enriched and then FACS-sorted stage 1 iNKT cells using TRIzol Reagent (Sigma) and were reversely transcribed using the iScript cDNA Synthesis Kit (Bio-Rad). qRT-PCR was performed with Mastercycler realplex (Eppendorf) and SsoFast EvaGreen Supermix (Bio-Rad) with the following primer pairs: gfi1 (5′-AGGAGGCACCGAGAGACTCA-3′ and 5′-GGGAGGCAGGGAAGACATC-3′), redd1 (5′-AGGAGGCACCGAGAGACTCA and GGGAGGCAGGGAAGACATC-3′), maf (5′-AATCCTGGCCTGTTTCACAT-3′ and 5′-TGACGCCAACATAGGAGGTG-3′), and myc (5′-TGAAGGCTGGATTTCCTTTG-3′ and 5′-TTCTCTTCCTCGTCGCAGAT-3′). Expressed levels of target mRNAs were normalized with β-actin and calculated using the 2-ΔΔCT method.
ChIP.
ChIP analysis was performed as previously described (53). Briefly, PLZF-3C3 cells were cultured in the presence or absence of 2 nM rapamycin for 2 d. Ten million cells were cross-linked with 1% formaldehyde for 8–10 min at room temperature. The reaction was stopped with the addition of glycine to 0.125 M. Nuclei were lysed with NLB buffer [50 mM Tris (pH 8.1), 10 mM EDTA, 1% SDS, protease inhibitor mixture] and sonicated using a Misonics sonicator S-4000. Lysates were incubated with anti–FLAG-conjugated agarose beads at 4 °C overnight and then washed five times with LiCl wash buffer [100 mM Tris (pH 7.5), 500 mM LiCl, 1% Nonidet P-40, 1% sodium deoxycholate] and two times with TE [10 mM Tris (pH 8.0), 1 mM EDTA]. After elution of DNA with elution buffer (1% SDS, 100 mM NaHCO3), ChIP samples were de–cross-linked at 65 °C overnight, followed by proteinase K treatment. DNA was purified using a PCR Purification Kit (Qiagen) and analyzed by qRT-PCR. The primers used were gfi1 (5′-GCCTCTAACGCTCAGGAAGT-3′ and 5′-CTTGCTTTCGGGAGAGACTG-3′), redd1 (5′-CCTCGCCTGAATGATGAAAC-3′ and 5′-CAATTCAATGGAACCCAGGA-3′), maf (5′-TCACTTGCAGAGAGGGACAA-3′ and 5′-CCATCCTCTGCATCTTTCGT-3′), and myc (5′-ACTCATTCGTTCGTCCTTCC-3′ and 5′-CTCCACACAATACGCCATGT-3′). Precipitated DNA was calculated as a percentage of input DNA.
iNKT-Cell Proliferation and Death.
Thymocytes were labeled with 5 μM CFSE at room temperature for 9 min as previously described (28, 54), and 1 × 10⁷ labeled cells were then seeded in 48-well plates with or without 125 ng/mL α-GalCer for 3 d. CD1d-tet+TCR-β+ and CD1d-tet−TCR-β+ cells were analyzed by flow cytometry. For in vivo cell proliferation analysis, mice were i.p. injected with 1.5 mg of BrdU in PBS. Sixteen hours later, thymic iNKT cells were enriched using PE–CD1d-tet and stained for CD24, CD44, NK1.1, and TCR-β surface expression. Afterward, samples were intracellularly stained for BrdU using an FITC BrdU Flow Kit (BD Pharmingen). To access in vivo cell death, enriched iNKT cells were stained with 7AAD (2 μg/mL; Life Technologies), together with cell surface antibodies.
α-GalCer–Induced Cytokines.
Thymocytes were stimulated with α-GalCer for 3 d and further incubated with PMA (50 ng/mL) plus ionomycin (500 ng/mL) in the presence of Golgi-Plug protein transport inhibitor (1:1,000; BD Biosciences) for 5 h. Afterward, the cells were harvested and stained using a Cytofix/Cytoperm Fixation/Permeabilization Kit (BD Biosciences). Anti–IL-4 (11B11), anti–IFN-γ (XMG1.2), and anti–TNF-α (MP6-XT22) antibodies were from BioLegend. To measure in vivo cytokine levels, mice were injected i.v. with 0.5 μg of α-GalCer in PBS. At 2 h for IL-4 and TNF-α and at 12 h for IFN-γ, the sera from immunized mice were collected and the levels of indicated cytokines were determined using Mouse ELISA Max (BioLegend) according to the manufacturer’s instructions.
α-GalCer–Induced Hepatitis.
Mice were injected i.v. with 2 μg of α-GalCer, and serum and liver tissue from the immunized mice were collected 17 h postinjection. To assess for liver damage, ALT/AST levels in serum were determined using 5 μL of serum by means of a serum ALT/AST enzyme activity assay kit (BioTron Diagnostics, Inc.). The livers were used to determine intracellular TNF-α levels after 90 min of stimulation or were fixed with 10% formalin overnight, dehydrated with 70% ethanol, and embedded in paraffin. H&E staining of thin sections was performed following standard protocols.
Statistical Analysis.
To compare the difference between WT and KO values, a two-tailed Student t test, the Mann–Whitney U test, or ANOVA was performed using GraphPad PRISM analysis software (*P < 0.05; **P < 0.01; ***P < 0.001).
Acknowledgments
We thank Drs. Kim Nichols and Mitchell Kronenberg for the iNKT hybridoma, the National Institutes (NIH) of Health Tetramer Core Facility for CD1d-tet, and the flow cytometry core facility at Duke University for cell sorting. The study is supported by the NIH (Grants AI076357, AI079088, and AI101206), the Chinese National Science Foundation (Grants 31071237 and 31270958), and the American Cancer Society (Grant RSG-08-186-01-LIB).
Footnotes
The authors declare no conflict of interest.
This article is a PNAS Direct Submission.
References
- 1.Bendelac A, Savage PB, Teyton L. The biology of NKT cells. Annu Rev Immunol. 2007;25:297–336. doi: 10.1146/annurev.immunol.25.022106.141711. [DOI] [PubMed] [Google Scholar]
- 2.Gapin L, Godfrey DI, Rossjohn J. Natural Killer T cell obsession with self-antigens. Curr Opin Immunol. 2013;25(2):168–173. doi: 10.1016/j.coi.2013.01.002. [DOI] [PMC free article] [PubMed] [Google Scholar]
- 3.Van Kaer L. NKT cells: T lymphocytes with innate effector functions. Curr Opin Immunol. 2007;19(3):354–364. doi: 10.1016/j.coi.2007.03.001. [DOI] [PubMed] [Google Scholar]
- 4.Cerundolo V, Kronenberg M. The role of invariant NKT cells at the interface of innate and adaptive immunity. Semin Immunol. 2010;22(2):59–60. doi: 10.1016/j.smim.2010.01.002. [DOI] [PubMed] [Google Scholar]
- 5.Cui J, et al. Requirement for Valpha14 NKT cells in IL-12-mediated rejection of tumors. Science. 1997;278(5343):1623–1626. doi: 10.1126/science.278.5343.1623. [DOI] [PubMed] [Google Scholar]
- 6.Kovalovsky D, et al. The BTB-zinc finger transcriptional regulator PLZF controls the development of invariant natural killer T cell effector functions. Nat Immunol. 2008;9(9):1055–1064. doi: 10.1038/ni.1641. [DOI] [PMC free article] [PubMed] [Google Scholar]
- 7.Savage AK, et al. The transcription factor PLZF directs the effector program of the NKT cell lineage. Immunity. 2008;29(3):391–403. doi: 10.1016/j.immuni.2008.07.011. [DOI] [PMC free article] [PubMed] [Google Scholar]
- 8.Suliman BA, Xu D, Williams BR. The promyelocytic leukemia zinc finger protein: Two decades of molecular oncology. Front Oncol. 2012;2:74. doi: 10.3389/fonc.2012.00074. [DOI] [PMC free article] [PubMed] [Google Scholar]
- 9.Laplante M, Sabatini DM. mTOR signaling in growth control and disease. Cell. 2012;149(2):274–293. doi: 10.1016/j.cell.2012.03.017. [DOI] [PMC free article] [PubMed] [Google Scholar]
- 10.Gorentla BK, Wan CK, Zhong XP. Negative regulation of mTOR activation by diacylglycerol kinases. Blood. 2011;117(15):4022–4031. doi: 10.1182/blood-2010-08-300731. [DOI] [PMC free article] [PubMed] [Google Scholar]
- 11.Powell JD, Pollizzi KN, Heikamp EB, Horton MR. Regulation of immune responses by mTOR. Annu Rev Immunol. 2012;30:39–68. doi: 10.1146/annurev-immunol-020711-075024. [DOI] [PMC free article] [PubMed] [Google Scholar]
- 12.O’Brien TF, et al. Regulation of T-cell survival and mitochondrial homeostasis by TSC1. Eur J Immunol. 2011;41(11):3361–3370. doi: 10.1002/eji.201141411. [DOI] [PMC free article] [PubMed] [Google Scholar]
- 13.Yang K, Neale G, Green DR, He W, Chi H. The tumor suppressor Tsc1 enforces quiescence of naive T cells to promote immune homeostasis and function. Nat Immunol. 2011;12(9):888–897. doi: 10.1038/ni.2068. [DOI] [PMC free article] [PubMed] [Google Scholar]
- 14.Pan H, O’Brien TF, Zhang P, Zhong XP. The role of tuberous sclerosis complex 1 in regulating innate immunity. J Immunol. 2012;188(8):3658–3666. doi: 10.4049/jimmunol.1102187. [DOI] [PMC free article] [PubMed] [Google Scholar]
- 15.Shin J, Pan H, Zhong XP. Regulation of mast cell survival and function by tuberous sclerosis complex 1. Blood. 2012;119(14):3306–3314. doi: 10.1182/blood-2011-05-353342. [DOI] [PMC free article] [PubMed] [Google Scholar]
- 16.Xie DL, Wu J, Lou YL, Zhong XP. Tumor suppressor TSC1 is critical for T-cell anergy. Proc Natl Acad Sci USA. 2012;109(35):14152–14157. doi: 10.1073/pnas.1119744109. [DOI] [PMC free article] [PubMed] [Google Scholar]
- 17.Zhang L, et al. TSC1/2 signaling complex is essential for peripheral naïve CD8+ T cell survival and homeostasis in mice. PLoS ONE. 2012;7(2):e30592. doi: 10.1371/journal.pone.0030592. [DOI] [PMC free article] [PubMed] [Google Scholar]
- 18.Delgoffe GM, et al. The mTOR kinase differentially regulates effector and regulatory T cell lineage commitment. Immunity. 2009;30(6):832–844. doi: 10.1016/j.immuni.2009.04.014. [DOI] [PMC free article] [PubMed] [Google Scholar]
- 19.Kurebayashi Y, et al. PI3K-Akt-mTORC1-S6K1/2 axis controls Th17 differentiation by regulating Gfi1 expression and nuclear translocation of RORγ. Cell Rep. 2012;1(4):360–373. doi: 10.1016/j.celrep.2012.02.007. [DOI] [PubMed] [Google Scholar]
- 20.Doulatov S, et al. PLZF is a regulator of homeostatic and cytokine-induced myeloid development. Genes Dev. 2009;23(17):2076–2087. doi: 10.1101/gad.1788109. [DOI] [PMC free article] [PubMed] [Google Scholar]
- 21.Mathew R, et al. BTB-ZF factors recruit the E3 ligase cullin 3 to regulate lymphoid effector programs. Nature. 2012;491(7425):618–621. doi: 10.1038/nature11548. [DOI] [PMC free article] [PubMed] [Google Scholar]
- 22.Reid A, et al. Leukemia translocation gene, PLZF, is expressed with a speckled nuclear pattern in early hematopoietic progenitors. Blood. 1995;86(12):4544–4552. [PubMed] [Google Scholar]
- 23.Hobbs RM, Seandel M, Falciatori I, Rafii S, Pandolfi PP. Plzf regulates germline progenitor self-renewal by opposing mTORC1. Cell. 2010;142(3):468–479. doi: 10.1016/j.cell.2010.06.041. [DOI] [PMC free article] [PubMed] [Google Scholar]
- 24.Gleimer M, von Boehmer H, Kreslavsky T. PLZF Controls the Expression of a Limited Number of Genes Essential for NKT Cell Function. Front Immunol. 2012;3:374. doi: 10.3389/fimmu.2012.00374. [DOI] [PMC free article] [PubMed] [Google Scholar]
- 25.Uldrich AP, et al. NKT cell stimulation with glycolipid antigen in vivo: Costimulation-dependent expansion, Bim-dependent contraction, and hyporesponsiveness to further antigenic challenge. J Immunol. 2005;175(5):3092–3101. doi: 10.4049/jimmunol.175.5.3092. [DOI] [PMC free article] [PubMed] [Google Scholar]
- 26.Inui T, et al. Neutralization of tumor necrosis factor abrogates hepatic failure induced by alpha-galactosylceramide without attenuating its antitumor effect in aged mice. J Hepatol. 2005;43(4):670–678. doi: 10.1016/j.jhep.2005.02.027. [DOI] [PubMed] [Google Scholar]
- 27.Biburger M, Tiegs G. Alpha-galactosylceramide-induced liver injury in mice is mediated by TNF-alpha but independent of Kupffer cells. J Immunol. 2005;175(3):1540–1550. doi: 10.4049/jimmunol.175.3.1540. [DOI] [PubMed] [Google Scholar]
- 28.Shen S, et al. Critical roles of RasGRP1 for invariant NKT cell development. J Immunol. 2011;187(9):4467–4473. doi: 10.4049/jimmunol.1003798. [DOI] [PMC free article] [PubMed] [Google Scholar]
- 29.Finlay DK, et al. Temporal differences in the dependency on phosphoinositide-dependent kinase 1 distinguish the development of invariant Valpha14 NKT cells and conventional T cells. J Immunol. 2010;185(10):5973–5982. doi: 10.4049/jimmunol.1000827. [DOI] [PMC free article] [PubMed] [Google Scholar]
- 30.Henao-Mejia J, et al. The microRNA miR-181 is a critical cellular metabolic rheostat essential for NKT cell ontogenesis and lymphocyte development and homeostasis. Immunity. 2013;38(5):984–997. doi: 10.1016/j.immuni.2013.02.021. [DOI] [PMC free article] [PubMed] [Google Scholar]
- 31.Ziętara N, et al. Critical role for miR-181a/b-1 in agonist selection of invariant natural killer T cells. Proc Natl Acad Sci USA. 2013;110(18):7407–7412. doi: 10.1073/pnas.1221984110. [DOI] [PMC free article] [PubMed] [Google Scholar]
- 32.Raberger J, et al. The transcriptional regulator PLZF induces the development of CD44 high memory phenotype T cells. Proc Natl Acad Sci USA. 2008;105(46):17919–17924. doi: 10.1073/pnas.0805733105. [DOI] [PMC free article] [PubMed] [Google Scholar]
- 33.Petrie K, et al. Retinoblastoma protein and the leukemia-associated PLZF transcription factor interact to repress target gene promoters. Oncogene. 2008;27(39):5260–5266. doi: 10.1038/onc.2008.159. [DOI] [PubMed] [Google Scholar]
- 34.Weinreich MA, Odumade OA, Jameson SC, Hogquist KA. T cells expressing the transcription factor PLZF regulate the development of memory-like CD8+ T cells. Nat Immunol. 2010;11(8):709–716. doi: 10.1038/ni.1898. [DOI] [PMC free article] [PubMed] [Google Scholar]
- 35.Kovalovsky D, et al. PLZF induces the spontaneous acquisition of memory/effector functions in T cells independently of NKT cell-related signals. J Immunol. 2010;184(12):6746–6755. doi: 10.4049/jimmunol.1000776. [DOI] [PubMed] [Google Scholar]
- 36.Peterson TR, et al. mTOR complex 1 regulates lipin 1 localization to control the SREBP pathway. Cell. 2011;146(3):408–420. doi: 10.1016/j.cell.2011.06.034. [DOI] [PMC free article] [PubMed] [Google Scholar]
- 37.Roczniak-Ferguson A, et al. The transcription factor TFEB links mTORC1 signaling to transcriptional control of lysosome homeostasis. Sci Signal. 2012;5(228):ra42. doi: 10.1126/scisignal.2002790. [DOI] [PMC free article] [PubMed] [Google Scholar]
- 38.Martina JA, Chen Y, Gucek M, Puertollano R. MTORC1 functions as a transcriptional regulator of autophagy by preventing nuclear transport of TFEB. Autophagy. 2012;8(6):903–914. doi: 10.4161/auto.19653. [DOI] [PMC free article] [PubMed] [Google Scholar]
- 39.Kim JE, Chen J. Cytoplasmic-nuclear shuttling of FKBP12-rapamycin-associated protein is involved in rapamycin-sensitive signaling and translation initiation. Proc Natl Acad Sci USA. 2000;97(26):14340–14345. doi: 10.1073/pnas.011511898. [DOI] [PMC free article] [PubMed] [Google Scholar]
- 40.Li H, Tsang CK, Watkins M, Bertram PG, Zheng XF. Nutrient regulates Tor1 nuclear localization and association with rDNA promoter. Nature. 2006;442(7106):1058–1061. doi: 10.1038/nature05020. [DOI] [PubMed] [Google Scholar]
- 41.O’Connell RM, Rao DS, Chaudhuri AA, Baltimore D. Physiological and pathological roles for microRNAs in the immune system. Nat Rev Immunol. 2010;10(2):111–122. doi: 10.1038/nri2708. [DOI] [PubMed] [Google Scholar]
- 42.Gibbings D, et al. Selective autophagy degrades DICER and AGO2 and regulates miRNA activity. Nat Cell Biol. 2012;14(12):1314–1321. doi: 10.1038/ncb2611. [DOI] [PMC free article] [PubMed] [Google Scholar]
- 43.Fedeli M, et al. Dicer-dependent microRNA pathway controls invariant NKT cell development. J Immunol. 2009;183(4):2506–2512. doi: 10.4049/jimmunol.0901361. [DOI] [PubMed] [Google Scholar]
- 44.Zhou L, et al. Tie2cre-induced inactivation of the miRNA-processing enzyme Dicer disrupts invariant NKT cell development. Proc Natl Acad Sci USA. 2009;106(25):10266–10271. doi: 10.1073/pnas.0811119106. [DOI] [PMC free article] [PubMed] [Google Scholar]
- 45.Bezman NA, Chakraborty T, Bender T, Lanier LL. miR-150 regulates the development of NK and iNKT cells. J Exp Med. 2011;208(13):2717–2731. doi: 10.1084/jem.20111386. [DOI] [PMC free article] [PubMed] [Google Scholar]
- 46.Zheng QH, Zhou L, Mi QS. MicroRNA miR-150 is involved in Vα14 invariant NKT cell development and function. J Immunol. 2012;188(5):2118–2126. doi: 10.4049/jimmunol.1103342. [DOI] [PMC free article] [PubMed] [Google Scholar]
- 47.Yuan J, Nguyen CK, Liu X, Kanellopoulou C, Muljo SA. Lin28b reprograms adult bone marrow hematopoietic progenitors to mediate fetal-like lymphopoiesis. Science. 2012;335(6073):1195–1200. doi: 10.1126/science.1216557. [DOI] [PMC free article] [PubMed] [Google Scholar]
- 48.Dennert G, Aswad F. The role of NKT cells in animal models of autoimmune hepatitis. Crit Rev Immunol. 2006;26(5):453–473. doi: 10.1615/critrevimmunol.v26.i5.50. [DOI] [PubMed] [Google Scholar]
- 49.Wang H, Feng D, Park O, Yin S, Gao B. Invariant NKT cell activation induces neutrophil accumulation and hepatitis: Opposite regulation by IL-4 and IFN-γ. Hepatology. 2013;58(4):1474–1485. doi: 10.1002/hep.26471. [DOI] [PMC free article] [PubMed] [Google Scholar]
- 50.Santodomingo-Garzon T, Swain MG. Role of NKT cells in autoimmune liver disease. Autoimmun Rev. 2011;10(12):793–800. doi: 10.1016/j.autrev.2011.06.003. [DOI] [PubMed] [Google Scholar]
- 51.Shapiro-Shelef M, Lin KI, Savitsky D, Liao J, Calame K. Blimp-1 is required for maintenance of long-lived plasma cells in the bone marrow. J Exp Med. 2005;202(11):1471–1476. doi: 10.1084/jem.20051611. [DOI] [PMC free article] [PubMed] [Google Scholar]
- 52.Shen S, et al. Tight regulation of diacylglycerol-mediated signaling is critical for proper invariant NKT cell development. J Immunol. 2011;187(5):2122–2129. doi: 10.4049/jimmunol.1100495. [DOI] [PMC free article] [PubMed] [Google Scholar]
- 53.Pan H, et al. Critical role of the tumor suppressor tuberous sclerosis complex 1 in dendritic cell activation of CD4 T cells by promoting MHC class II expression via IRF4 and CIITA. J Immunol. 2013;191(2):699–707. doi: 10.4049/jimmunol.1201443. [DOI] [PMC free article] [PubMed] [Google Scholar]
- 54.Wu J, Shen S, Yang J, Xia Z, Zhong XP. Diacylglycerol kinase zeta positively controls the development of iNKT-17 cells. PLoS ONE. 2013;8(9):e75202. doi: 10.1371/journal.pone.0075202. [DOI] [PMC free article] [PubMed] [Google Scholar]