

Significance
Ras is a key signaling molecule in living cells, and mutations in Ras are involved in 30% of human cancers. It is becoming progressively more clear that the spatial arrangement of proteins within a cell, not just their chemical structure, is an important aspect of their function. In this work, we use a series of quantitative physical techniques to map out the tendency of two Ras molecules to bind together to form a dimer on membrane surfaces. Insights from this work, as well as the technical assays developed, may help to discover new therapeutic drugs capable of modulating the errant behavior of Ras in cancer.
Keywords: Ras signaling, Ras assay
Abstract
The lipid-anchored small GTPase Ras is an important signaling node in mammalian cells. A number of observations suggest that Ras is laterally organized within the cell membrane, and this may play a regulatory role in its activation. Lipid anchors composed of palmitoyl and farnesyl moieties in H-, N-, and K-Ras are widely suspected to be responsible for guiding protein organization in membranes. Here, we report that H-Ras forms a dimer on membrane surfaces through a protein–protein binding interface. A Y64A point mutation in the switch II region, known to prevent Son of sevenless and PI3K effector interactions, abolishes dimer formation. This suggests that the switch II region, near the nucleotide binding cleft, is either part of, or allosterically coupled to, the dimer interface. By tethering H-Ras to bilayers via a membrane-miscible lipid tail, we show that dimer formation is mediated by protein interactions and does not require lipid anchor clustering. We quantitatively characterize H-Ras dimerization in supported membranes using a combination of fluorescence correlation spectroscopy, photon counting histogram analysis, time-resolved fluorescence anisotropy, single-molecule tracking, and step photobleaching analysis. The 2D dimerization Kd is measured to be ∼1 × 10³ molecules/µm2, and no higher-order oligomers were observed. Dimerization only occurs on the membrane surface; H-Ras is strictly monomeric at comparable densities in solution. Analysis of a number of H-Ras constructs, including key changes to the lipidation pattern of the hypervariable region, suggest that dimerization is a general property of native H-Ras on membrane surfaces.
In mammalian signal transduction, Ras functions as a binary switch in fundamental processes including proliferation, differentiation, and survival (1). Ras is a network hub; various upstream signaling pathways can activate Ras-GDP to Ras-GTP, which subsequently selects between multiple downstream effectors to elicit a varied but specific biochemical response (2, 3). Signaling specificity is achieved by a combination of conformational plasticity in Ras itself (4, 5) and dynamic control of Ras spatial organization (6, 7). Isoform-specific posttranslational lipidation targets the main H-, N-, and K-Ras isoforms to different subdomains of the plasma membrane (8–10). For example, H-Ras localizes to cholesterol-sensitive membrane domains, whereas K-Ras does not (11). A common C-terminal S-farnesyl moiety operates in concert with one (N-Ras) or two (H-Ras) palmitoyl groups, or with a basic sequence of six lysines in K-Ras4B (12), to provide the primary membrane anchorage. Importantly, the G-domain (residues 1–166) and the hypervariable region (HVR) (residues 167–189) dynamically modulate the lipid anchor localization preference to switch between distinct membrane populations (13). For example, repartitioning of H-Ras away from cholesterol-sensitive membrane domains is necessary for efficient activation of the effector Raf and GTP loading of the G-domain promotes this redistribution by a mechanism that requires the HVR (14). However, the molecular details of the coupling between lipid anchor partitioning and nucleotide-dependent protein–membrane interactions remain unclear.
In addition to biochemical evidence for communication between the C-terminal membrane binding region and the nucleotide binding pocket, NMR and IR spectroscopic observations suggest that the HVR and lipid anchor membrane insertion affects Ras structure and orientation (15–17). Molecular dynamics (MD) modeling of bilayer-induced H-Ras conformations has identified two nucleotide-dependent states, which differ in HVR conformation, membrane contacts, and G-domain orientation (18). In vivo FRET measurements are consistent with a reorientation of Ras with respect to the membrane upon GTP binding (19, 20). Further modeling showed that the membrane binding region and the canonical switch I and II regions communicate across the protein via long-range side-chain interactions (21) in a conformational selection mechanism (22). Whereas these allosteric modes likely contribute to Ras partitioning and reorientation in vivo, direct functional consequences on Ras protein–protein interactions are poorly understood.
Members of the Ras superfamily of small GTPases are widely considered to be monomeric (23). However, several members across the Ras GTPase subfamilies are now known to dimerize (24–28), and a class of small GTPases that use dimerization instead of GTPase activating proteins (GAPs) for GTPase activity has been identified (29). Recently, semisynthetic natively lipidated N-Ras was shown to cluster on supported membranes in vitro, in a manner broadly consistent with molecular mechanics (MM) modeling of dimers (30). For Ras, dimerization could be important because Raf, which is recruited to the membrane by binding to Ras, requires dimerization for activation. Soluble Ras does not activate Raf in vitro (31), but because artificial dimerization of GST-fused H-Ras leads to Raf activation in solution, it has been hypothesized that Ras dimers exist on membranes (32). However, presumed dimers were only detected after chemical cross-linking (32), and the intrinsic oligomeric properties of Ras remain unknown.
Here, we use a combination of time-resolved fluorescence spectroscopy and microscopy to characterize H-Ras(C118S, 1–181) and H-Ras(C118S, 1–184) [referred to as Ras(C181) and Ras(C181,C184) from here on] anchored to supported lipid bilayers. By tethering H-Ras to membranes at cys181 (or both at cys181 and cys184) via a membrane-miscible lipid tail, we eliminate effects of lipid anchor clustering while preserving the HVR region between the G-domain and the N-terminal palmitoylation site at cys181 (or cys184), which is predicted to undergo large conformational changes upon membrane binding and nucleotide exchange (18). Labeling is achieved through a fluorescent Atto488-linked nucleotide. Fluorescence correlation spectroscopy (FCS) and time-resolved fluorescence anisotropy (TRFA) show that H-Ras forms surface density-dependent clusters. Photon counting histogram (PCH) analysis and single-molecule tracking (SMT) reveal that H-Ras clusters are dimers and that no higher-order oligomers are formed. A Y64A point mutation in the loop between beta strand 3 (β3) and alpha helix 2 (α2) abolishes dimer formation, suggesting that the corresponding switch II (SII) region is either part of, or allosterically coupled to, the dimer interface. The 2D dimerization Kd is measured to be on the order of 1 × 10³ molecules/µm2, within the broad range of Ras surface densities measured in vivo (10, 33–35). Dimerization only occurs on the membrane surface; H-Ras is strictly monomeric at comparable densities in solution, suggesting that a membrane-induced structural change in H-Ras leads to dimerization. Comparing singly lipidated Ras(C181) and doubly lipidated Ras(C181,C184) reveals that dimer formation is insensitive to the details of HVR lipidation, suggesting that dimerization is a general property of H-Ras on membrane surfaces.
Results
H-Ras Exhibits Reduced Translational and Rotational Mobility on Supported Membranes.
In these experiments, Ras(C181) or Ras(C181,C184) are attached to the membrane via coupling of cysteines C181 and C184 in the HVR to maleimide functionalized lipid, 1,2-dioleoyl-sn-glycero-3-phosphoethanolamine-N-[4-(p-maleimidomethyl)cyclohexane-carboxamide] (MCC-DOPE) (Fig. 1A). Because MCC-DOPE is fully miscible in the lipid bilayer, clustering as a result of the lipid anchor itself is avoided. In native H-Ras, palmitoylation takes place in the same two cysteine residues, C181 and C184.
Fig. 1.

Lateral diffusion of H-Ras on membranes. (A) Two possible H-Ras orientations when tethered onto a lipid membrane (modified from ref. 18). The secondary structure of H-Ras G-domain (aa 1–166) is shown in cartoon mode. The portion of HVR (aa 167–184) used in the present work is in orange just above the top leaflet of the bilayer (gray). The lipid anchor, MCC-DOPE, is not included. (B) Schematic of two-color FCS setup. (C) Normalized auto-correlation functions, G(τ), of Ras(C181)-GDP and TR lipid at an H-Ras surface density of 312 molecules/μm2. The diffusion time constants, τtrans, are normalized to the detection area. The calculated diffusion coefficients are 3.39 ± 0.15 μm2/s and 1.12 ± 0.04 μm2/s for lipid and H-Ras, respectively. (D) G(τ) of Ras(Y64A,C181)-GDP and TR lipid at a Ras(Y64A,C181) surface density of 293 molecules/μm2 with a calculated D of 3.39 ± 0.05 μm2/s and 3.16 ± 0.07 μm2/s, respectively. (E) Diffusion step-size histogram from SMT analysis (circles) with Ds obtained by fitting data into a solution of the Einstein diffusion equation (lines). For H-Ras, a two-component model (solid black line) and a single-component model (dashed black line) are shown.
Two-color FCS allows the translational mobility of lipids and membrane-linked H-Ras to be monitored simultaneously from the same spot (Fig. 1B). A small percentage (0.005 mol %) of Texas Red 1,2-dihexadecanoyl-sn-glycero-3-phosphoethanolamine (TR-DHPE) lipid is included in the membrane, whereas H-Ras is loaded with fluorescent nucleotide, Atto488-GDP or Atto488–GppNp. Normalized autocorrelation functions, G(τ), of fluorescence fluctuations in the lipid and Ras(C181) channels are illustrated in Fig. 1C. Measured autocorrelation times correspond to diffusion coefficients, D, of 3.39 ± 0.15 μm2/s and 1.12 ± 0.04 μm2/s for TR-DHPE lipid and Ras(C181) respectively. Ras(C181) exhibits faster mobility than the doubly anchored Ras(C181,C184) constructs, providing confirmation that both anchor sites are coupled to lipids.
Unrestricted lateral diffusion of lipid-anchored proteins is dominated by the properties of the membrane component (36), both in vivo (37) and in vitro (38, 39). For the singly linked Ras(C181), its mobility is expected to be comparable to the lipids (40). The pronounced lower mobility we observe suggests protein clustering on the membrane or additional protein–lipid interactions. A Y64A point mutation in H-Ras, originally identified as a Son of sevenless (SOS) interaction-blocking mutation (41), abolishes the reduced lateral diffusion. FCS measurements reveal that the Ras(Y64A,C181) mutant and lipid diffuse at identical rates (Fig. 1D). Y64 is situated in the SII region on the opposite side of H-Ras from the membrane proximal C terminus (Fig. 1A).
FCS provides an average value of H-Ras mobility on the membrane. To probe the distribution within the ensemble we use SMT. With the surface density used here, prephotobleaching of a field of view is necessary (Movie S1). Fluorescent particles can then be individually resolved and tracked (42) (Movie S2). The corresponding diffusion step-size histograms for Ras(C181) and Ras(Y64A,C181) are shown in Fig. 1E. Ras(C181) diffusion is characterized by shorter steps relative to Ras(Y64A,C181). We infer D by fitting the step-size distributions to a solution of the Einstein diffusion equation in cylindrical coordinates (SI Materials and Methods and Fig. S1). For Ras(Y64A,C181), the step-size distribution is well described by a single-species analysis, yielding a D value of 3.54 ± 0.05 µm2/s. For Ras(C181), a single-species model cannot describe the diffusion step-size histogram (Fig. 1E), indicating that the ensemble contains multiple diffusing species. When a two-species model is used, the fast diffusing species has a D similar (3.3 ± 0.03 µm2/s) to that of the lipid and Ras(Y64A,C181), whereas the slow-diffusing species has a D of 0.81 ± 0.02 µm2/s, which is lower than the average Ras(C181) D measured by FCS. On membrane surfaces, Ras(C181) seems to exist as two distinct species, whereas the Ras(Y64A,C181) ensemble is homogeneous. In both cases, fast-moving species diffuse similarly to lipids.
Time-resolved fluorescence anisotropy (TRFA) is commonly used to detect changes in protein rotational diffusion associated with differences in viscous environment (43) and protein–protein interactions (44). TRFA was performed using linearly polarized pulsed-laser excitation and splitting single-photon counting channels by polarization (Fig. 2A and SI Materials and Methods). The anisotropy of labeled protein frequently decays with two exponential components that correspond to rotational diffusion of the fluorophore and whole protein (45, 46). Such two-exponential decay was observed for both Ras(C181) and the Y64A mutant on membranes (Fig. 2 and Fig. S2A). Fast components always exhibited decay times of 1 ns or less; measurements of Atto-488 nucleotide in solution show single-exponential anisotropy decay on this timescale (Fig. S2 B and C). We attribute the fast anisotropy decay component to the free rotational diffusion of Atto-488 relative to H-Ras. Rotational correlation times of the slow component (indicating protein rotation) were slower for Ras(C181) (12.7 ± 3.2 ns) than for Ras(Y64A,C181) (9.3 ± 0.6 ns) on membranes.
Fig. 2.

Rotational diffusion of H-Ras on membranes. (A) Schematic of time-resolved anisotropy. (B) Anisotropy decays of Ras(C181) and Ras(Y64A,C181) with two-exponential fits. Fast-component values for Ras(C181) and Ras(Y64A,C181) are 0.79 ± 0.33 ns and 0.76 ± 0.15 ns, respectively, and slow-component values are shown in the figure.
Translational and rotational mobilities of H-Ras are surface density-dependent. FCS measurements of the average lateral diffusion of H-Ras and H-Ras(Y64A) along with that of neighboring lipids were performed as a function of protein surface density. To maximize the precision of the measurement, data are plotted as a ratio of the translational correlation times, τtrans, for the protein and lipid as measured simultaneously at each spot (Fig. 3A). For all H-Ras constructs, Ras(C181), 6His-Ras(C181), and Ras(C181,C184), there is a clear transition in lateral mobility as the surface density increases. The ensemble averaged protein rotational correlation time, τrot, of H-Ras exhibits a similar increase with increasing surface density (Fig. 3B). Conversely, translational mobility of the Y64A mutants is constant across the entire range of surface densities, indicating that the mutants remain single diffusing species on the membrane.
Fig. 3.

Mobilities of H-Ras are surface density-dependent. (A) The averaged lateral diffusion of various H-Ras molecules on membrane surfaces measured by FCS. Each τtrans is divided by τtrans of TR lipid at the same location is plotted. (B) Protein rotational correlation time (τrot) of 6His-Ras(C181) measured by TRFA is plotted as a function of surface density.
Protein clustering, protein–membrane interactions, or a combination of both are reducing the mobility of H-Ras relative to lipids and the Y64A mutant. Mobility is sometimes used to assess protein clustering in membranes (37, 47). However, the scaling between mobility and degree of clustering is not well defined in the 2D membrane environment, as a result of the Stokes paradox (36, 39). A direct assessment of the clustering state of H-Ras can be made by molecular brightness analyses.
H-Ras Forms Stoichiometric Dimers on the Membrane Surface.
We determined the oligomeric state of H-Ras, quantitatively, by PCH spectroscopy and SMT microscopy. PCH reveals the relative stoichiometries of the fluorescent species present in a sample, as well as their overall densities, but does not measure the absolute number of molecules (fluorescent labels) in each type of oligomer. The absolute stoichiometry can be measured by SMT in total internal reflection fluorescence (TIRF) microscopy by analyzing stepped photobleaching in individually diffusing species. Fig. 4A illustrates representative SMT stepped photobleaching of Ras(C181). Monomers (∼90%) and dimers (∼10%) are observed, demonstrating that the smallest species is monomeric and that Ras(C181) can dimerize. Numbers of dimer observations in Ras(Y64A,C181) were negligible compared with Ras(C181) (Fig. 4B). Stepped photobleaching data confirm the existence of Ras(C181) dimers, but the distribution is skewed toward monomers by the prebleaching and higher-order oligomers cannot be ruled out.
Fig. 4.

H-Ras forms dimers on membrane surfaces. (A) Representative SMT showing stepped photobleaching of H-Ras. (B) The number of two-step photobleachings observed per ∼1,000 molecules analyzed. (C) A representative photon counting histogram [surface density: Ras(C181) = 160 molecules/μm2, Ras(Y64A,C181) = 164 molecules/μm2] with two-species model data fitting. The molecular brightness ratio B2/B1 of the two Ras(C181) species is close to 2 and the surface density of N1 and N2 are 129 molecules/μm2 and 16 molecules/μm2, respectively. Ras(Y64A,C181) shows only one species because B1∼B2. (D) Diffusion step-size histogram from SMT measurement on the same H-Ras sample as in C. Two-component model fitting shows the fraction of fast-diffusing species is 0.89. This corresponds to a 19.8% degree of dimerization assuming the slow-diffusing species are dimers.
PCH analysis can accurately quantify the degree of dimerization (48) (SI Discussion and Fig. S3). Fig. 4C illustrates PCH analysis of Ras(C181) and Ras(Y64A,C181) using a two-species model for samples with similar surface densities. For Ras(C181), the fitting result yields two distinct species that differ in brightness by a factor of 2 (B2 = 2B1); Ras(C181) forms a mixture of monomers and dimers. We do not see evidence for self-quenching or homo-FRET in the system (SI Discussion and Fig. S4). PCH analysis further provides the surface density of each species. This directly enables quantification of the degree of dimerization. In Fig. 4C, the surface densities of H-Ras monomer (N1) and dimer (N2) are 129 molecules/µm2 and 16 molecules/µm2, respectively, giving a degree of dimerization in this sample of 19.6%. For samples containing Ras(Y64A,C181), two-component PCH analysis always returns a single-species composition with B1 = B2; Ras(Y64A,C181) is purely monomeric in our experiments. As a control to assess the fidelity of this method, FCS and PCH of Ab cross-linked Ras(Y64A,C181) were performed, yielding reduced D and a 2:1 molecular brightness ratio, similar to Ras(C181) dimers (Fig. S5 and SI Discussion).
Fig. 4D shows the results of SMT analysis on the same sample as in Fig. 4C. The diffusion step-size histogram was fitted with a two-component model, assigning the relative weight of the fast-diffusing species α as described in Eq. S6. Assuming the fast-diffusing species is the monomer population and the slow population is dimeric, the degree of dimerization is 19.8%, which agrees well with PCH measurement.
Ras(C181) is strictly monomeric in solution. Elution profiles from analytical gel filtration chromatography show that Ras(C181) and Ras(Y64A,C181) are monomeric at both 50 µM and 500 µM (Fig. S6), and even 1.2 mM H-Ras did not reveal dimers in solution. These concentrations exceed the surface density equivalents corresponding to dimerization on supported membranes (maximal surface density: ∼1,000 H-Ras molecules/µm2; solution concentrations: ∼500 µM) (SI Discussion). These results confirm that dimerization requires Ras(C181) to be membrane-tethered and is not merely a result of local concentration.
The Equilibrium Dissociation Constant for H-Ras Dimerization on Membranes.
Analysis of the dimerization equilibrium of H-Ras exhibits a clear dependence on surface density. The ability of PCH analysis to resolve molecular brightness ( ) and surface density (
 ) for each species enables quantitative characterization of H-Ras dimerization equilibrium. The cluster size,
  , is found to be universally ∼2 for Ras throughout the titration range (Fig. 5, Upper). Because SMT analysis also quantifies the degree of dimerization, data points from both methods are collected together to determine the dissociation constant for various Ras constructs (Fig. 5, Lower).
Fig. 5.

Surface-density dependency of H-Ras dimerization. Quantification of degree of H-Ras dimerization by PCH and SMT analysis. The cluster size, measured as a ratio of molecular brightness of the two species in PCH analysis (B2/B1), is shown at the top and degree of dimerization as function of surface density is shown at the bottom. Data are fitted with Eq. 1 to obtain Kd.
Here, we let Xm and Xd represent the monomer and dimer surface densities, respectively, with the total H-Ras surface density given by 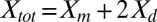 . The fraction of H-Ras in dimers (
 ) is plotted as a function of total H-Ras surface density in Fig. 5. A simple dimerization reaction,
  , can be used to obtain the 2D dissociation constant,
 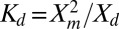 . In terms of
  ,
,  can be expressed as
 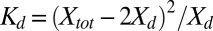 , which rearranges to,
  , with the solution
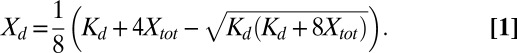 |
By fitting data points in Fig. 5 to Eq. 1, the dimer dissociation constant  for Ras(C181) is found to be 1,021 ± 105 molecules/µm2, and the
  for Ras(C181,C184), which has two lipid anchor points, is not significantly different at 805 ± 135 molecules/µm2. These results demonstrate the number of lipid anchor points has a negligible effect on the degree of dimerization, suggesting that H-Ras dimerization is insensitive to the fine details of HVR lipidation. H-Ras function in vivo is nucleotide-dependent. We observe a weak nucleotide dependency for H-Ras dimerization (Fig. S7).
It has been suggested that polar regions of switch III (comprising the β2--β3 loop and helix α5) and helix α4 on H-Ras interact with polar lipids, such as phosphatidylserine (PS), in the membrane (20). Such interaction may lead to stable lipid binding or even induce lipid phase separation. However, we observed that the degree of H-Ras dimerization is not affected by lipid composition. As shown in Fig. S8, the degree of dimerization of H-Ras on membranes containing 0% PS and 2% l-α-phosphatidylinositol-4,5-bisphosphate (PIP2) is very similar to that on membranes containing 2% PS. In addition, replacing egg l-α-phosphatidylcholine (PC) by 1,2-dioleoyl-sn-glycero-3-phosphocholine (DOPC) does not affect the degree of dimerization.
Ras proteins are frequently studied with various purification and epitope tags on the N terminus. The recombinant extension in the N terminus, either His-tags (49), large fluorescent proteins (20, 50, 51), or small oligopeptide tags for antibody staining (52), are generally considered to have little impact on biological functions (53–55). We find that a hexahistine tag on the N terminus of 6His-Ras(C181) slightly shifts the measured dimer  (to 344 ± 28 molecules/µm2) without changing the qualitative behavior of H-Ras dimerization (Fig. 5). In all cases, Y64A mutants remain monomeric across the range of surface densities.
There are three primary ways by which tethering proteins on membrane surfaces can increase dimerization affinities: (i) reduction in translational degrees of freedom, which amounts to a local concentration effect; (ii) orientation restriction on the membrane surface; or (iii) membrane-induced structural rearrangement of the protein, which could create a dimerization interface that does not exist in solution. The first and second of these are examined by calculating the differing translational and rotational entropy between solution and surface-bound protein (56) (SI Discussion and Fig. S9). Accounting for concentration effects alone (translation entropy), owing to localization on the membrane surface, we find corresponding values of  for H-Ras dimerization in solution to be ∼500 μM. This concentration is within the concentration that H-Ras is observed to be monomeric by analytical gel filtration chromatography. Membrane localization cannot account for the dimerization equilibrium we observe. Significant rotational constraints or structural rearrangement of the protein are necessary.
Discussion
The measured affinities for both Ras(C181) and Ras(C181,C184) constructs are relatively weak (∼1 × 10³ molecules/µm2). Reported average plasma membrane densities of H-Ras in vivo vary from tens (33) to over hundreds (34) of molecules per square micrometer. Additionally, H-Ras has been reported to be partially organized into dynamically exchanging nano-domains (≤20-nm diameter) (10, 35), with H-Ras densities above 4,000 molecules/µm2. Over this broad range of physiological densities, H-Ras is expected to exist as a mixture of monomers and dimers in living cells. Ras–membrane interactions are known to be important for nucleotide- and isoform-specific signaling (10). Monomer–dimer equilibrium is clearly a candidate to participate in these effects.
The observation here that mutation of tyrosine 64 to alanine abolishes dimer formation indicates that Y64 is either part of or allosterically coupled to the dimer interface. Y64 is located in the SII region, which undergoes large changes in structure and conformational dynamics upon nucleotide exchange. In a recent MM simulation of N-Ras, a dimer interface was predicted close to the C-terminal region at α5 and the loop between β2 and β3 (30), on the opposite side of Ras from SII. These predictions favor allosteric coupling as the mechanism of Y64 influence over dimerization. Long-distance conformational coupling between the Ras C terminus and canonical switch region has been modeled by MD simulations, revealing how side-chain interactions might transmit information across the protein along isoform-specific routes (21).
Membrane-induced conformational changes have been reported for both H- and N-Ras (15, 17), and membrane-specific conformations of the HVR in full-length H-Ras have been predicted by MD simulations (18). Our analysis of membrane surface dimerization energetics indicates that membrane localization alone is insufficient to drive dimerization; a different protein configuration or significant rotational constraints are required.
H-Ras is an allosteric enzyme. Apart from the HVR and membrane proximal C terminus, almost all surface exposed residues are involved in different effector binding interfaces (57). Y64 is an important residue for binding to SOS (41) and PI3K (58), and Y64 mutations to nonhydrophobic residues are dominant-negative with respect to v-H-Ras (G12V and A59T) oncogenicity (59). A key property of H-Ras is its structural flexibility, allowing it to engage a range of different effector proteins using different SII conformations (4). An important corollary is that allostery between the dimer interface and Y64/SII conformations could directly couple H-Ras dimerization to effector interactions.
Materials and Methods
Proteins, Fluorescent Nucleotides, and Antibodies.
H-Ras(C118S, 1–181) and H-Ras(C118S, 1–184) (SI Materials and Methods gives the sequence), H-Ras(Y64A, C118S, 1–181), and H-Ras(Y64A, C118S, 1–184) were purified as described previously (33) using an N-terminal 6-histidine affinity tag. Purified Ras was either used with the his-tag remaining on the N terminus (6His-Ras) or with the his-tag removed using a Tobacco Etch Virus protease cleavage site between the his-tag and the H-Ras sequence. The biochemical and structural properties of the H-Ras(C118S, 1–181) mutant have been characterized with in vitro functional assays and NMR spectroscopy and were found to be indistinguishable from WT H-Ras (60). The H-Ras(C118S, 1–181) mutant is customarily used for biochemical and biophysical studies (15, 33). Atto488-labeled GDP (EDA-GDP-Atto488) and Atto488-labeled GTP nonhydrolyzable analog (EDA-GppNp-Atto488) were purchased from Jena Bioscience. Anti–pan-Ras IgG was purchased from EMD Millipore.
FCS and PCH.
FCS measurements were performed on a home-built FCS apparatus integrated into a Nikon TE2000 inverted fluorescence microscope based on a previous design (61). Autocorrelation functions (ACFs) were calculated by a hardware correlator (www.correlator.com) in real time and Igor Pro software (WaveMetrics) was used for FCS analysis. All ACFs were fitted with a theoretical function describing single-species 2D free diffusion. In PCH measurements, the photon arrival times were recorded by a time-correlated single-photon counting (TCSPC) card (PicoQuant) and the histogram of recorded photon counts were later analyzed using the Globals software package developed at the Laboratory for Fluorescence Dynamics at the University of Illinois at Urbana–Champaign.
TRFA.
TRFA of Ras bilayers was measured with polarized pulsed-laser excitation in a Nikon Eclipse Ti inverted microscope with confocal optics. Fluorophore emission was recorded with TCSPC from two avalanche photodiodes separated by a polarizing beamsplitter.
Single-Molecule Imaging and Tracking.
TIRF experiments were performed on a Nikon Eclipse Ti inverted microscope with a 100× 1.49 N.A. oil immersion TIRF objective and an iXon EMCCD camera (Andor Technology); 561-nm (Crystalaser) and 488-nm (Coherent) diode lasers were used as illumination sources for TIRF imaging. A 60-s prephotobleaching using the strongest power setting of the 488-nm laser was performed to create a dark background before single-molecule imaging. Ten seconds after the prephotobleaching, a series of TIRF images were then acquired with an exposure time of 10 ms. Single-molecule data were quantified using a custom-written particle-tracking analysis suite developed in Igor Pro (Wavemetrics).
Supplementary Material
Acknowledgments
We thank Prof. John Kuriyan for helpful advice and generous access to his laboratory. We also thank Prof. A. Gorfe for providing molecular coordinates of the molecular dynamics simulation structures of H-Ras. This work was supported in part by Award U54 CA143836 from the National Cancer Institute. Additional support was provided by National Institutes of Health Grant P01 AI091580 (to L.I. and H.-L.T.). L.I. and S.M.C. were also supported, in part, by the Danish Council for Independent Research, Natural Sciences.
Footnotes
The authors declare no conflict of interest.
This article is a PNAS Direct Submission. M.K.R. is a guest editor invited by the Editorial Board.
This article contains supporting information online at www.pnas.org/lookup/suppl/doi:10.1073/pnas.1321155111/-/DCSupplemental.
References
- 1.Karnoub AE, Weinberg RA. Ras oncogenes: Split personalities. Nat Rev Mol Cell Biol. 2008;9(7):517–531. doi: 10.1038/nrm2438. [DOI] [PMC free article] [PubMed] [Google Scholar]
- 2.Ahearn IM, Haigis K, Bar-Sagi D, Philips MR. Regulating the regulator: Post-translational modification of RAS. Nat Rev Mol Cell Biol. 2012;13(1):39–51. doi: 10.1038/nrm3255. [DOI] [PMC free article] [PubMed] [Google Scholar]
- 3.Cox AD, Der CJ. Ras history: The saga continues. Small GTPases. 2010;1(1):2–27. doi: 10.4161/sgtp.1.1.12178. [DOI] [PMC free article] [PubMed] [Google Scholar]
- 4.Biou V, Cherfils J. Structural principles for the multispecificity of small GTP-binding proteins. Biochemistry. 2004;43(22):6833–6840. doi: 10.1021/bi049630u. [DOI] [PubMed] [Google Scholar]
- 5.Cherfils J, Zeghouf M. Chronicles of the GTPase switch. Nat Chem Biol. 2011;7(8):493–495. doi: 10.1038/nchembio.608. [DOI] [PubMed] [Google Scholar]
- 6.Mor A, Philips MR. Compartmentalized Ras/MAPK signaling. Annu Rev Immunol. 2006;24:771–800. doi: 10.1146/annurev.immunol.24.021605.090723. [DOI] [PubMed] [Google Scholar]
- 7.Arozarena I, Calvo F, Crespo P. Ras, an actor on many stages: Posttranslational modifications, localization, and site-specified events. Genes Cancer. 2011;2(3):182–194. doi: 10.1177/1947601911409213. [DOI] [PMC free article] [PubMed] [Google Scholar]
- 8.Rocks O, Peyker A, Bastiaens PIH. Spatio-temporal segregation of Ras signals: One ship, three anchors, many harbors. Curr Opin Cell Biol. 2006;18(4):351–357. doi: 10.1016/j.ceb.2006.06.007. [DOI] [PubMed] [Google Scholar]
- 9.Hancock JF. Ras proteins: Different signals from different locations. Nat Rev Mol Cell Biol. 2003;4(5):373–384. doi: 10.1038/nrm1105. [DOI] [PubMed] [Google Scholar]
- 10.Abankwa D, Gorfe AA, Hancock JF. Ras nanoclusters: Molecular structure and assembly. Semin Cell Dev Biol. 2007;18(5):599–607. doi: 10.1016/j.semcdb.2007.08.003. [DOI] [PMC free article] [PubMed] [Google Scholar]
- 11.Roy S, et al. Dominant-negative caveolin inhibits H-Ras function by disrupting cholesterol-rich plasma membrane domains. Nat Cell Biol. 1999;1(2):98–105. doi: 10.1038/10067. [DOI] [PubMed] [Google Scholar]
- 12.Roy S, et al. Individual palmitoyl residues serve distinct roles in H-ras trafficking, microlocalization, and signaling. Mol Cell Biol. 2005;25(15):6722–6733. doi: 10.1128/MCB.25.15.6722-6733.2005. [DOI] [PMC free article] [PubMed] [Google Scholar]
- 13.Rotblat B, et al. Three separable domains regulate GTP-dependent association of H-ras with the plasma membrane. Mol Cell Biol. 2004;24(15):6799–6810. doi: 10.1128/MCB.24.15.6799-6810.2004. [DOI] [PMC free article] [PubMed] [Google Scholar]
- 14.Prior IA, et al. GTP-dependent segregation of H-ras from lipid rafts is required for biological activity. Nat Cell Biol. 2001;3(4):368–375. doi: 10.1038/35070050. [DOI] [PubMed] [Google Scholar]
- 15.Thapar R, Williams JG, Campbell SL. NMR characterization of full-length farnesylated and non-farnesylated H-Ras and its implications for Raf activation. J Mol Biol. 2004;343(5):1391–1408. doi: 10.1016/j.jmb.2004.08.106. [DOI] [PubMed] [Google Scholar]
- 16.Meister A, et al. Insertion of lipidated Ras proteins into lipid monolayers studied by infrared reflection absorption spectroscopy (IRRAS) Biophys J. 2006;91(4):1388–1401. doi: 10.1529/biophysj.106.084624. [DOI] [PMC free article] [PubMed] [Google Scholar]
- 17.Kapoor S, et al. Revealing conformational substates of lipidated N-Ras protein by pressure modulation. Proc Natl Acad Sci USA. 2012;109(2):460–465. doi: 10.1073/pnas.1110553109. [DOI] [PMC free article] [PubMed] [Google Scholar]
- 18.Gorfe AA, Hanzal-Bayer M, Abankwa D, Hancock JF, McCammon JA. Structure and dynamics of the full-length lipid-modified H-Ras protein in a 1,2-dimyristoylglycero-3-phosphocholine bilayer. J Med Chem. 2007;50(4):674–684. doi: 10.1021/jm061053f. [DOI] [PubMed] [Google Scholar]
- 19.Abankwa D, et al. A novel switch region regulates H-ras membrane orientation and signal output. EMBO J. 2008;27(5):727–735. doi: 10.1038/emboj.2008.10. [DOI] [PMC free article] [PubMed] [Google Scholar]
- 20.Abankwa D, Gorfe AA, Inder K, Hancock JF. Ras membrane orientation and nanodomain localization generate isoform diversity. Proc Natl Acad Sci USA. 2010;107(3):1130–1135. doi: 10.1073/pnas.0903907107. [DOI] [PMC free article] [PubMed] [Google Scholar]
- 21.Gorfe AA, Grant BJ, McCammon JA. Mapping the nucleotide and isoform-dependent structural and dynamical features of Ras proteins. Structure. 2008;16(6):885–896. doi: 10.1016/j.str.2008.03.009. [DOI] [PMC free article] [PubMed] [Google Scholar]
- 22.Grant BJ, McCammon JA, Gorfe AA. Conformational selection in G-proteins: Lessons from Ras and Rho. Biophys J. 2010;99(11):L87–L89. doi: 10.1016/j.bpj.2010.10.020. [DOI] [PMC free article] [PubMed] [Google Scholar]
- 23.Wennerberg K, Rossman KL, Der CJ. The Ras superfamily at a glance. J Cell Sci. 2005;118(Pt 5):843–846. doi: 10.1242/jcs.01660. [DOI] [PubMed] [Google Scholar]
- 24.Zhang B, Zheng Y. Negative regulation of Rho family GTPases Cdc42 and Rac2 by homodimer formation. J Biol Chem. 1998;273(40):25728–25733. doi: 10.1074/jbc.273.40.25728. [DOI] [PubMed] [Google Scholar]
- 25.Zhang B, Gao Y, Moon SY, Zhang Y, Zheng Y. Oligomerization of Rac1 gtpase mediated by the carboxyl-terminal polybasic domain. J Biol Chem. 2001;276(12):8958–8967. doi: 10.1074/jbc.M008720200. [DOI] [PubMed] [Google Scholar]
- 26.Kang PJ, Béven L, Hariharan S, Park H-O. The Rsr1/Bud1 GTPase interacts with itself and the Cdc42 GTPase during bud-site selection and polarity establishment in budding yeast. Mol Biol Cell. 2010;21(17):3007–3016. doi: 10.1091/mbc.E10-03-0232. [DOI] [PMC free article] [PubMed] [Google Scholar]
- 27.Wittmann JG, Rudolph MG. Crystal structure of Rab9 complexed to GDP reveals a dimer with an active conformation of switch II. FEBS Lett. 2004;568(1-3):23–29. doi: 10.1016/j.febslet.2004.05.004. [DOI] [PubMed] [Google Scholar]
- 28.Beck R, et al. Membrane curvature induced by Arf1-GTP is essential for vesicle formation. Proc Natl Acad Sci USA. 2008;105(33):11731–11736. doi: 10.1073/pnas.0805182105. [DOI] [PMC free article] [PubMed] [Google Scholar]
- 29.Gasper R, Meyer S, Gotthardt K, Sirajuddin M, Wittinghofer A. It takes two to tango: Regulation of G proteins by dimerization. Nat Rev Mol Cell Biol. 2009;10(6):423–429. doi: 10.1038/nrm2689. [DOI] [PubMed] [Google Scholar]
- 30.Güldenhaupt J, et al. N-Ras forms dimers at POPC membranes. Biophys J. 2012;103(7):1585–1593. doi: 10.1016/j.bpj.2012.08.043. [DOI] [PMC free article] [PubMed] [Google Scholar]
- 31.Stokoe D, Macdonald SG, Cadwallader K, Symons M, Hancock JF. Activation of Raf as a result of recruitment to the plasma membrane. Science. 1994;264(5164):1463–1467. doi: 10.1126/science.7811320. [DOI] [PubMed] [Google Scholar]
- 32.Inouye K, Mizutani S, Koide H, Kaziro Y. Formation of the Ras dimer is essential for Raf-1 activation. J Biol Chem. 2000;275(6):3737–3740. doi: 10.1074/jbc.275.6.3737. [DOI] [PubMed] [Google Scholar]
- 33.Gureasko J, et al. Membrane-dependent signal integration by the Ras activator Son of sevenless. Nat Struct Mol Biol. 2008;15(5):452–461. doi: 10.1038/nsmb.1418. [DOI] [PMC free article] [PubMed] [Google Scholar]
- 34.Das J, et al. Digital signaling and hysteresis characterize ras activation in lymphoid cells. Cell. 2009;136(2):337–351. doi: 10.1016/j.cell.2008.11.051. [DOI] [PMC free article] [PubMed] [Google Scholar]
- 35.Prior IA, Muncke C, Parton RG, Hancock JF. Direct visualization of Ras proteins in spatially distinct cell surface microdomains. J Cell Biol. 2003;160(2):165–170. doi: 10.1083/jcb.200209091. [DOI] [PMC free article] [PubMed] [Google Scholar]
- 36.Saffman PG, Delbrück M. Brownian motion in biological membranes. Proc Natl Acad Sci USA. 1975;72(8):3111–3113. doi: 10.1073/pnas.72.8.3111. [DOI] [PMC free article] [PubMed] [Google Scholar]
- 37.Chung I, et al. Spatial control of EGF receptor activation by reversible dimerization on living cells. Nature. 2010;464(7289):783–787. doi: 10.1038/nature08827. [DOI] [PubMed] [Google Scholar]
- 38.Knight JD, Lerner MG, Marcano-Velázquez JG, Pastor RW, Falke JJ. Single molecule diffusion of membrane-bound proteins: Window into lipid contacts and bilayer dynamics. Biophys J. 2010;99(9):2879–2887. doi: 10.1016/j.bpj.2010.08.046. [DOI] [PMC free article] [PubMed] [Google Scholar]
- 39.Kaizuka Y, Groves JT. Structure and dynamics of supported intermembrane junctions. Biophys J. 2004;86(2):905–912. doi: 10.1016/S0006-3495(04)74166-1. [DOI] [PMC free article] [PubMed] [Google Scholar]
- 40.Goodwin JS, Drake KR, Remmert CL, Kenworthy AK. Ras diffusion is sensitive to plasma membrane viscosity. Biophys J. 2005;89(2):1398–1410. doi: 10.1529/biophysj.104.055640. [DOI] [PMC free article] [PubMed] [Google Scholar]
- 41.Hall BE, Yang SS, Boriack-Sjodin PA, Kuriyan J, Bar-Sagi D. Structure-based mutagenesis reveals distinct functions for Ras switch 1 and switch 2 in Sos-catalyzed guanine nucleotide exchange. J Biol Chem. 2001;276(29):27629–27637. doi: 10.1074/jbc.M101727200. [DOI] [PubMed] [Google Scholar]
- 42.Moertelmaier M, Brameshuber M, Linimeier M, Schutz GJ, Stockinger H. Thinning out clusters while conserving stoichiometry of labeling. Appl Phys Lett. 2005;87(26):263903. [Google Scholar]
- 43.Suhling K, Davis DM, Phillips D. The influence of solvent viscosity on the fluorescence decay and time-resolved anisotropy of green fluorescent protein. J Fluoresc. 2002;12(1):91–95. [Google Scholar]
- 44.Hink MA, et al. Structural dynamics of green fluorescent protein alone and fused with a single chain Fv protein. J Biol Chem. 2000;275(23):17556–17560. doi: 10.1074/jbc.M001348200. [DOI] [PubMed] [Google Scholar]
- 45.Spille J-H, Zürn A, Hoffmann C, Lohse MJ, Harms GS. Rotational diffusion of the α(2a) adrenergic receptor revealed by FlAsH labeling in living cells. Biophys J. 2011;100(4):1139–1148. doi: 10.1016/j.bpj.2010.08.080. [DOI] [PMC free article] [PubMed] [Google Scholar]
- 46.Alexiev U, Rimke I, Pöhlmann T. Elucidation of the nature of the conformational changes of the EF-interhelical loop in bacteriorhodopsin and of the helix VIII on the cytoplasmic surface of bovine rhodopsin: A time-resolved fluorescence depolarization study. J Mol Biol. 2003;328(3):705–719. doi: 10.1016/s0022-2836(03)00326-7. [DOI] [PubMed] [Google Scholar]
- 47.Naji A, Levine AJ, Pincus PA. Corrections to the Saffman-Delbruck mobility for membrane bound proteins. Biophys J. 2007;93(11):L49–L51. doi: 10.1529/biophysj.107.119222. [DOI] [PMC free article] [PubMed] [Google Scholar]
- 48.Müller JD, Chen Y, Gratton E. Resolving heterogeneity on the single molecular level with the photon-counting histogram. Biophys J. 2000;78(1):474–486. doi: 10.1016/S0006-3495(00)76610-0. [DOI] [PMC free article] [PubMed] [Google Scholar]
- 49.Burgoyne JR, et al. Oxidation of HRas cysteine thiols by metabolic stress prevents palmitoylation in vivo and contributes to endothelial cell apoptosis. FASEB J. 2012;26(2):832–841. doi: 10.1096/fj.11-189415. [DOI] [PMC free article] [PubMed] [Google Scholar]
- 50.Murakoshi H, et al. Single-molecule imaging analysis of Ras activation in living cells. Proc Natl Acad Sci USA. 2004;101(19):7317–7322. doi: 10.1073/pnas.0401354101. [DOI] [PMC free article] [PubMed] [Google Scholar]
- 51.Plowman SJ, Muncke C, Parton RG, Hancock JF. H-ras, K-ras, and inner plasma membrane raft proteins operate in nanoclusters with differential dependence on the actin cytoskeleton. Proc Natl Acad Sci USA. 2005;102(43):15500–15505. doi: 10.1073/pnas.0504114102. [DOI] [PMC free article] [PubMed] [Google Scholar]
- 52.Yang MH, et al. Regulation of RAS oncogenicity by acetylation. Proc Natl Acad Sci USA. 2012;109(27):10843–10848. doi: 10.1073/pnas.1201487109. [DOI] [PMC free article] [PubMed] [Google Scholar]
- 53.Yang P, Qyang Y, Bartholomeusz G, Zhou X, Marcus S. The novel Rho GTPase-activating protein family protein, Rga8, provides a potential link between Cdc42/p21-activated kinase and Rho signaling pathways in the fission yeast, Schizosaccharomyces pombe. J Biol Chem. 2003;278(49):48821–48830. doi: 10.1074/jbc.M306819200. [DOI] [PubMed] [Google Scholar]
- 54.Shima F, et al. Structural basis for conformational dynamics of GTP-bound Ras protein. J Biol Chem. 2010;285(29):22696–22705. doi: 10.1074/jbc.M110.125161. [DOI] [PMC free article] [PubMed] [Google Scholar]
- 55.Balana B, et al. Ras-association domain of sorting Nexin 27 is critical for regulating expression of GIRK potassium channels. PLoS ONE. 2013;8(3):e59800. doi: 10.1371/journal.pone.0059800. [DOI] [PMC free article] [PubMed] [Google Scholar]
- 56.Wu Y, Vendome J, Shapiro L, Ben-Shaul A, Honig B. Transforming binding affinities from three dimensions to two with application to cadherin clustering. Nature. 2011;475(7357):510–513. doi: 10.1038/nature10183. [DOI] [PMC free article] [PubMed] [Google Scholar]
- 57.Corbett KD, Alber T. The many faces of Ras: Recognition of small GTP-binding proteins. Trends Biochem Sci. 2001;26(12):710–716. doi: 10.1016/s0968-0004(01)01974-0. [DOI] [PubMed] [Google Scholar]
- 58.Pacold ME, et al. Crystal structure and functional analysis of Ras binding to its effector phosphoinositide 3-kinase γ. Cell. 2000;103(6):931–943. doi: 10.1016/s0092-8674(00)00196-3. [DOI] [PubMed] [Google Scholar]
- 59.Nur-E-Kamal MS, Sizeland A, D’Abaco G, Maruta H. Asparagine 26, glutamic acid 31, valine 45, and tyrosine 64 of Ras proteins are required for their oncogenicity. J Biol Chem. 1992;267(3):1415–1418. [PubMed] [Google Scholar]
- 60.Mott HR, Carpenter JW, Campbell SL. Structural and functional analysis of a mutant Ras protein that is insensitive to nitric oxide activation. Biochemistry. 1997;36(12):3640–3644. doi: 10.1021/bi962790o. [DOI] [PubMed] [Google Scholar]
- 61.Triffo SB, Huang HH, Smith AW, Chou ET, Groves JT. Monitoring lipid anchor organization in cell membranes by PIE-FCCS. J Am Chem Soc. 2012;134(26):10833–10842. doi: 10.1021/ja300374c. [DOI] [PMC free article] [PubMed] [Google Scholar]
Associated Data
This section collects any data citations, data availability statements, or supplementary materials included in this article.