Abstract
Purpose
We investigated the use of a simple calibration method to remove bias in previously proposed approaches to image-derived input functions (IDIFs) when used to calculate the metabolic uptake rate of glucose (Km) from dynamic [18F]-FDG PET scans of the thigh. Our objective was to obtain nonbiased, low-variance Km values without blood sampling.
Materials and methods
We evaluated eight previously proposed IDIF methods. Km values derived from these IDIFs were compared with Km values calculated from the arterial blood samples (gold standard). We used linear regression to extract calibration parameters to remove bias. Following calibration, cross-validation and bootstrapping were used to estimate the mean square error and variance.
Results
Three of the previously proposed methods failed mainly because of zero-crossings of the IDIF. The remaining five methods were improved by calibration, yielding unbiased Km values. The method with the lowest SD yielded an SD of 0.0017/min – that is, below 10% of the muscle Km value in this study.
Conclusion
Previously proposed IDIF methods can be improved by using a simple calibration procedure. The calibration procedure may be used in other studies, thus obviating the need for arterial blood sampling, once the calibration parameters have been established in a subgroup of participants. The method has potential for use in other parts of the body as it is robust with regard to partial volume effects.
Keywords: calibration, image-derived input function, kinetic analysis, positron emission tomography
Introduction
Positron emission tomography (PET) can be used to quantify physiological processes in vivo by using different tracers. As such, the glucose analog 2-deoxy-2-[18F]fluoro-d-glucose (FDG) can be used to determine the metabolic uptake rate (Km) of glucose in specific tissues. This requires a known input function (IF) – that is, the concentration of tracer in the arterial plasma 1. A standard approach to obtaining the IF is arterial cannulation, a laborious and often challenging procedure for the staff and the patient.
An alternative to arterial cannulation is the use of an image-derived input function (IDIF). This requires the segmentation of a blood vessel or blood pool in a series of dynamic emission images. Taking advantage of the quantitative nature of PET, the IF can be derived in the form of a time–activity curve (TAC). This assumes that the concentration difference between arterial blood and plasma is small, as is the case for 18F-FDG 1. A major problem with this approach is the limited spatial resolution of clinical PET systems, giving rise to significant partial volume effects that may affect the blood signal. Partial volume effects can be separated into spill-in effects from surrounding tissue and low recovery if the blood vessel is small. Both effects can introduce bias when determining the Km. Several research groups have focused on IDIFs, mainly related to the brain and using the carotid arteries 2,3. Other organs investigated for use with IDIFs have been the heart and aorta, with a few research groups using the femoral artery 3–5. However, none of the studies using the femoral artery used 18F-FDG. Prior studies have shown that IDIFs need to be validated for a specific tracer and to a somewhat lesser degree for the specific PET system 6,7.
The primary aim of our study was to evaluate a number of previously published IDIF methods 2,3,8–14 when applied to the femoral artery using 18F-FDG PET data. This was achieved by comparing the methods using the area under the curve (AUC) ratio measure and the mean squared error (MSE) of the Km values. The second aim was to investigate the effect of a calibration by linear transformation of the proposed methods. We sought to remove bias and improve accuracy to potentially obviate the need for invasive blood sampling.
Materials and methods
Study population
The data presented here are part of a larger study on metabolic and cultural health in moderately overweight men [Project Four-IN-onE (FINE); http://fine.ku.dk]. The study was performed according to the Helsinki II declaration and approved by the regional Ethical Committee for Copenhagen (H-4-2009-089); written informed consent was obtained from all participants.
Thirteen individuals from the FINE population were included in this study. Eight individuals were examined twice, 11 weeks apart, whereas one individual was examined only before intervention, and four individuals were examined only after intervention. Depending on the group the intervention was either 30 or 60 min of moderately intense physical activity per day, or continued sedentary lifestyle. Age at the time of examination was 30±1.6 years (mean±SD), BMI was 27.8±0.4 kg/m2, with a fat % as measured by DEXA-scan of 30.4±1.2%. VO2max was 36.1±1.1 ml O2/min/kg. The participants were male, healthy as judged on interviews, were not taking any medication, and had a fasting plasma glucose level lower than 6.1 mmol/l.
Study design
Before the day of the test, the participants were instructed to fast overnight for 12 h and to abstain from any strenuous physical activity for 36 h. On the day of the test, all participants underwent a hyperinsulinemic isoglycemic clamp with an insulin infusion rate of 40 mU/m2/min 15. Two biopsies were obtained from the lateral vastus muscle, right before the start of the clamp and after 120 min of clamping.
Catheters were inserted in both cubital veins, one for the infusion of glucose and insulin and one for the injection of 18F-FDG. Furthermore, catheters were inserted in a dorsal vein on the nondominant hand for obtaining arterialized venous blood using a heating blanket (OBH Nordica, Taastrup, Denmark) and in the radial artery of the same hand for arterial blood sampling. During hyperinsulinemia, normoglycemia was maintained using a variable rate of infusion of 20% glucose. The average duration of the clamp before injection of 18F-FDG was 4 h 23 min. The clamp was maintained throughout the PET study.
Participants were placed supine on the bed of the PET system. The thighs were positioned in the axial field of view (FOV) excluding the gonads. To minimize participant movement, they were placed in a comfortable position with a large vacuum pillow placed around their legs. Mean injected activity was 206 MBq. Arterial blood measurements was taken with the Allogg automatic blood counter (Allogg Technology, Mariefred, Sweden) for the first 3 min at a withdrawal rate of 6 ml/min, followed by manual blood sampling at 3, 4, 5, 6, 8, 10, 15, 20, 30, 40, 60, 80, 100, 120 min. Arterialized venous blood samples were drawn at 5, 10, 20, 30, 40, 50, 60, 70, 80, 90, 100, 110, 120 min for blood glucose determination (Precision PCx; Abbott, Alameda, California, USA).
PET acquisition and data processing
Participants were studied on the PET/CT systems Biograph 40 and 64 True Point (Siemens Healthcare, Erlangen, Germany). PET/computed tomography (CT) imaging protocols included an ultralow-dose CT acquisition (120 kVp, 11 mAs) for the purpose of attenuation correction 16 and anatomical localization of the fat and muscle, followed by a dynamic PET emission acquisition in list mode over a period of 60 min and subsequently histogrammed into 26 time frames (12×10 s, 4×120 s, 10×300 s). PET images were reconstructed using the ordered subset expectation maximization together with a point spread function-correcting method TrueX (Siemens Healthcare), with eight iterations, 21 subsets, 336×336 pixels, and with and without 4 mm Gaussian smoothing. The 4 mm smoothing was used for all IDIF methods except in the method of Mourik et al. 2,10, in which no smoothing was used after the arteries were located on the smoothed scan in order to minimize partial volume effects. All PET images were corrected for attenuation and scatter, and decay corrected to scan start. For postprocessing we divided the PET FOV into five areas of coverage along the axial plane. Only the second and third part from the proximal end was used in order to avoid the noisier low statistic parts of the FOV. All image and data processing was performed using MATLAB (The MathWorks Inc., Natick, Massachusetts, USA) with an in-house-developed code, except for the kinetic analysis, which was performed in PMOD (PMOD Technologies Ltd, Zurich, Switzerland).
Image-derived input function methods
A brief introduction to the eight tested IDIF methods is given here. An overview can be found in Table 1.
Table 1.
The previously proposed image-derived input function methods and a short recap of how they work
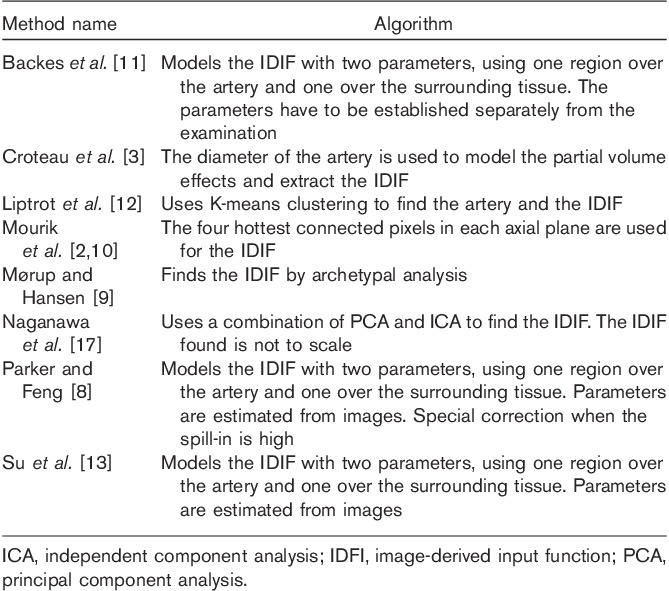
Backes et al. 11
Backes et al. 11 determined the whole-blood concentration Cwb(t) from the activity measured over a large vascular region of interest (ROI) Cvas(t) by applying the following relation:
 |
where av is the partial volume correction for low recovery and k is the rate at which tracer enters the surrounding tissue. Both are determined empirically – for example, by comparison with arterial blood sampling or with an in-vitro proliferation marker. The relation assumes that the concentration in the tissue and thus the spill-in does not exceed the true concentration of Cvas(t).
As this assumption is not fulfilled when using the tracer 18F-FDG, we modified Eq. (1) by a phenomenological relation to
 |
where ‘end’ denotes the mean of the two last frames, at which the ratio between the surrounding tissue and the vascular component is the largest. The reason for taking the mean of the last two frames was to obtain a more robust estimate. The parameters av and k were determined by fitting Eq. (2) to the arterial blood concentration across all participants.
As suggested by Su et al. 13 the ROI was defined by transforming and normalizing the blood component found by archetypal analysis 9 according to
 |
where X denotes the original values, μ is the mean of these values, and σ is the SD of X. A threshold of 20σ was used to obtain an ROI larger than the spatial resolution of the PET system but without single voxel outliers – that is, including all voxels within 20σ of the new mean, zero.
Croteau et al. 3
Croteau et al. 3 used the diameter of the artery to empirically correct for spill-in and low recovery. The diameter is either measured on a CT image or estimated as the full-width at half-maximum (FWHM) of the artery in a reconstructed PET image. As the artery could not be identified in the low-dose noncontrast CT scan, we used the FWHM for the artery found by summation of the first 60 s of the PET images. To obtain a more robust measure, the FWHM was measured in two orthogonal directions. To estimate the recovery coefficient (RC) and spill-in coefficient (SP), a ROI was identified as the hottest pixel per plane in the same frames as the FWHM. This ROI was then morphologically dilated five times and the difference between a three-fold and a five-fold dilation was used for the spill-in/tissue ROI. The TACs from these two ROIs were then fitted to the arterial blood samples in order to yield a value for SP and RC using the formula from Chen et al. 18.
In the formula described by Chen et al. 18, a ROI is placed manually over the artery. Assuming a linear relation between SP and RC, the value of the TAC from the artery is corrected for partial volume effects from the surrounding tissue using the following relation:
where Cmea denotes the measured values from the artery ROI, Cart is the true concentration in the artery, and Ctis is the true concentration in the surrounding tissue.
Liptrot et al. 12
Liptrot et al. 12 used K-means clustering 14 to extract an IDIF. For each individual a K-means cluster analysis is performed with an increasing number of clusters until a vascular component can be identified. This component is then clustered in one through 10 clusters and the final number of clusters is identified with a within variance measure. The final cluster used for the TAC is chosen by visual examination of its placement and relation to anatomical structures. Instead of the suggested weighting reflecting the number of counts in each frame, we used equal weighting of all frames. This approach was chosen, as the vasculature was clearly segmented without the weighting.
Mourik et al. 2,10
Mourik et al. 2,10 used a summation of the early time frames (15–60 s and 15–75 s) in a dynamic scan of the brain. The carotids could then be identified and an IDIF extracted by finding the four hottest connected pixels per plane in a smoothed reconstruction and projecting these voxels into a reconstruction using a point spread function-correcting algorithm without smoothing.
Mørup and Hansen 9
Mørup and Hansen 9 suggested using archetypal analysis to extract an IDIF. The data points are assumed to be linear combinations of a number of archetypical data points. These archetypical points are estimated as the most extreme points on the convex hull of the data. On the basis of visual inspection, we chose three archetypes (Fig. 1).
Fig. 1.

Archetypal analysis component maps constructed by the method of Mørup and Hansen 9. (a) The vascular component where the arteries are clearly visible. (b) The high uptake component, mainly the musculature. The white arrows mark the dark spots where the arteries are. (c) The low uptake component, mainly the fat and the bone marrow.
Naganawa et al. 17
Naganawa et al. 17 suggested the EPICA algorithm, which uses a combination of Principal Component Analysis and Independent Component Analysis (ICA) to extract the two main components of the dynamic PET scan: a tissue curve and a blood curve. The curves are not to scale and thus need a blood sample or a substitute to bring it to the correct scale.
Parker and Feng 8
Parker and Feng 8 also used the formula described by Chen et al. 18. In the method by Parker and Feng the arterial activity is estimated by using the mean of the 5% hottest pixels in the carotids, Imax. If the surrounding tissue activity exceeds the estimated arterial activity, then Imax is corrected to Imax×Imean/Tmean, where Imean and Tmean are the mean values of the carotids and surrounding tissue, respectively. For the segmentation of the artery, we used a normalization as described previously 13 (see Backes et al. 11 section) of the ICA blood component with a threshold of 9σ.
Su et al. 13
Su et al. 13 also used the method described by Chen et al. 18.
However, instead of arterial or late venous samples, the carotids are identified and segmented using ICA, and the local framewise maximal activity, Cmax, over the first 30 min is used for Cart solving the system for RC and SP. These values are then used in the relation
where Cest is the estimated IDIF. As suggested by Su et al. 13 we used a normalization (see Backes et al. 11 section) of the ICA blood component with a threshold of 9σ.
Comparison of methods
The merit of the IDIF methods described briefly above was compared using two measures: first, using the AUC – that is, the integral of the arterial IF divided by the integral of the IDIF – and, second, using the values of the metabolic uptake rates Km as calculated by two-tissue compartment kinetic analysis for each participant and tissue.
Kinetic analysis requires an IF (as derived by one of the IDIF methods above) and a tissue TAC. The latter was defined by automatically segmenting fat, muscle, and bone marrow by a seed-initialized region growing algorithm in each leg and by manually drawing five regions on each leg for the following muscles: vastus medialis, vastus lateralis, the hamstring muscle group, the adductor muscle group, and the gracilis muscle (Fig. 2). This yielded 15 regions per scanning per person, as the fat was segmented for both legs simultaneously.
Fig. 2.
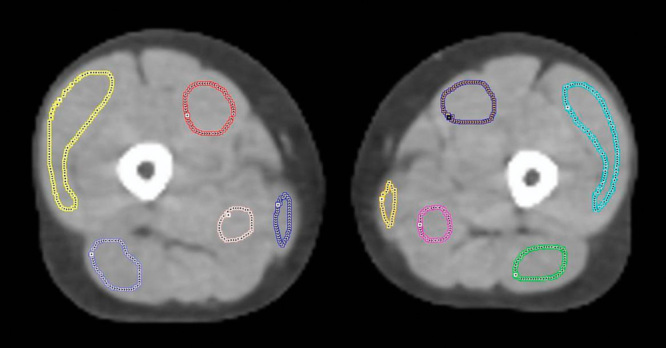
Manually defined regions in each thigh on the ultralow-dose computed tomography. Regions in the left leg: vastus medialis, purple; vastus lateralis, light blue; the hamstring muscle group, green; the adductor muscle group, pink; the gracilis muscle, yellow.
The Km values calculated on the basis of the IDIF were then plotted against the Km values calculated using the arterial blood samples. A linear regression was performed and the parameters were used to compare and calibrate the different IDIF methods. Ideally, the regression should yield the identity line, as the Km values from the arterial and the IDIF should be identical. However, when this is not the case, the slope and intercept of the regression line can be used to bring the Km values from the IDIF close to the identity line by subtracting the intercept and dividing with the slope. Furthermore, the MSE was calculated.
To determine which model gives the most accurate prediction of Km after calibration, a cross-validation (CV) and a .632 bootstrap estimation 19 were performed to calculate the MSE for all methods. The general idea in the CV method is that one or more data points are removed, and the regression function fitted to the remaining data to test how accurately the function predicts the removed data points. We removed one participant at a time. If the participant was scanned twice, both the preintervention and the postintervention data were removed at the same time.
The .632 bootstrap estimation is an approach in which new test sets are created by sampling of the data with replacement.
where err is the training error and Err(1) is the leave-one-out bootstrap estimate given by
 |
where C−i is the set of indices of the bootstrap data points b that do not contain observation i. |C−i| is the number of such data points and f*b is the fitted function calculated on C−i – that is, without data point i 19.
As linear regression is an unbiased estimator, we can determine the variance and thus the SD from the estimated MSE. This follows from the relation:
 |
where  is an estimator and θ is an estimated parameter.
The preferred method was then analyzed with an analysis of covariance to test for correlation between regression slope and pre/postintervention effect on the participants.
Results
Three of the IDIF methods were discarded from the final analysis: the methods of Croteau et al. 3, Naganawa et al. 17, and Su et al. 13.
In the method of Croteau et al. 3 the artery could not be identified on the CT image. The diameter was estimated instead by the FWHM of the artery on a sum of the first 60-s PET frames. The FWHM was then plotted against the RC and SP values in search of a potential relation. As seen in Fig. 3, no discernible relation between the arterial diameter as estimated by FWHM and the RC and SP was found. Therefore, the method was omitted from further analysis.
Fig. 3.
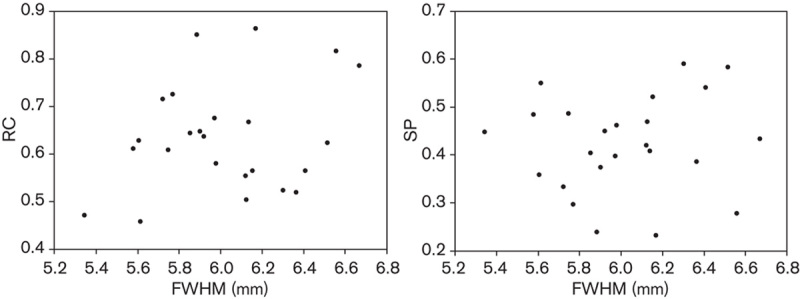
The method of Croteau et al. 3. Recovery coefficient (RC) and spill-in coeffcient (SP) plotted against the full-width at half-maximum (FWHM) of the artery calculated from the PET images.
In the method of Naganawa et al. 17 all IFs had zero-crossings, (Fig. 4). The method was, therefore, omitted from further analysis.
Fig. 4.
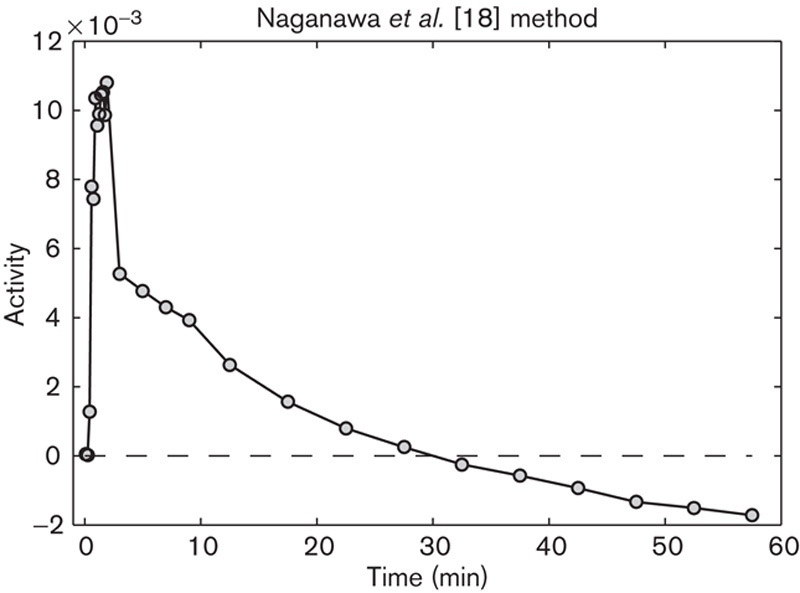
Image-derived input function (IDIF) from the EPICA method by Naganawa et al. 15. The tail of the IDIF crosses the time axis and is negative for t>30 min.
The method by Su et al. 13 yielded several IFs with negative values and was thus omitted from further analysis.
For the remaining five methods the IDIF-based and arterial Km values were plotted as described. An example for the method by Parker and Feng 8 can be seen in Fig. 5. The results are presented in Tables 2 and 3.
Fig. 5.
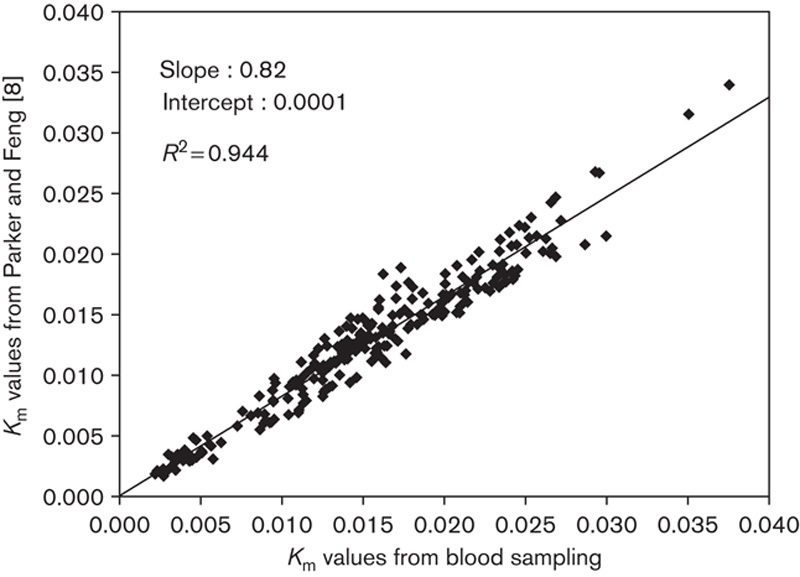
Parker and Feng 8 image-derived input function Km values compared with arterial input function Km values.
Table 2.
Regression results for the various methods

Table 3.
Percentage error of the methods before and after calibration
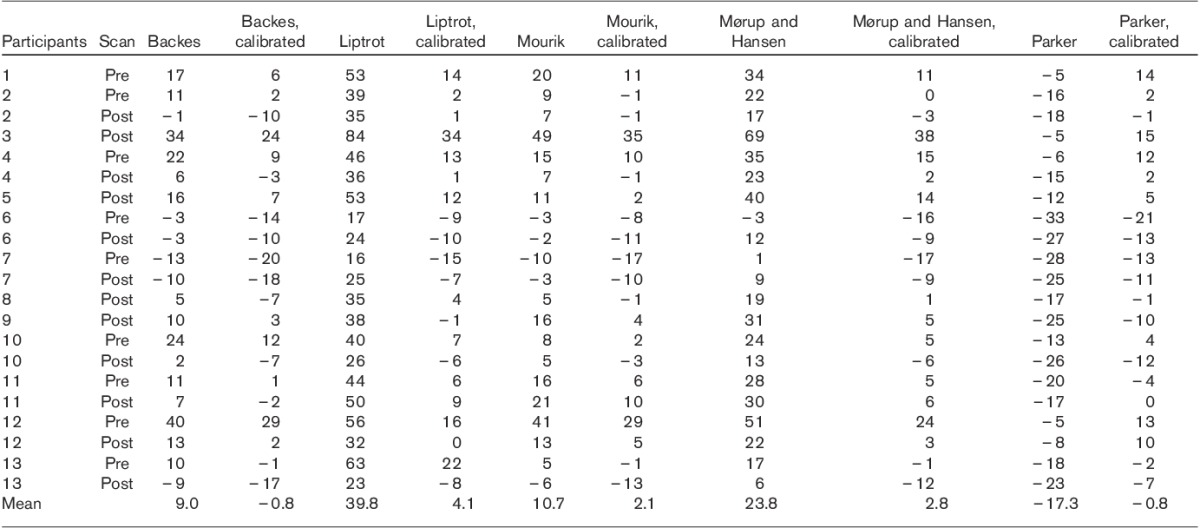
The methods of Backes et al. 11, Mourik et al. 2,10, and Parker and Feng 8 estimate the peak well according to the AUC 2.5 min values (Table 2), whereas the methods of Liptrot et al. 12 and Mørup and Hansen 9 underestimate it. All methods estimate the tail well (AUC 60 min in Table 2), except that of Parker and Feng 8, which yields an overestimation. An example of Parker and Feng’s method can be seen in Fig. 6.
Fig. 6.
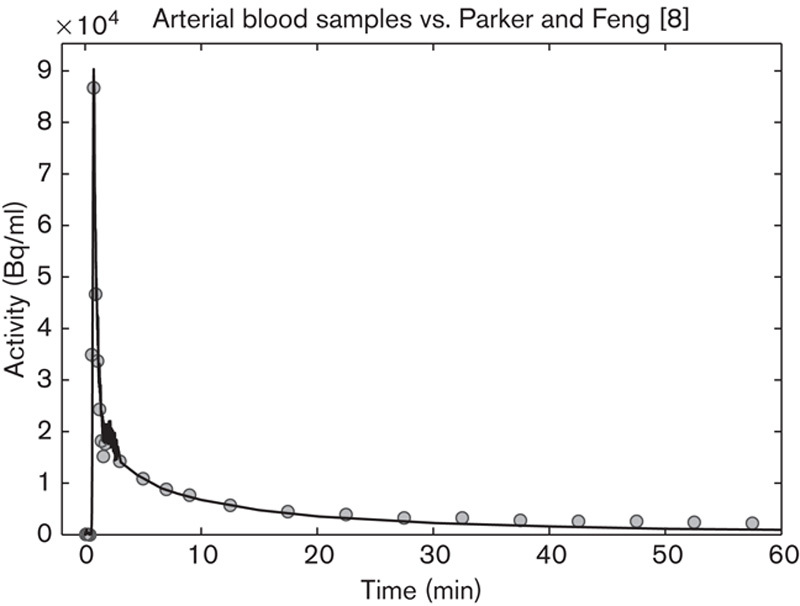
Image-derived input function (IDIF) using the Parker and Feng 8 method (circles) compared with the arterial blood samples (fully marked line). The IDIF matches the peak well and overestimates the tail.
The SD of the different methods after calibration are listed in Table 4.
Table 4.
SD (min−1) of the different methods, as estimated by cross-validation estimation and .632 estimation

The method with the lowest estimated SD (0.0017/min) was the method of Parker and Feng 8. Therefore, this method was examined further using an analysis of covariance. The regression slope appeared slightly different before and after intervention; however, the difference was found to be nonsignificant with a P-value of 0.31.
Discussion
In this study we have examined a number of previously proposed methods for deriving (arterial) IFs. Our data show a linear correlation of the estimated Km values and the true Km values when applying a full kinetic analysis to the tissue data. We have demonstrated that a simple calibration can be used to obtain nonbiased results with an SD for the best method (Parker and Feng 8) that is below 10% of the uptake rate in muscle in this study.
Although the Patlak analysis 21,22 instead of the full kinetic analysis is robust with respect to the size of the peak and the general shape of the input curve 18, it depends on a monotonically decreasing IF and it cannot account for dephosphorylation, normally denoted as k4. Building on earlier studies, graphical methods such as Patlak have been recommended in combination with the use of IDIFs, as they are less vulnerable to a poor estimation of the peak and the initial shape of the curve 6,23. However, as a significant k4 component was seen for the fat and bone marrow in this study, full kinetic analysis was found to be appropriate. Nonetheless, both the Patlak approach and the full kinetic analysis assume that both the glucose level and the uptake rate Km remain constant throughout the examination. This is well supported in the present study because of the isoglycemic clamp, which was initiated on average 4 h and 23 min before the scan and maintained throughout the entire examination.
In general, IDIFs are susceptible to several errors. A method is typically validated for one tracer, using a specific scanner with specific reconstruction settings and tested on a small population. In reality, these and other factors contribute to the uncertainty in IDIFs. Different scanners have different resolutions and different scatter contributions and correction. Different tracers have different biodistributions, leading to different partial volume effects, and may make IDIF extraction difficult. Subject variance is also a factor. Even though the variance of, for example, a. femoralis or a. carotis diameter is relatively small, Croteau et al. 3 showed that a wrong estimation of 1 mm may lead to errors of up to 60% when calculating Km. Further, these factors may combine in ways that are not obvious, which make predictions difficult when applied to new situations. This should be kept in mind with respect to all the methods tested here.
We discarded three of the IDIF methods for different reasons. Using the method of Croteau et al. 3 we were unable to establish a relation between the FWHM of the arteries measured on PET and the SP and RC factors as needed for this method. As the artery is small compared with the reconstructed voxel size, the FWHM becomes prone to noise. However, using a diagnostic contrast CT or with the advent of integrated PET/MRI systems whereby the artery can be measured directly, the method could prove very useful. The EPICA algorithm proposed by Naganawa et al. 17 had zero-crossings of the estimated IDIF. This problem might be solved by the EPEL algorithm proposed by the same author 24. The method proposed by Su et al. 13 was seen to overestimate the SP, which leads to zero-crossings in several cases. This indicates that the use of the local framewise maximum as a substitute for the true arterial activity is not a reliable measure in this setting.
Without transformation, the method of Backes et al. 11 is the one with the lowest MSE, and according to the AUC values in Table 2 it estimates the shape of the curve well. Both Backes and our modified version have two parameters (av and k) (Eqs 1 and 2), which need to be established by fitting to known data – in our case, the arterial blood samples. In effect the method has already been calibrated by av and k, as they are both directly derived by fitting to the arterial blood samples, which explains the small improvement by another calibration.
The method of Liptrot et al. 12 likely performs poorly because of the possible errors mentioned. In particular it was validated for [18F]-altanserin, a tracer with a biodistribution that is different from that of 18F-FDG.
In line with earlier results for the method of Mourik et al. 10,20, a calibration with blood samples may be necessary for this method when applied to other PET systems and reconstructions and with other tracers than [11C]flumazenil.
The relatively poor performance of the method of Mørup and Hansen 9 is likely due to underestimation of the peak as seen by the AUC 2.5 in Table 2. An open question, not further addressed in this study, is how to choose the optimal number of archetypes, similar to the problems in ICA and various clustering algorithms.
Parker and Feng 8 capture the input curve peak well, but overcorrect for spill-in for the tail as shown by the AUC in Table 2. In addition to the previously mentioned possible errors, the partial volume correction is only approximate and likely does not account for all effects.
As can be seen by the slopes in Table 2, only the modified method of Backes et al. 11 estimates Km reliably. However, after the linear transformation all methods are close to each other, demonstrating the efficacy of a calibration, Table 3. As can be seen in Table 4 the SDs for the different methods are very similar, with the method of Parker and Feng 8 having the lowest SD. Given that the .632 bootstrap and CV estimations have nearly identical values for all methods, the results are well supported.
The use of this method for other PET systems of comparable spatial resolution is well supported, given that a system and reconstruction specific fitting is performed. Earlier studies show a correlation between femoral arterial diameter and height, weight, and sex 25,26. Although the diameter of female patients is smaller on average, the variance in both sexes is large. As this study includes individuals of different height, weight, and age, while still showing a high R2 value when fitted to a linear model, the use of this method in a more heterogenous group would appear promising.
This points towards a general use of our calibration technique. In a given study setting, a number of (representative) participants can be used to calibrate an IDIF method by having arterial blood samples taken. If the variance as estimated by MSE is within acceptable limits (which may depend on the question in consideration) arterial blood sampling can be avoided in the rest of the study population. We stress that a given calibration should not be used in a different population without a critical review of its validity and preferably validation through blood sampling.
Conclusion
We can estimate Km in similar studies using the Parker and Feng 8 method followed by calibration without blood samples. By using the linear transformation calibration principle, nonbiased and low-variance Km values can be obtained. The calibration principle may be applied in other studies, thus obviating the need for arterial blood sampling once the calibration parameters have been established in a subset of the study population. This method is robust to partial volume effects and thus potentially useful in other regions of the body.
Acknowledgements
The authors thank Thomas Beyer, CMI-experts, GmbH, Zürich, Switzerland, and Nic Gillings, Rigshospitalet, Copenhagen, Denmark, for critical comments and helpful suggestions.
Conflicts of interest
There are no conflicts of interest.
Footnotes
Part of this study was previously presented as a poster at the Annual European Association of Nuclear Medicine Congress in 2012. Abstract number: PW054.
Correspondence to Anders N. Christensen, MSc Eng, Department of Applied Mathematics and Computer Science, Technical University of Denmark, Matematiktorvet, Bygning 324, 2800 Kongens Lyngby, Denmark Tel: +45 452 534 27; fax: +45 458 813 99; e-mail: anym@dtu.dk
References
- 1.Phelps ME, Huang SC, Hoffman EJ, Selin C, Sokoloff L, Kuhl DE.Tomographic measurement of local cerebral glucose metabolic rate in humans with (F-18)2-fluoro-2-deoxy-d-glucose: validation of method.Ann Neurol 1979;6:371–388 [DOI] [PubMed] [Google Scholar]
- 2.Mourik JEM, van Velden FHP, Lubberink M, Kloet RW, van Berckel BNM, Lammertsma AA, Boellaard R.Image derived input functions for dynamic high resolution research tomograph pet brain studies.Neuroimage 2008;43:676–686 [DOI] [PubMed] [Google Scholar]
- 3.Croteau E, Lavallée E, Labbe SM, Hubert L, Pifferi F, Rousseau JA, et al. Image-derived input function in dynamic human PET/CT: methodology and validation with 11C-acetate and 18F-fluorothioheptadecanoic acid in muscle and 18F-fluorodeoxyglucose in brain.Eur J Nucl Med Mol Imaging 2010;37:1539–1550 [DOI] [PMC free article] [PubMed] [Google Scholar]
- 4.Lüdemann L, Sreenivasa G, Michel R, Rosner C, Plotkin M, Felix R, et al. Corrections of arterial input function for dynamic H215o PET to assess perfusion of pelvic tumours: arterial blood sampling versus image extraction.Phys Med Biol 2006;51:2883–2900 [DOI] [PubMed] [Google Scholar]
- 5.Puri T, Blake GM, Frost ML, Moore AEB, Siddique M, Cook GJR, et al. Validation of image-derived arterial input functions at the femoral artery using 18F-fluoride positron emission tomography.Nucl Med Commun 2011;32:808–817 [DOI] [PubMed] [Google Scholar]
- 6.Zanotti-Fregonara P, Chen K, Liow J-S, Fujita M, Innis RB.Image-derived input function for brain pet studies: many challenges and few opportunities.J Cereb Blood Flow Metab 2011;31:1986–1998 [DOI] [PMC free article] [PubMed] [Google Scholar]
- 7.Zanotti-Fregonara P, Liow J-S, Fujita M, Dusch E, Zoghbi SS, Luong E, et al. Image-derived input function for human brain using high resolution PET imaging with [C](R)-rolipram and [C]PBR28.PLoS One 2011;6:e17056. [DOI] [PMC free article] [PubMed] [Google Scholar]
- 8.Parker BJ, Feng D.Graph-based Mumford–Shah segmentation of dynamic pet with application to input function estimation.IEEE Trans Nucl Sci 2005;52:79–89 [Google Scholar]
- 9.Mørup M, Hansen LK. Archetypal analysis for machine learning. In: Machine Learning for Signal Processing (MLSP). IEEE Workshop; 29 August 2010; Kittilä, Finland.
- 10.Mourik JEM, Lubberink M, Klumpers UMH, Comans EF, Lammertsma AA, Boellaard R.Partial volume corrected image derived input functions for dynamic PET brain studies: methodology and validation for [11C]flumazenil.Neuroimage 2008;39:1041–1050 [DOI] [PubMed] [Google Scholar]
- 11.Backes H, Ullrich R, Neumaier B, Kracht L, Wienhard K, Jacobs AH.Noninvasive quantification of 18F-FLT human brain PET for the assessment of tumour proliferation in patients with high-grade glioma.Eur J Nucl Med Mol Imaging 2009;36:1960–1967 [DOI] [PMC free article] [PubMed] [Google Scholar]
- 12.Liptrot M, Adams KH, Martiny L, Pinborg LH, Lonsdale MN, Olsen NV, et al. Cluster analysis in kinetic modelling of the brain: a noninvasive alternative to arterial sampling.Neuroimage 2004;21:483–493 [DOI] [PubMed] [Google Scholar]
- 13.Su K-H, Wu L-C, Liu R-S, Wang S-J, Chen J-C.Quantification method in [18F]fluorodeoxyglucose brain positron emission tomography using independent component analysis.Nucl Med Commun 2005;26:995–1004 [DOI] [PubMed] [Google Scholar]
- 14.Hartigan JA, Wong MA.Algorithm AS 136: A K-means clustering algorithm.J R Stat Soc 1979;28:100–108 [Google Scholar]
- 15.DeFronzo RA, Tobin JD, Andres R.Glucose clamp technique: a method for quantifying insulin secretion and resistance.Am J Physiol 1979;237:E214–E223 [DOI] [PubMed] [Google Scholar]
- 16.Kinahan PE, Townsend DW, Beyer T, Sashin D.Attenuation correction for a combined 3D PET/CT scanner.Med Phys 1998;25:2046–2053 [DOI] [PubMed] [Google Scholar]
- 17.Naganawa M, Kimura Y, Ishii K, Oda K, Ishiwata K, Matani A.Extraction of a plasma time–activity curve from dynamic brain PET images base on independent component analysis.IEEE Trans Biomed Eng 2005;52:201–210 [DOI] [PubMed] [Google Scholar]
- 18.Chen K, Bandy D, Reiman E, Huang SC, Lawson M, Feng D, et al. Noninvasive quantification of the cerebral metabolic rate for glucose using positron emission tomography, 18F-fluoro-2-deoxyglucose, the Patlak method, and an image-derived input function.J Cereb Blood Flow Metab 1998;18:716–723 [DOI] [PubMed] [Google Scholar]
- 19.Efron B, Tibshirani R.Improvements on cross-validation: the. 632+ bootstrap method.J Am Stat Assoc 1997;92:548–560 [Google Scholar]
- 20.Mourik JEM, Lubberink M, Schuitemaker A, Tolboom N, van Berckel BNM, Lammertsma AA, Boellaard R.Image-derived input functions for PET brain studies.Eur J Nucl Med Mol Imaging 2009;36:463–471 [DOI] [PubMed] [Google Scholar]
- 21.Patlak CS, Blasberg RG, Fenstermacher JD.Graphical evaluation of blood-to-brain transfer constants from multiple-time uptake data.J Cereb Blood Flow Metab 1983;3:1–7 [DOI] [PubMed] [Google Scholar]
- 22.Patlak CS, Blasberg RG.Graphical evaluation of blood-to-brain transfer constants from multiple-time uptake data. generalizations.J Cereb Blood Flow Metab 1985;5:584–590 [DOI] [PubMed] [Google Scholar]
- 23.Zanotti-Fregonara P, Fadaili EM, Maroy R, Comtat C, Souloumiac A, Jan S, et al. Comparison of eight methods for the estimation of the image-derived input function in dynamic [(18)F]-FDG PET human brain studies.J Cereb Blood Flow Metab 2009;29:1825–1835 [DOI] [PubMed] [Google Scholar]
- 24.Naganawa M, Kimura Y, Ishii K, Oda K, Ishiwata K.Temporal and spatial blood information estimation using bayesian ICA in dynamic cerebral positron emission tomography.Digit Signal Process 2007;17:979–993 [Google Scholar]
- 25.Lewis P, Psaila JV, Davies WT, McCarty K, Woodcock JP.Measurement of volume flow in the human common femoral artery using a duplex ultrasound system.Ultrasound Med Biol 1986;12:777–784 [DOI] [PubMed] [Google Scholar]
- 26.Sandgren T, Sonesson B, Ahlgren R, Länne T.The diameter of the common femoral artery in healthy human: influence of sex, age, and body size.J Vasc Surg 1999;29:503–510 [DOI] [PubMed] [Google Scholar]


