

Abstract
The rapid advancements in mass spectrometry (MS) instrumentation, particularly in Fourier transform (FT) MS, have made the acquisition of high-resolution and high-accuracy mass measurements routine. However, the software tools for the interpretation of high-resolution MS data are underdeveloped. Although several algorithms for the automatic processing of high-resolution MS data are available, there is still an urgent need for a user-friendly interface with functions that allow users to visualize and validate the computational output. Therefore, we have developed MASH Suite, a user-friendly and versatile software interface for processing high-resolution MS data. MASH Suite contains a wide range of features that allow users to easily navigate through data analysis, visualize complex high-resolution MS data and manually validate automatically processed results. Furthermore, it provides easy, fast and reliable interpretation of top-down, middle-down and bottom-up MS data. MASH Suite is convenient, easily operated and freely available. It can greatly facilitate the comprehensive interpretation and validation of high-resolution MS data with high accuracy and reliability.
Keywords: Top-down Mass Spectrometry, Tandem Mass Spectrometry, Electron Capture Dissociation, Data processing, Bioinformatics
Introduction
The rapid advancements in mass spectrometry (MS) instrumentation, particularly in Fourier transform (FT) MS, have made the acquisition of high-resolution and high-accuracy mass measurements routine [1,2,3,4]. The high-resolution mass measurements have enabled the analysis of increasingly complex mixtures for proteomics and metabolomics among others [1]. Due to the complexity of the spectra generated by high-resolution instruments, deconvolution and deisotoping methods have been developed to assist in peak detection by reducing the false positive rate and effectively handling overlapping peaks [2,5–11].
THRASH (Thorough High Resolution Analysis of Spectra by Horn) is the first and most well known fully automated computer algorithm for the analysis of complex high-resolution electrospray ionization (ESI)/FTMS data [5]. Unfortunately, the general use of THRASH was significantly limited because the main portion of the THRASH code was written in PV-WAVE command language (Version 6.10, Visual Numerics, Houston, TX) with the Odyssey VDA interface (Finnigan, Madison, WI) [5], which is not compatible with the modern computing environment. Therefore, Decon2LS and its successor DeconMSn were developed to incorporate the THRASH algorithm with the modern computing environment and improve the accuracy in determining the charge state and monoisotopic mass of precursor ions from high-resolution tandem mass spectrometry (MS/MS) data [6,8]. In addition, there are several other algorithms for processing high-resolution MS data [2,7,9,11,12]. Nonetheless, there is an urgent need for developing a software package to process high-resolution MS data with a user-friendly interface that is compatible with the modern computing environment and can offer comprehensive visualization features for manual data validation.
Herein, our laboratory has developed MASH Suite, a user-friendly and versatile software interface, for interpretation and visualization of high-resolution MS data. MASH Suite is a multifaceted software package, which is designed to provide a host of functions for effective MS data processing, interpretation, visualization and presentation. In addition, it allows for the interpretation of top-down, middle-down and bottom-up high-resolution MS data and enables users to perform MS data pre-processing, processing, and post-processing in a single interface equipped with a variety of visualization features.
Methods
MASH Suite is written on the Microsoft .NET framework. The main scientific algorithms are written in C++, and the visual development was written with C#. The windows were coded using Qios Devsuite (http://www.qiosdevsuite.com), and the graphs and spectrum charts were coded using Microsoft Chart Controls. The algorithm used in MASH Suite is based on THRASH [5] and Decon2LS open source code [6].
The graphical user interface of MASH Suite is designed using TDI (tabbed document interface), which compiles several experiment windows under a single parent window, allowing users to navigate through the processes of data analysis and presentation. These windows include Workflow and Parameters, Sequence Table, and Experiments. The software architecture pattern used for constructing MASH Suite is MVC (model-view-controller) and the data tables of MASH Suite were constructed by Listview and Datagrid structures, which contain independent toolbars and menus.
Results and Discussion
MASH Suite Overview
MASH Suite provides a versatile and user-friendly interface for high-resolution MS data analysis. It utilizes a THRASH-based algorithm for the accurate detection of peaks, determination of charge state, calculation of monoisotopic and most abundant masses, and matching of the experimental isotopic distributions with theoretical isotopomer abundance distribution profiles generated based on averagine [5,10]. It is capable of processing and analyzing top-down MS, as well as bottom-up and middle-down MS data. Moreover, it can quantify both MS and MS/MS data and facilitate the identification of protein post-translational modifications (PTMs). More importantly, MASH Suite has unique visualization features, which not only allow the users to visualize complex high-resolution MS and MS/MS data but also offer presentation of the results and direct output of the figures for publication. Furthermore, it provides users with a high degree of control over customization of the interface. Users can manage the layout of the interface by resizing and rearranging the windows. Each window can be pinned or minimized to the side or the bottom of the screen. Furthermore, MASH Suite allows users to adjust the data analysis criteria and manually validate the automatically processed results. Below is a brief description of the unique features and functions of the MASH Suite (details please see the User Manual available in the electronic supplemental material).
Workflow and Parameters
We designed the workflow of MASH Suite according to the logical progression of MS data analysis, which begins with data processing and subsequently proceeds to analysis and presentation of the data (Figure 1a). Workflow and Parameters (Figure 1b) is an integrated window that grants users access to all the functions provided by MASH Suite from a single location. The window presents an intuitive, chronological workflow that navigates users through data analysis and presentation steps. In addition, in the same window, users are able to define primary and advanced parameters for customized data processing and analysis.
Figure 1.

(a) Schematic drawing of the MASH Suite workflow. (b) Navigation panel guiding users through data pre-processing, processing, and post-processing steps.
Spectrum View and Mass List
MASH Suite can automatically process high-resolution MS raw data and generate theoretical isotopomer abundance distributions that match the experimental profiles. After users upload raw data generated by the instruments, a peak list (Supplemental Figure 1a) composed of all the isotopomers is generated. These isotopomers are then deisotoped to generate a mass list (Supplemental Figure 1b), which groups the isotopomers into isotopic clusters and generates a theoretical distribution profile calculated from averagine [5, 10]. A fit score is assigned to the isotopic clusters according to how well the experimental data fit the theoretical distribution. The clusters are included in the mass list only if the fit score is higher than the minimum fit score specified by the users in Parameters. Each theoretical distribution cluster contains the most abundant mass, monoisotopic mass and a theoretical chemical formula. The information is displayed in the mass list and this list is subsequently used for further identification and characterization of the proteins, peptides or fragment ions if a specific sequence is given.
In addition, MASH Suite provides users with a concrete graphical representation of their data through the Spectrum View window (Supplemental Figure 1c). Selecting any isotopic peak clusters automatically displays the theoretical and experimental distribution profiles with color-coded peaks for better visualization. The Spectrum View window offers a number of unique features described in the following sections.
New Match
Existing peak detecting algorithms sometimes fail to detect low-intensity peaks, which are otherwise detectable if the signal to noise (S/N) threshold is decreased. However, as a trade-off, the false positive rate will be significantly increased. MASH Suite solves this dilemma with the New Match function, which allows users to modify the S/N threshold to detect low-abundance peaks in certain m/z regions without producing false positives at other m/z regions of the spectrum (More details in the User Manual).
Dalton Shift
MASH suites provides users with the Dalton Shift function to correct the theoretical distributions based on averagine by shifting the theoretical isotopic distribution incrementally to the left or right by a single Dalton. This can generate a better matching of the theoretical distribution clusters to the experimental data, and a better fit score to replace the original one (Details in Figure 2 and Supplemental Figure 2 as well as the User Manual).
Figure 2.

Visualization of the dalton-shift function. This feature allows users to shift the theoretical isotopic distribution for one dalton to either the left or right on the m/z axis using the green arrows located on the toolbar of the Spectrum View window. Shifting the spectrum recalculates the fit percentage for the new spectrum fitting.
Mass Pair Search
Identification and characterization of PTMs is a major part of proteomics research [9], but manual identification of PTMs is time-consuming. Mass Pair Search function enables users to easily search for potential protein modifications when the mass difference between the modified and unmodified proteins is known, and thus provides a short list of mass pairs selected from the mass list for further characterization (Supplemental Figure 3).
Quantitation
MASH Suite's quantitation feature calculates the relative abundance of peak clusters to reflect the amount of molecules present in the sample by summation of the peak heights of the most abundant isotopomers within the isotopic cluster, similarly as described previously [13,14,15]. Users can define the number of most abundant isotopomers to be considered in the quantitation (details see the User Manual). In addition, MASH Suite can present the quantitation results as a table and/or a chart to provide users with more comprehensive interpretation (Figure 3). Quantitation figures can then be directly exported and edited for use in publications.
Figure 3.
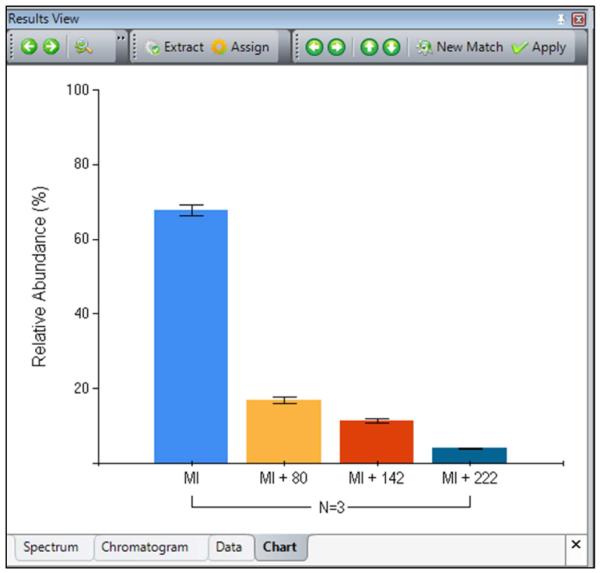
A quantitation bar graph showing the relative abundance of four proteoforms from three top-down datasets with error bar showing the standard deviation. The bar graph can be directly exported to PowerPoint or other graphic processing software for further edit.
Sequence Table
MASH Suite allows users to input the reference amino acid sequences in the Sequence Table window for further analysis of data. The monoisotopic mass of the proteins and its fragments will be calculated automatically and compared with the experimental masses in the mass list. Moreover, the Sequence Table window allows users to assign PTMs to the amino acid sequence to characterize the proteins of interest. Functions provided by the Sequence Table vary among different experimental modes and will be discussed in the following sections.
Interpretation and Visualization of Top-Down MS Data
Compared with the traditional bottom-up MS method, top-down MS is an emerging method that is better suited for the analysis of protein primary structure and PTMs [3,4]. MASH Suite is equipped to handle MS and MS/MS data from top-down experiments. In full MS mode, the monoisotopic mass of the peak cluster can be matched to the reference sequence that enables users to identify the proteins together with the covalently modified counterparts as well as non-covalent adducts (Figure 4). In MS/MS mode, with fragmentation method (CAD or ECD) specified, a list of all theoretical fragments (including b/y or c/z˙ pairs) is computationally generated according to the reference sequence. Experimental mass values are then matched to those in the theoretically generated fragments list. The fragments are displayed in the Sequence Table with cleavage indicators for better visualization (Figure 5). When PTMs are assigned, the theoretical fragment list will change accordingly and, subsequently experimental data is re-matched.
Figure 4.

A representative screenshot visualizing the processed high-resolution MS data of an intact protein, tropomyosin (32.7 kDa), purified from swine hearts. Left panel, data process menu and common parameters; right panel, an example of intact protein isotopomer peak fitting (top) and generated mass list with ion assignments (bottom). Circles represent theoretical isotopic abundance distribution of the isotopomer peaks. Blue circle represents monoisotopic mass peak. Green circle denotes the most abundant mass peak. Molecular weights were calculated based on DNA-prdicted sequence of Sus scrofa Tm (UnitprotKB/Swiss-Prot P42639, TPM1_PIG) with acetylation at the N-terminus (+42.01) and two amino acid polymorphisms P38→Q (−28.04) and P64→L (16.03) [16].
Figure 5.

A representative screenshot visualizing the processed MS/MS data of tropomyosin purified from swine hearts. Left panel, process menu and common parameters; middle panel, fragment ion isotopomer peak fitting (top) and generated peak list with ion assignment (bottom) according to a given sequence; right panel: fragmentation map based on the validated mass list and ion assignments. Fragments were assigned based on DNA-prdicted sequence of Sus scrofa Tm (UnitprotKB/Swiss-Prot P42639, TPM1_PIG) with acetylation at the N-terminus (+42.01) and two amino acid polymorphisms, P38→Q (−28.04) and P64→L (16.03) [16].
Processing and Visualization of Middle-down and Bottom-up MS Data
In addition to top-down MS data, MASH Suite allows users to process and visualize middle-down and bottom-up MS spectra. Users can choose specific enzymes used in the experiment and generate theoretical masses for the peptides that result from the digestion to match the masses in the peak list accordingly. These peptides are highlighted in the Sequence Table window if they can be matched to the protein sequence with the specific enzymatic digestion selected. When multiple experiments with one or more enzyme(s) are added, MASH Suite allows users to compile their data into the same Sequence Table window, effectively showing the partial or total coverage of the sequence (Figure 6). Details describing these functions can be found in the User Manual.
Figure 6.

A screenshot of a middle-down (Glu-C digest) MS data interpretation and visualization. The Spectrum View window displays the isotopic distribution of a selected peak, and the Sequence Table shows the enzyme digest fragments that have been matched to the experimental data by highlighting the matched fragments in one color (purple), and the selected fragment showing in Spectrum View for visualization and validation in another color (yellow). Peptides were assigned to the DNA-predicted sequence of recombinant cardiac myosin binding protein C (cMyBP-C) C0-C4 with an N-terminal acetylation [3].
Conclusions and future directions
In summary, MASH Suite provides a versatile and user-friendly interface for high-resolution MS data analysis including top-down MS, bottom-up MS and middle-down MS data. It grants users access to a suite of tools for the characterization of proteins, provided that sequence data is available. More importantly, MASH Suite creates and maintains a user-friendly environment through customization of the interface layout and a series of visualization properties, which greatly facilitates the analysis of complex high-resolution MS and MS/MS data. Future work includes coupling the MASH Suite with currently available database searching software packages for the identification and characterization of unknown proteins in complex mixtures.
Supplementary Material
Acknowledgements
We thank Yi-chen Chen, Serife Guner, Jiang Zhang, and Matthew Lawrence for helpful discussions. We thank Santosh Valeja for critical reading of this manuscript. We are also grateful to David Horn for his kind assistance at the early stage. Financial support was kindly provided by the Wisconsin Partnership Fund for a Healthy Future, American Heart Association Scientist Development Grant 0735443Z and NIH R01HL096971 and R01HL109810 (to YG).
References
- 1.Xian F, Hendrickson CL, Marshall AG. High resolution mass spectrometry. Anal. Chem. 2012;84:708–719. doi: 10.1021/ac203191t. [DOI] [PubMed] [Google Scholar]
- 2.Hoopmann MR, Finney GL, MacCoss MJ. High-speed data reduction, feature detection and MS/MS spectrum quality assessment of shotgun proteomics data sets using high-resolution mass spectrometry. Anal. Chem. 2007;79:5620–5632. doi: 10.1021/ac0700833. [DOI] [PMC free article] [PubMed] [Google Scholar]
- 3.Ge Y, Rybakova IN, Xu Q, Moss RL. Top-down high-resolution mass spectrometry of cardiac myosin binding protein c revealed that truncation alters protein phosphorylation state. Proc. Natl. Acad. Sci. U. S. A. 2009;106:12658–12663. doi: 10.1073/pnas.0813369106. [DOI] [PMC free article] [PubMed] [Google Scholar]
- 4.Siuti N, Kelleher NL. Decoding protein modifications using top-down mass spectrometry. Nat. Methods. 2007;4:817–821. doi: 10.1038/nmeth1097. [DOI] [PMC free article] [PubMed] [Google Scholar]
- 5.Horn DM, Zubarev RA, McLafferty FW. Automated reduction and interpretation of high resolution electrospray mass spectra of large molecules. J. Am. Soc. Mass Spectrom. 2000;11:320–332. doi: 10.1016/s1044-0305(99)00157-9. [DOI] [PubMed] [Google Scholar]
- 6.Jaitly N, Mayampurath A, Littlefield K, Adkins JN, Anderson GA, Smith RD. Decon2LS: An open-source software package for automated processing and visualization of high resolution mass spectrometry data. BMC Bioinform. 2009:10. doi: 10.1186/1471-2105-10-87. [DOI] [PMC free article] [PubMed] [Google Scholar]
- 7.Park K, Yoon JY, Lee S, Paek E, Park H, Jung HJ, Lee SW. Isotopic peak intensity ratio based algorithm for determination of isotopic clusters and monoisotopic masses of polypeptides from high-resolution mass spectrometric data. Anal. Chem. 2008;80:7294–7303. doi: 10.1021/ac800913b. [DOI] [PubMed] [Google Scholar]
- 8.Mayampurath AM, Jaitly N, Purvine SO, Monroe ME, Auberry KJ, Adkins JN, Smith RD. DeconMSn: a software tool for accurate parent ion monoisotopic mass determination for tandem mass spectra. Bioinformatics. 2008;24:1021–1023. doi: 10.1093/bioinformatics/btn063. [DOI] [PMC free article] [PubMed] [Google Scholar]
- 9.Liu XW, Inbar Y, Dorrestein PC, Wynne C, Edwards N, Souda P, Whitelegge JP, Bafna V, Pevzner PA. Deconvolution and database search of complex tandem mass spectra of intact proteins. Mol. Cell. Proteomics. 2010;9:2772–2782. doi: 10.1074/mcp.M110.002766. [DOI] [PMC free article] [PubMed] [Google Scholar]
- 10.Senko MW, Beu SC, McLafferty FW. Automated assignment of charge states from resolved isotopic peaks for multiply-charged ions. J. Am. Soc. Mass Spectrom. 1995;6:52–56. doi: 10.1016/1044-0305(94)00091-D. [DOI] [PubMed] [Google Scholar]
- 11.Zhang ZQ, Marshall AG. A universal algorithm for fast and automated charge state deconvolution of electrospray mass-to-charge ratio spectra. J. Am. Soc. Mass Spectrom. 1998;9:225–233. doi: 10.1016/S1044-0305(97)00284-5. [DOI] [PubMed] [Google Scholar]
- 12.Senko MW, Beu SC, McLafferty FW. Automated assignment of charge states from resolved isotopic peaks for multiply charged ions. J. Am. Soc. Mass Spectrom. 1995;6:52–56. doi: 10.1016/1044-0305(94)00091-D. [DOI] [PubMed] [Google Scholar]
- 13.Pesavento JJ, Mizzen CA, Kelleher NL. Quantitative analysis of modified proteins and their positional isomers by tandem mass spectrometry: human histone H4. Anal. Chem. 2006;78:4271–4280. doi: 10.1021/ac0600050. [DOI] [PubMed] [Google Scholar]
- 14.Zhang J, Guy MJ, Norman HS, Chen Y-C, Xu Q, Dong X, Guner H, Wang S, Kohmoto T, Young KH, Moss RL, Ge Y. Top-down quantitative proteomics identified phosphorylation of cardiac troponin I as a candidate biomarker for chronic heart failure. J. Proteome Res. 2011;10:4054–4065. doi: 10.1021/pr200258m. [DOI] [PMC free article] [PubMed] [Google Scholar]
- 15.Dong X, Sumandea CA, Chen Y-C, Garcia-Cazarin ML, Zhang J, Balke CW, Sumandea MP, Ge Y. Augmented phosphorylation of cardiac troponin I in hypertensive heart failure. J. Biol. Chem. 2012;287:848–857. doi: 10.1074/jbc.M111.293258. [DOI] [PMC free article] [PubMed] [Google Scholar]
- 16.Peng Y, Chen X, Zhang H, Xu Q, Hacker TA, Ge Y. Top-down targeted proteomics for deep sequencing of tropomyosin isoforms. J. Proteome Res. 2013;12:187–198. doi: 10.1021/pr301054n. [DOI] [PMC free article] [PubMed] [Google Scholar]
Associated Data
This section collects any data citations, data availability statements, or supplementary materials included in this article.