

Abstract
Quantum dots (QDs) possess highly desirable optical properties that make them ideal fluorescent labels for studying the dynamic behavior of proteins. However, a lack of characterization methods for reliably determining protein–quantum dot conjugate stoichiometry and functionality has impeded their widespread use in single-molecule studies. We used atomic force microscopic (AFM) imaging to demonstrate the 1:1 formation of UvrB–QD conjugates based on an antibody-sandwich method. We show that an agarose gel-based electrophoresis mobility shift assay and AFM can be used to evaluate the DNA binding function of UvrB–QD conjugates. Importantly, we demonstrate that quantum dots can serve as a molecular marker to unambiguously identify the presence of a labeled protein in AFM images.
In recent years, quantum dot (QD) bioconjugates have become increasingly popular in fluorescence experiments due to their narrow spectral emission width, strong emission intensity, small size, and good photostability.1,2 Their strong emission intensities allow single quantum dots to be visualized by epifluorescence microscopy, while individual molecules of green fluorescent protein (GFP) and other synthetic fluorophores require the use of total internal reflection fluorescence (TIRF) microscopy to enhance the signal-to-noise ratio.3 The unique properties of quantum dots also enable long-term tracking and monitoring of fast dynamics in single-molecule fluorescence microcopy studies. However, applications of protein–QD conjugates have so far been limited to antibodies for cell imaging, Western blot analysis, and fluorescence in situ hybridization.4–8 Enzymatic studies of proteins using quantum dot conjugates have been limited to only a few proteins such as myosin, dynein, actin filaments, Rdh54, and Msh2–Msh6.9–14 Several barriers are commonly encountered when using quantum dot labeled proteins in single-molecule studies. For example, conjugation of a quantum dot to a protein can potentially interfere with protein–protein and protein–ligand interactions. In addition, it is possible to conjugate more than one protein to a single functionalized quantum dot. Although gel electrophoresis in combination with Western blotting has been used to quantify the number of antibodies conjugated to quantum dots,15 this assay provides information on the average properties of protein–QD conjugates. Information on the population distribution of protein–QD stoichiometry is needed for single-molecule experiments to ensure accurate interpretation of the results. Furthermore, methods for reliably assessing the functionality of protein–QD conjugates, such as their interactions with protein partners and DNA, are still lacking.
Atomic force microscopy (AFM) is a powerful single-molecule technique for studying biomolecular interactions. This technique can produce topographic images at high resolution (typically ≥10 nm).16,17 However, for more complex, heteromeric assemblies, which are ubiquitous in many biological processes, using AFM imaging, we cannot always distinguish between different types of proteins. This problem could be addressed by incorporating a specific label on a particular protein. Quantum dots conjugated to a selected protein can serve as such labels because they form hard spheres (being semiconductor material) and thus produce much higher topographical signals in AFM than do the more compressible protein molecules. However, the use of quantum dot labeling in AFM imaging of multiprotein complexes has not been explored.
In this study, we used the bacterial DNA damage recognition protein UvrB (from Bacillus caldotenax), which is involved in nucleotide excision repair (NER) as a model to study the process and effects of protein–QD conjugation. NER can recognize and repair a wide-spectrum of DNA lesions. In prokaryotes, the NER pathway involves the UvrA, UvrB, and UvrC proteins.18,19 Although UvrA alone has DNA damage binding specificity, it is believed that it is the UvrAB complex that allows specific identification of a DNA lesion in vivo.18,19 Once a DNA lesion is encountered, UvrA hands off DNA to UvrB.20 UvrB then verifies the damage and recruits the endonuclease UvrC, which carries out incisions on the damaged DNA strand.21–23
In this report, we use AFM imaging to demonstrate the successful conjugation of single quantum dots to UvrB. We show that an agarose gel-based electrophoresis mobility shift assay (EMSA) can be used to evaluate the DNA binding function of UvrB–QD conjugates. Importantly, in the AFM images of UvrA, UvrB, and DNA, the quantum dot serves as a molecular marker to unambiguously identify the presence of UvrB on DNA.
Because our approach is easily applicable to the study of other proteins, our results have broad applications in the fast evolving single-molecule research fields such as fluorescence and atomic force microscopy. Furthermore, this work will facilitate the development of protein–QD conjugate-based high-sensitivity molecular machines that utilize the specific binding properties of proteins and the unique fluorescence properties of quantum dots.
Results and Discussion
Conjugation Approaches
In our first quantum dot conjugation approach, we conjugated UvrB directly to quantum dots functionalized with succinimidyl trans-4-(maleimidylmethyl)cyclohexane-1-carboxylate(SMCC). However, the resulting UvrB–QD conjugates showed only minimal DNA damage recognition activity in the presence of UvrA (data not shown). One possible interpretation for the drastically reduced DNA binding by UvrB–QD could be that steric hindrance of the quantum dot occludes UvrB’s ability to interact with either UvrA or DNA. Another possibility is that thiol modification of UvrB diminishes activity of the protein. To avoid direct modification of native amino acids on UvrB and increase the spacing between UvrB and the quantum dot, we developed an antibody sandwich-based conjugation method (Figure 1). We first added an hemagglutinin (HA) epitope tag (YPYDVPDYA) to the N-terminus of UvrB, producing HA-tagged UvrB. A mouse monoclonal HA antibody (Ab) served as an adaptor for conjugation of the HA-tagged UvrB protein to quantum dots that were covalently coupled to goat antimouse antibodies. We postulated that the added HA epitope tag and antibodies would provide sufficient spacing between UvrB and the quantum dot in the final conjugation product (UvrB–QD) to prevent potential steric hindrance of protein–protein and protein–DNA interactions posed by the quantum dot.
Figure 1.

Strategy used to form UvrB–QD conjugates. An HA epitope tag was added to the N-terminus of UvrB. A quantum dot coated with secondary antibody was bound to a primary antibody that recognizes the HA epitope. The UvrB structure was generated from PDB file 1T5L using PdbViewer. Drawings are not to scale.
Using the antibody sandwich linker, we produced conjugates of quantum dots with both WT UvrB and the domain 4 deletion mutant Δ4 UvrB. We chose Δ4 UvrB mutant conjugate for analyses because of the greater DNA binding affinities over WT UvrB.24 We previously showed that domain 4 of UvrB is autoinhibitory as its presence reduces DNA binding and ATP hydrolysis activities.24 Δ4 UvrB is fully functional in UvrA-dependent DNA damage recognition. As expected, conjugates of quantum dots to Δ4 UvrB showed higher DNA binding activity than WT UvrB–QD conjugates in our DNA binding assays (data not shown). For simplicity, throughout the remaining text and figure legends, we present only the results on HA-tagged Δ4 UvrB, and we refer to it as UvrB.
Evaluation of Stoichiometry of UvrB–QD Conjugates using AFM
AFM imaging has previously been used to characterize quantum dot size.4 Furthermore, studies have shown that the volume of a protein molecule measured from AFM images is directly correlated to its molecular weight (see Supporting Information).17,25 Hence, we investigated the use of AFM to directly observe binding of UvrB to quantum dots and quantify the stoichiometry of UvrB–QD conjugates at the single-molecule level. In our images, a secondary antibody-coated quantum dot exhibits a homogeneous, symmetrical shape with an AFM volume of 600 (±100) nm3 (Figure 2A). The AFM quantum dot heights are approximately 4–7 nm. This height measured from our images is smaller than the diameter of quantum dot conjugates specified by the manufacture (15–20 nm), which includes the semiconductor core, the core-protecting shell, polymer coating, and surface-bound antibodies. The smaller AFM heights are not unexpected because this measurement depends not only on structure of the sample but also on sample–tip and support–tip interactions.26 In addition, antibody molecules on the quantum dot surface can be compressed by the imaging process due to forces applied to the sample.27 Consistent with these ideas, AFM can provide good estimate of the height of the semiconductor core particle,4 while the average AFM height of biotin–IgG: streptavidin–QD measured from a previous AFM study is similar to our measurement of the antibody-coated quantum dots.28
Figure 2.

Visualization of quantum dots using AFM. AFM surface plots of secondary antibody coated QDs (A) alone, (B) with HA antibody (purple arrow), (C) with HA antibody and UvrB (orange arrows), and (D) with UvrB, HA antibody, and UvrA (yellow arrow). The circle in (D) indicates the part of particle containing UvrA dimer. The AFM image sizes in (A–D) are 300 nm × 300 nm at 10 nm height scale. See Supporting Information for detailed experimental conditions.
After addition of primary HA antibody, AFM images showed small particles in close proximity to the quantum dots (Figure 2B, purple arrow), indicating binding of HA antibody to the quantum dots. Statistical analysis of AFM images indicated that 17% (±1%) of the quantum dots carried these particles. After incubation of quantum dots with preformed UvrB–Ab complexes, some quantum dots in the AFM images were bound to distinct particles (Figure 2C, orange arrows) that were larger than the HA antibody alone (Figure 2B, purple arrow). The AFM volumes of these particles were 200–300 nm3, which is consistent with the combined molecular weights of UvrB and HA antibody. Statistical analyses of AFM images from multiple sample depositions indicated that with a QD:UvrB–Ab ratio of 5:1, 19% (±7%) of the quantum dots carried these particles. At QD:protein of 5:1, for both cases with HA antibody alone and UvrB–Ab, the percentages of protein–QD complexes are close to the expected number (20%). Furthermore, images obtained after incubation with a higher amount of UvrB–Ab (QD:UvrB–Ab of 1:1) revealed that, under these conditions, more of the quantum dots (47 ± 9%) carried a UvrB–Ab complex and approximately 5% of quantum dots showed two UvrB–Ab complexes attached to their surface (Supporting Information Figure S1). In contrast, with a 5-fold excess of quantum dots (QD:UvrB–Ab of 5:1), no quantum dots with more than one UvrB–Ab complex in close proximity were observed. These results clearly demonstrate that only 1:1 UvrB–QD conjugates were formed at 5:1 QD:UvrB–Ab (Figure 2C). We therefore used excess quantum dots (5:1 QD:UvrB–Ab ratio) in all further experiments to prevent multiple UvrBs from attaching to the secondary antibodies on one quantum dot surface and thus to ensure preferential formation of 1:1 UvrB–QD conjugates.
As an alternative protein conjugation method, we tried to use biotinylated HA antibodies in combination with streptavidin-coated quantum dots (Supporting Information Figure S2A, B). Biotinylated antibodies can be conjugated to streptavidin-coated quantum dots with high efficiency.15 However, using this strategy, multiple biotins were coupled to each HA antibody, which allowed the biotinylated HA antibody to act as a bridge between several streptavidin-coated quantum dots (Supporting Information Figure S2C, D) and led to the formation of aggregates. Therefore, we do not favor using multiply biotinylated antibodies for single-molecule studies.
Evaluation of the Interaction between UvrB–QD and UvrA Using AFM
The next step was to ensure that UvrB–QD conjugates are still functional, i.e., they can still associate with their protein partner, UvrA. In AFM images of UvrB–QD in the presence of UvrA, some quantum dots were attached to particles (Figure 2D, yellow arrow) that were bigger than UvrB–Ab complexes (Figure 2C, orange arrows). The additional volume is consistent with those measured for dimers of free UvrA (approximately 210 kDa) in AFM images. Statistical analysis of the AFM images indicated that, at a 4:1 ratio of UvrA:UvrB–Ab, 30 ± 13% of the total protein–QD conjugates (n = 2080) carried additional particles with sizes consistent with that of a UvrA dimer. In addition, with decreased concentration of UvrA (UvrA:UvrB–Ab at 1:1), considerably less protein–QD conjugates (10 ± 3%, n = 208) carried these additional particles. In a negative control experiment using only quantum dots and UvrA (no UvrB–Ab), colocalization with particles consistent with the size of UvrA was found only for 1 ± 1% (n = 283) of the quantum dots. These AFM results clearly demonstrate that UvrB conjugated to a quantum dot can effectively engage UvrA.
Evaluation of the DNA Binding Function of UvrB–QD Using EMSA
To investigate whether or not the UvrB–QD conjugate can still recognize DNA damage, we developed an agarose-based EMSA. While polyacrylamide offers the advantage of higher resolution than agarose gels, neither quantum dots alone nor UvrB–QD conjugates could enter the polyacrylamide gel matrix (unpublished observation). For EMSA experiments, we used a 50 base pair DNA duplex substrate (1 nM) with a fluorescein adducted thymine at the central position on the top strand (Figure 3A), UvrA (20 nM), and UvrB (100 nM). Prior studies have shown that this fluorescein adduct can be recognized as a DNA lesion by the NER system.20,29 A representative agarose gel and quantification of gels from three independent experiments are shown in parts B and C of Figure 3, respectively. In the agarose–EMSA assay, UvrB–DNA complexes (Figure 3B, lane 3) were clearly resolved, indicating that UvrB was loaded onto damaged DNA by UvrA. In contrast, neither HA antibody nor quantum dots alone bound to DNA (data not shown). In the presence of UvrA and preformed UvrB–Ab complexes, greater than 90% of the protein–DNA complexes afforded a supershift (Figure 3B, lane 4). This shift in complex mobility indicates that UvrB–Ab was loaded onto damaged DNA by UvrA. Preincubation of UvrB–Ab with the quantum dots led to a further supershift of the DNA-bound complexes in the presence of UvrA (Figure 3B, lanes 5 to 8). During electrophoresis in agarose gels, antibody coated-quantum dots have a distinct slow migration rate. As we increased the amount of quantum dots (from a ratio of QD:UvrB–Ab 1:1 to 5:1), the majority of UvrB–Ab–DNA complexes shifted to this slow migrating species, indicating that increases in quantum dot concentration directly increase the amount of UvrB–Ab–DNA complexed to quantum dots. At QD:UvrB–Ab ratios of 2:1 (Figure 3B, lane 7) and 5:1 (Figure 3B, lane 8), the observed UvrB–QD–DNA complexes represented ~27% and ~46%, respectively, of the total protein–DNA complexes (Figure 3C). In addition, we did not observe loading of quantum dot-labeled UvrB onto 50 base pair nondamaged duplex DNA in the presence of UvrA (data not shown). These results demonstrate that the UvrB–QD conjugate remains functional for DNA damage recognition and can be loaded specifically onto damaged DNA by UvrA.
Figure 3.

Testing the DNA binding activity of UvrB–QD conjugates using agarose-based electrophoretic mobility shift assay (EMSA). (A) DNA–substrate (F50/NDB50) used in EMSA. The asterisk mark and F symbol represent radioactive labeling and fluorescein (serving as a DNA lesion), respectively. (B) EMSA assays of UvrA-assisted loading of UvrB and UvrB–QD conjugates onto the DNA–substrate. (C) Quantification of the percentage of DNA bound by UvrB–QD conjugates (the bands labeled as “UvrB–QD–DNA” in Figure 3B). UvrB used in the experiments was HA-tagged Δ4 UvrB and for simplicity it is referred to as UvrB. See Supporting Information for detailed experimental conditions.
Evaluation of Quantum Dot as a Molecular Pointer for AFM Imaging
In AFM imaging of multiprotein–DNA complexes, such as UvrA–UvrB–DNA complexes, it is often difficult to determine which protein is bound to DNA. Because quantum dots have a uniform size distribution and are much larger than UvrA or UvrB, we explored the possibility of using the distinct topographic signals of quantum dots from UvrB–QD conjugates to pinpoint the presence of UvrB on DNA.
In our AFM study, the DNA–substrate is a 517 base pair PCR fragment (PCR517 DNA) containing a nick after nucleotide 208 (40%) from the 3′ end (Supporting Information, Figure S3). Results of prior studies showed that the UvrABC system can carry out incision of a nicked strand, suggesting that UvrAB recognizes a nick as DNA damage.20,30 Interestingly, we did not observe loading of UvrB onto nicked DNA using EMSA (data not shown). If UvrB dissociates from a nick during electrophoresis, we would not observe binding by UvrB to nicked DNA using EMSA. AFM is significantly less sensitive to the dynamics of the protein–DNA interactions because the deposition of the complexes onto the mica substrate is rapid and irreversible over the time scale of the depositions.25,31 Consequently, we chose this AFM approach to visualize the UvrB-nicked DNA complexes that were susceptible to dissociation during electrophoresis.
As a negative control, we first incubated secondary antibody-coated quantum dots with UvrA and nicked PCR517 DNA. In the AFM images obtained from this sample, the heights of the quantum dots were larger than 4 nm (Figure 4A, white arrows). Visually, the quantum dots appeared distinctly different from the UvrA dimers, which were <3 nm in height. This significant height difference enabled unambiguous distinction between quantum dots and UvrA. We did not observe UvrA bound to quantum dots in these images, indicating that UvrA does not nonspecifically bind to secondary antibody-coated quantum dots. Furthermore, quantum dots were not located on the DNA fragments in the images, indicating that quantum dots do not bind to DNA nonspecifically. However, our AFM images did show other particles bound on the DNA (Figure 4A, purple arrows). Greater than 95% of these particles had a volume of 250 ± 28 nm3, which is consistent with the size of the UvrA dimer (210 kDa). In addition, we observed that decreasing the ratio of UvrA:DNA by a factor of approximately 6 from 23 to 3.6 nM led to a 57% decrease in the percentage of DNA fragments that were bound by these particles, which further supports the conclusion that the particles bound to DNA are molecules of UvrA.
Figure 4.

AFM images and analyses of complexes formed on nicked PCR517 DNA fragment with (A) UvrA (purple and yellow arrows) and QDs (white arrow), (B) UvrA/UvrB–Ab (no QD, orange arrows), and (C) UvrA and UvrB–QD conjugates (red arrow). The top row shows representative AFM surface plots of the complexes. The images are 500 nm × 500 nm at 10 nm height scale. The bottom row presents the statistical analyses of position distributions of the complexes observed on DNA, including Gaussian fits to the data (gray lines). The occurrence probability is the observed probability of proteins or protein–QD conjugates binding in a given range of positions (see Supporting Information).
Approximately 45% of the UvrA was bound at DNA ends (for an example, see Figure 4A, yellow arrow). Given UvrA’s high affinity for ssDNA,32 it is not surprising that UvrA binds to DNA ends. To obtain the specificity of UvrA for a DNA nick, we excluded the end-bound UvrA and measured the distances between UvrA and the DNA fragment ends to produce a statistical position distribution. The position distribution for UvrA on nicked PCR517 DNA is fit well by a Gaussian curve centered at 40% of the DNA length (Figure 4A, lower panel), while UvrA was randomly distributed on PCR517 DNA that does not contain a nick (Supporting Information Figure S4A). A binomial distribution analysis of the position distribution of UvrA on nicked DNA indicates that the peak at 40% has a P value smaller than 4 × 10⁻². Furthermore, for the position distribution of UvrA on nicked DNA, the presence of a peak at 40% is independent of bin numbers, further supporting the significance of this peak. AFM provides a straightforward method for estimating DNA binding specificity based on the calculation of the probability of a protein binding to one specific site divided by the probability of binding to one nonspecific site (see Supporting Information).33 From the numbers of complexes bound at the specific site (the nick, at 40% of the DNA length) and at nonspecific positions, we calculated that the specificity of UvrA for a nick is 63 ± 19 (n = 110).
As a second control, we incubated UvrA and preformed UvrB–Ab together with the nicked DNA–substrate. AFM images of this sample also show protein complexes formed on DNA (Figure 4B, orange arrows), and the position distribution of the complexes on DNA is fit by a Gaussian curve centered at 39% (Figure 4B, lower panel). A binomial distribution analysis indicates that the peak at 39% is significant, with P < 7 × 10⁻⁵. From the numbers of complexes bound at the specific site (the nick) and at nonspecific positions, we obtained a specificity of 118 ± 32 (n = 44) for the nick. In these AFM images, the volumes of the complexes on DNA were more broadly distributed, ranging from 50 to 500 nm3. This variation probably reflects a mixture of different complex stoichiometries on DNA. As discussed above, the different protein types in the complexes cannot be unambiguously distinguished in the AFM images without a specific marker on one of the proteins.
AFM images obtained after incubation of UvrA and pre-formed UvrB–QD conjugates together with nicked PCR517 DNA showed DNA-bound particles consistent with the size of quantum dots (Figure 4C, red arrow). This finding agrees with results from our EMSA assays (Figure 3) and indicates that UvrA can load UvrB–QD onto DNA. We then evaluated whether we could unambiguously identify the presence of UvrB–QDs on DNA by measuring the volume (Figure 5A) and peak height (Figure 5B) of the DNA-bound particles. The volume distribution is bimodal with peaks centered at ~360 and ~950 nm3 (arrows in Figure 5A). The first peak centered at 360 nm3 includes volume sizes ranging from 100 to 560 nm3, which are consistent with the predicted AFM volumes of a UvrA dimer (approximately 240 nm3), UvrB–Ab (200–300 nm3), or UvrA–UvrB–Ab complex (440–540 nm3). The second peak centered at 950 nm3 is quite broad and includes volumes that are significantly larger than the volume of a quantum dot alone (600 ± 100 nm3). This result suggests that protein molecules of different stoichiometries (UvrB–Ab and UvrA–UvrB–Ab) are conjugated to the quantum dots. The measured peak height distribution is also bimodal with peaks centered at 1.6 and 5.6 nm (arrows in Figure 5B). The height of 1.6 nm is consistent with that measured from samples containing only unlabeled UvrA and UvrB proteins. For both the AFM volume and height distributions, the peaks of protein-only and protein–QD conjugates (arrows in Figure 5A, B) are well separated. These results demonstrate that the height as well as the volume can be used as primary criteria for the identification of quantum dots in AFM images. For protein samples, AFM volume is more reliable in differentiating the size of proteins.25 However, in the case of quantum dots, which produce much higher topographical signals than proteins due to their lower compressibility, height may be a better criterion to be used to indentify their presence (Figure 5). We counted a complex on DNA as a UvrB–QD conjugate-containing complex if its height was greater than 4 nm and its volume was greater than 600 nm3 (Figure 5). On the basis of these selection criteria, UvrB–QD conjugates bound to DNA can be identified unambiguously. It is worth noting that approximately 50% of the UvrB–QD conjugates bound to DNA were attached to DNA ends, similar to what we observed for UvrA alone. Again by excluding these end-bound conjugates, we obtained a position distribution histogram centered at 42% of the nicked DNA length. A binomial distribution analysis indicates that the peak at 42% is significant, with P < 2 × 10⁻³. From a Gaussian fit to this position distribution, we calculated the specificity of the UvrB–QD conjugate for a nick to be 111 ± 25 (n = 89), which is similar to what was observed in the presence of UvrA and UvrB–Ab complexes (in the absence of quantum dots). Furthermore, the distribution of UvrB–QD on non-nicked PCR517 DNA is not fit well to a Gaussian curve (Supporting Information Figure S4B). It is worth mentioning that due to the different sizes of UvrA–UvrB, UvrB, and the quantum dots, UvrB–QD conjugates containing UvrA can be distinguished from conjugates without UvrA bound. Examples of UvrB–QD and UvrA–UvrB–QD conjugates on DNA are shown in Figure S5 (Supporting Information).
Figure 5.
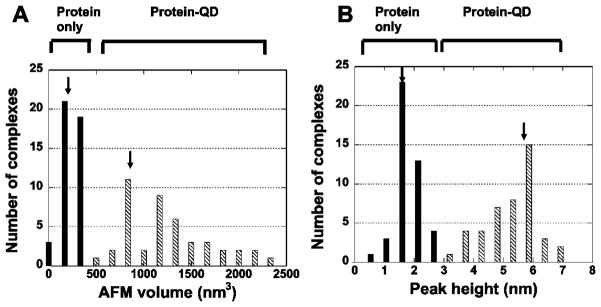
Statistical analyses of volume and peak height of complexes on DNA from AFM images. Data were collected on nicked PCR517 in the presence of UvrA, UvrB, HA antibody, and quantum dots. (A) AFM volume distribution. (B) Peak height distribution. The solid and hatched bars represent complexes that were defined as protein-only and protein–QD conjugates, respectively. Arrows point to the center (as defined by Gaussian distributions) of the peaks.
Comparison of the position distributions for UvrA only, UvrAB complexes (no QDs), and UvrB–QD conjugates reveals that the center of all three distributions is located at the specific DNA site (the nick). The results of specificity calculations suggest that the presence of UvrB increases the specificity for a DNA nick by a factor of approximately two (specificity of approximately 60 for UvrA versus 110–120 for UvrB and UvrB–QD). AFM imaging in combination with quantum dot conjugation allowed us to observe the specificity of UvrB for a nick, which has not been possible when using other biochemical assays. From analyses in Figure 4 (lower panels), it is worth noting a secondary binding site at 20–25% from the DNA ends. Most likely, it represents the preference of UvrAB proteins to two A-tracts (one A7 and one A5) that are present at that region on the PCR517 DNA fragment. It is known that A-tracts adopt a static bend in the minor groove of DNA,34 which may enhance UvrAB binding.
Conclusions
In summary, this work demonstrates novel approaches to label a specific protein with a single quantum dot, identify such labeled proteins, and confirm stoichiometry of protein–QD conjugates. Importantly, this study establishes AFM and EMSA as complementary methods to evaluate the extent of protein–QD conjugation, interaction between protein–QD conjugate and its protein partner, and DNA binding function of the final conjugate. Our results provide a basis for the development of new protein–QD conjugation strategies for use in single-molecule studies. We show that quantum dots are highly suitable molecular markers to use in AFM imaging for identifying the presence of a protein in the context of multiprotein complexes. Favorable fluorescence properties of quantum dots, such as their broad excitation spectrum, narrow emission peak, and availability in a wide range of emission wavelengths, make them an ideal candidate for multiplexing experiments. These properties and their suitability for visualizing protein–DNA complexes by AFM also open the door to a combinatory approach using AFM and single-molecule fluorescence microscopy to unambiguously identify more than one specific protein in multiprotein complexes.
Supplementary Material
Acknowledgments
We thank Drs. Karen Adelman and Yuan Liu (NIEHS) for suggestions regarding HA-tagged proteins and agarose EMSA, and Drs. Wade Lehmann, Leroy Worth Jr., and William A. Beard (NIEHS) for critical reading of this manuscript. This research was supported by the Intramural Research Program at NIEHS, NIH.
Footnotes
Supporting Information Available: Additional information includes Materials and Methods as well as figures showing more than one particles attached to a quantum dot at a 1:1 ratio of QD:UvrB–Ab, the aggregation of quantum dots in the presence of biotinylated HA antibody, assays confirming the nicking of the 517 base pair PCR fragment, statistical analysis of position distributions of UvrA and UvrB–QD on non-nicked DNA, and examples of UvrB–QD and UvrA–UvrB–QD conjugates on DNA.
References
- 1.Bruchez M, Jr, Moronne M, Gin P, Weiss S, Alivisatos AP. Science. 1998;281(5385):2013–2016. doi: 10.1126/science.281.5385.2013. [DOI] [PubMed] [Google Scholar]
- 2.Medintz IL, Uyeda HT, Goldman ER, Mattoussi H. Nat Mater. 2005;4(6):435–446. doi: 10.1038/nmat1390. [DOI] [PubMed] [Google Scholar]
- 3.Muthukrishnan G, Hutchins BM, Williams ME, Hancock WO. Small. 2006;2(5):626–630. doi: 10.1002/smll.200500223. [DOI] [PubMed] [Google Scholar]
- 4.Wolcott A, Gerion D, Visconte M, Sun J, Schwartzberg A, Chen S, Zhang JZ. J Phys Chem B. 2006;110(11):5779–5789. doi: 10.1021/jp057435z. [DOI] [PubMed] [Google Scholar]
- 5.Kaul Z, Yaguchi T, Harada JI, Ikeda Y, Hirano T, Chiura HX, Kaul SC, Wadhwa R. Biochem Cell Biol. 2007;85(1):133–140. doi: 10.1139/o06-205. [DOI] [PubMed] [Google Scholar]
- 6.Clapp AR, Goldman ER, Mattoussi H. Nat Protoc. 2006;1(3):1258–1266. doi: 10.1038/nprot.2006.184. [DOI] [PubMed] [Google Scholar]
- 7.Goldman ER, Anderson GP, Tran PT, Mattoussi H, Charles PT, Mauro JM. Anal Chem. 2002;74(4):841–847. doi: 10.1021/ac010662m. [DOI] [PubMed] [Google Scholar]
- 8.Makrides SC, Gasbarro C, Bello JM. Biotechniques. 2005;39(4):501–506. doi: 10.2144/000112004. [DOI] [PubMed] [Google Scholar]
- 9.Mansson A, Sundberg M, Balaz M, Bunk R, Nicholls IA, Omling P, Tagerud S, Montelius L. Biochem Biophys Res Commun. 2004;314(2):529–534. doi: 10.1016/j.bbrc.2003.12.133. [DOI] [PubMed] [Google Scholar]
- 10.Warshaw DM, Kennedy GG, Work SS, Krementsova EB, Beck S, Trybus KM. Biophys J. 2005;88(5):L30–L32. doi: 10.1529/biophysj.105.061903. [DOI] [PMC free article] [PubMed] [Google Scholar]
- 11.Reck-Peterson SL, Yildiz A, Carter AP, Gennerich A, Zhang N, Vale RD. Cell. 2006;126(2):335–348. doi: 10.1016/j.cell.2006.05.046. [DOI] [PMC free article] [PubMed] [Google Scholar]
- 12.Ali MY, Krementsova EB, Kennedy GG, Mahaffy R, Pollard TD, Trybus KM, Warshaw DM. Proc Natl Acad Sci USA. 2007;104(11):4332–4336. doi: 10.1073/pnas.0611471104. [DOI] [PMC free article] [PubMed] [Google Scholar]
- 13.Prasad TK, Robertson RB, Visnapuu ML, Chi P, Sung P, Greene EC. J Mol Biol. 2007;369(4):940–953. doi: 10.1016/j.jmb.2007.04.005. [DOI] [PMC free article] [PubMed] [Google Scholar]
- 14.Gorman J, Chowdhury A, Surtees JA, Shimada J, Reichman DR, Alani E, Greene EC. Mol Cell. 2007;28(3):359–370. doi: 10.1016/j.molcel.2007.09.008. [DOI] [PMC free article] [PubMed] [Google Scholar]
- 15.Pathak S, Davidson MC, Silva GA. Nano Lett. 2007;7:1839–1845. doi: 10.1021/nl062706i. [DOI] [PubMed] [Google Scholar]
- 16.Yang Y, Wang H, Erie DA. Methods. 2003;29(2):175–187. doi: 10.1016/s1046-2023(02)00308-0. [DOI] [PubMed] [Google Scholar]
- 17.Wang H, Yang Y, Erie DA. Characterization of protein–protein interactions using atomic force microscopy. In: Schuck P, editor. Protein Interactions: Biophysical Approaches for the Study of Complex Reversible Systems. Vol. 5. Springer Science+Business Media, LLC; New York: 2007. pp. 39–78. [Google Scholar]
- 18.Van Houten B, Croteau DL, Della Vecchia MJ, Wang H, Kisker C. Mutat Res. 2005;577(1–2):92–117. doi: 10.1016/j.mrfmmm.2005.03.013. [DOI] [PubMed] [Google Scholar]
- 19.Goosen N, Moolenaar GF. Res Microbiol. 2001;152(3–4):401–409. doi: 10.1016/s0923-2508(01)01211-6. [DOI] [PubMed] [Google Scholar]
- 20.Della Vecchia MJ, Croteau DL, Skorvaga M, Dezhurov SV, Lavrik OI, Van Houten B. J Biol Chem. 2004;279(43):45245–45256. doi: 10.1074/jbc.M408659200. [DOI] [PubMed] [Google Scholar]
- 21.Moolenaar GF, Franken KL, Dijkstra DM, Thomas-Oates JE, Visse R, van de Putte P, Goosen N. J Biol Chem. 1995;270(51):30508–30515. doi: 10.1074/jbc.270.51.30508. [DOI] [PubMed] [Google Scholar]
- 22.Moolenaar GF, Franken KL, van de Putte P, Goosen N. Mutat Res. 1997;385(3):195–203. doi: 10.1016/s0921-8777(97)00042-6. [DOI] [PubMed] [Google Scholar]
- 23.Van Houten B, Eisen JA, Hanawalt PC. Proc Natl Acad Sci USA. 2002;99(5):2581–2583. doi: 10.1073/pnas.062062599. [DOI] [PMC free article] [PubMed] [Google Scholar]
- 24.Wang H, Della Vecchia MJ, Skorvaga M, Croteau DL, Erie DA, Van Houten B. J Biol Chem. 2006;281(22):15227–15237. doi: 10.1074/jbc.M601476200. [DOI] [PubMed] [Google Scholar]
- 25.Ratcliff GC, Erie DA. J Am Chem Soc. 2001;123(24):5632–5635. doi: 10.1021/ja005750n. [DOI] [PubMed] [Google Scholar]
- 26.Muller DJ, Engel A. Biophys J. 1997;73(3):1633–1644. doi: 10.1016/S0006-3495(97)78195-5. [DOI] [PMC free article] [PubMed] [Google Scholar]
- 27.Hoh JH, Schoenenberger CA. J Cell Sci. 1994;107(Pt 5):1105–1114. doi: 10.1242/jcs.107.5.1105. [DOI] [PubMed] [Google Scholar]
- 28.Nehilla BJ, Vu TQ, Desai TA. J Phys Chem B. 2005;109(44):20724–20730. doi: 10.1021/jp052613+. [DOI] [PubMed] [Google Scholar]
- 29.Skorvaga M, Theis K, Mandavilli BS, Kisker C, Van Houten B. J Biol Chem. 2002;277(2):1553–1559. doi: 10.1074/jbc.M108847200. [DOI] [PubMed] [Google Scholar]
- 30.Moolenaar GF, Bazuine M, van Knippenberg IC, Visse R, Goosen N. J Biol Chem. 1998;273(52):34896–34903. doi: 10.1074/jbc.273.52.34896. [DOI] [PubMed] [Google Scholar]
- 31.Rivetti C, Guthold M, Bustamante C. J Mol Biol. 1996;264(5):919–932. doi: 10.1006/jmbi.1996.0687. [DOI] [PubMed] [Google Scholar]
- 32.Croteau DL, Della Vecchia MJ, Wang H, Bienstock RJ, Melton MA, Van Houten B. J Biol Chem. 2006;281(36):26370–26381. doi: 10.1074/jbc.M603093200. [DOI] [PMC free article] [PubMed] [Google Scholar]
- 33.Yang Y, Sass LE, Du C, Hsieh P, Erie DA. Nucleic Acids Res. 2005;33(13):4322–4334. doi: 10.1093/nar/gki708. [DOI] [PMC free article] [PubMed] [Google Scholar]
- 34.Tchernaenko V, Halvorson HR, Lutter LC. J Mol Biol. 2004;341(1):55–63. doi: 10.1016/j.jmb.2004.06.022. [DOI] [PubMed] [Google Scholar]
Associated Data
This section collects any data citations, data availability statements, or supplementary materials included in this article.