

Summary
Two-dimensional (2D) kinetic analysis directly measures molecular interactions at cell-cell junctions, thereby incorporating inherent cellular effects. By comparison, three-dimensional (3D) analysis probes the intrinsic physical chemistry of interacting molecules isolated from the cell. To understand how T-cell tumor reactivity relates to 2D and 3D binding parameters and to directly compare them, we performed kinetic analyses of a panel of human T-cell receptors (TCR) interacting with a melanoma self-antigen peptide (gp100209–217) bound to major histocompatibility complex (pMHC) in the absence and presence of coreceptor CD8. We found that while 3D parameters are inadequate to predict T-cell function, 2D parameters (which do not correlate with their 3D counterparts) show a far broader dynamic range and significantly improved correlation with T-cell function. Thus, our data support the general notion that 2D parameters of TCR–pMHC–CD8 interactions determine T-cell responsiveness and suggest a potential 2D-based strategy to screen TCRs for tumor immunotherapy.
Keywords: 2D kinetics, T cell activation, micropipette adhesion frequency assay, thermal fluctuation assay
Introduction
The interaction between T-cell receptor (TCR) and peptide-major histocompatibility complex (pMHC) not only defines T-cell specificity and sensitivity but also underpins T-cell development, activation, proliferation, and differentiation [1]. One of the long-lasting interests in immunology is to understand how T-cell functions are related to kinetic properties of the TCR–coreceptor–pMHC interaction. Despite extensive studies on measuring and correlating TCR–pMHC binding kinetics with T-cell activation [2–4], no clear answer has yet been reached [2].
The majority of kinetic studies employ surface plasmon resonance (SPR) technology. SPR measures the intrinsic properties of molecular interaction between soluble TCRs and pMHCs [5–7]. For naturally occurring TCRs, their interactions with pMHCs are generally of low affinity, with dissociation constants (KD) in the range of 1–100 μM [4]. To reconcile the low affinities with the remarkable sensitivity of T cells to antigens, various models have been proposed, e.g., coreceptors [3, 8], TCR oligomerization [9, 10] and co-agonism [11] models. A large array of SPR data on various TCR systems and their respective ligands points to the duration of TCR–pMHC engagement (the half-life, or its reciprocal, the off-rate) as the best correlator with T-cell functional outcomes [2, 12, 13]. However, many outliers exist [14, 15], especially for antagonist ligands [6, 16].
TCR affinity has also been shown to correlate with the strength of T-cell responses [3, 8, 17–19]. In some cases, however, TCR affinity above certain range may lead to plateaued [17, 19] or even attenuated [20–22] T-cell responses. It is often difficult to determine whether the off-rate or the affinity better predicts T-cell function, because the two parameters are related [4]. A recent study [23] suggested they may predict different aspects of T-cell activation.
Using multimeric binding to overcome the low monomeric TCR–pMHC affinity allows direct staining of the TCR on the T-cell surface with fluorescent pMHC tetramers [5, 8, 24], which also accounts for the coreceptor contribution not considered in most SPR measurements. However, it is difficult to derive intrinsic kinetic parameters from tetramer staining data [25]. Furthermore, pMHC tetramer usually fails to detect weak TCR–pMHC interactions, especially for MHC class II restricted TCR systems [26]. Both SPR and tetramer staining require one interacting species in the soluble form and thus are termed three-dimensional (3D) measurements [27].
One major caveat of 3D measurements by SPR is that soluble TCR fails to account for possible regulations by the complex T-cell membrane environment. To overcome this limitation, new technologies have been developed, including mechanically-based micropipette adhesion frequency assay and thermal fluctuation assay [27] and FRET-based single-molecule microscopy [28]. These techniques allow TCR–coreceptor–pMHC kinetics to be measured at the interface between a live T-cell and a surrogate APC. As the binding partners are anchored to their respective two-dimensional (2D) surfaces, their interactions are termed 2D binding [29–32]. Mechanically-based 2D analysis of TCR–pMHC interactions shows much higher sensitivity in detecting antigen-specific T cells than pMHC tetramer staining [26]. More importantly, 2D measurements have revealed dramatically different kinetic parameters than 3D measurements, with 2D parameters showing better correlation with T-cell responses [27, 33]. In addition, 2D techniques enable analysis of TCR–pMHC–CD8 trimolecular interactions, revealing signaling-dependent cooperation between the TCR and CD8 for pMHC binding, which synergistically enhances discrimination of peptides of varying potencies [34].
Previous 2D studies have only been conducted in limited systems using mouse TCRs recognizing foreign antigens by varying the cognate pMHC ligands. As an initial step to apply 2D analysis to understanding T-cell anti-tumor activities, here we analyzed the 2D kinetics of a panel of six human TCRs derived from immunized melanoma patients interacting with their specific pMHC – gp209-2M:HLA-A2, an affinity enhanced tumor-self antigen gp100209–217 [35], and compared the binding parameters with their 3D counterparts. We found that all 2D kinetic parameters showed better correlations with T-cell responses than 3D parameters. The results provide further support to the emerging paradigm that 2D kinetics determines T-cell responsiveness.
Results
3D kinetic parameters are inadequate predictors of T-cell functional activities
Previously, we have characterized a panel of human gp209-specific TCRs (Fig. 1A) expressed on mouse primary T cells [36]. However, these virus-transduced mouse T cells are unsuitable for 2D measurements because TCR expression levels showed wide cell-to-cell variation. We therefore used the 58α-/β-T-cell hybridoma (TCR−, CD3+ and CD8−) as the parental cell to create two panels of cell lines expressing each of the TCRs with or without co-expression of the full-length human CD8. These cell lines express consistent and comparable levels of TCR and/or CD8, as quantified by flow cytometry [27] (Fig. 1B) and are functional as determined by their ability to secrete IL-2 when stimulated with T2 (HLA-A2+) cells loaded with gp209-2M peptide (Fig. 1C and Supporting Information Fig. 1A). We first examined how the functional activities of the T-cell panel correlate with the TCR–pMHC binding kinetics determined by SPR [36]. 3D affinity weakly correlated (R2 = 0.60) with IL-2 secretion (Fig. 2A); however, the correlation was not statistically significant (p = 0.071). Additionally, 3D on-rate (Supporting Information Fig. 1B) showed no correlation (R2 = 0.073, p = 0.61).
Figure 1. Coexpression of human CD8 and gp209-specific TCRs on hybridomas improves T-cell function.
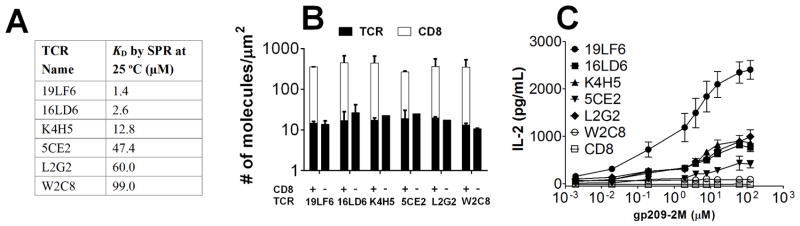
(A) Six gp209-specific TCRs isolated from melanoma patients listed in order of descending 3D affinities. (B) The TCRs and human CD8 were expressed on hybridomas at similar surface densities as quantified by flow cytometry. (C) Cytokine release of hybridomas expressing TCR and CD8 stimulated with T2 cells loaded with various amounts of gp209-2M peptide. Data are shown as mean ± STD (standard deviation) of triplicate measurements.
Figure 2. Correlation of 3D parameters to T-cell function.

(A) Correlation between 3D affinity determined by SPR and quantification of IL-2. (B) Tetramer staining MFI of CD8+ or CD8− hybridomas expressing the indicated TCRs. (C) Correlation between tetramer staining and 3D affinity. (D) Correlation between tetramer staining and IL-2 secretion. The solid lines represent linear regression with R2 and p values indicated. In panels A&D, only IL-2 secretion at a representative peptide concentration (8 μM) is shown; comparable results were obtained when using different peptide concentrations (see Materials and methods and Supporting Information Table 1).
One pitfall of the SPR 3D kinetic parameters is that the contribution of CD8 to TCR–pMHC binding is not considered, yet the function of most TCRs in this panel is CD8-dependent [36]. Without CD8 expression, only the two highest affinity TCRs (19LF6 and 16LD6) showed significant tetramer staining (Fig. 2B and Supporting Information Fig. 1C and D). The coexpression of CD8 significantly enhanced the mean fluorescence (MFI) of tetramer staining for all T cells (Fig. 2B and Supporting Information Fig. 1C). The tetramer MFI increased with the TCR affinity by SPR (Fig. 2C); the increase was most significant from the lowest to the second lowest affinity TCRs (W2C8 with a KD ~100 μM and L2G2 with a KD ~60 μM). This observation is similar to our previous study performed using primary mouse CD8 cells [36] and to other studies [8]. Similar to 3D TCR affinity, tetramer staining had no statistically significant correlation with TCR function (R2 = 0.46, p = 0.14, Fig. 2D). Furthermore, the off-rates of tetramer dissociation from hybridoma cells measured by the tetramer decay assay [5, 24] (Supporting Information Fig. 1D and E) did not correlate with TCR functional activity (R2 = 0.046, p = 0.68, Supporting Information Fig. 1F).
2D kinetics of TCR–pMHC interactions show a broad affinity range and fast off-rates
A possible reason for the lack of correlation between 3D kinetic parameters measured by SPR and T-cell functional activities could be that the soluble αβTCR in SPR measurement no longer connects with the cellular environment and hence misses its regulation or constraints [30]. Indeed, recent studies on several mouse TCR systems [26–28, 33] suggest that 2D TCR–pMHC kinetic measurements, which are performed in the native membrane environment, show better correlation with T-cell responsiveness. However, human self-antigen specific TCR systems have not been investigated. Furthermore, the previous 2D TCR–pMHC kinetic measurements varied the pMHC as opposed to the TCR. Therefore, we asked whether 2D measurements would better correlate the kinetics with responsiveness in our system.
Using the micropipette adhesion frequency assay [37], we first measured the 2D TCR–pMHC interaction using CD8− hybridoma cells. Despite the slow 3D off-rates for some of the TCRs [36], the adhesion frequency (Pa) vs. contact time (tc) curves had already reached plateaus at the shortest tc (0.1 s) for all six TCRs (Fig. 3A and Supporting Information Fig. 2A–E). The lack of a gradual transient phase in the binding curves indicates that the 2D off-rates are too fast to be measured by the micropipette system due to its limited temporal resolution (~0.2 s). Using Eq. 1 (see Supporting Information Materials and Methods), we calculated the effective affinities for the panel of TCRs from the plateau Pa levels (Fig. 3C). These 2D affinities showed a positive correlation (R2 = 0.75; p = 0.025) with, but a 2-log broader range than their 3D counterparts (Supporting Information Fig. 3A).
Figure 3. TCR and CD8 bind pMHC with fast 2D kinetics and a broad range of 2D affinities.
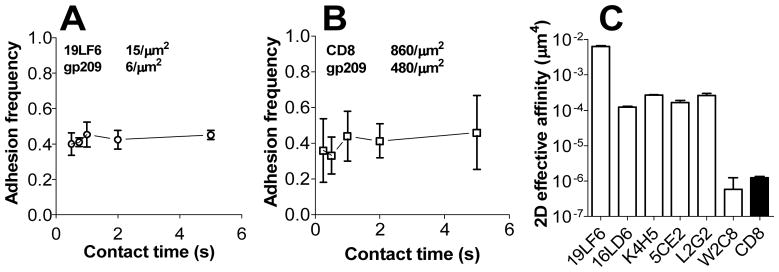
Adhesion frequency (Pa) vs. contact time plots of bimolecular TCR–pMHC (A, other TCRs are shown in Supporting Information Fig. 2A–E) or HLA-A2–CD8 (B) interactions measured by the micropipette with surface densities of TCR and pMHC indicated. Each point represents mean ± SEM (standard error of the mean) of Pa measured from 2–6 pairs of TCR+CD8− (A) or TCR−CD8+ (B) hybridomas and gp209-2M:HLA-A2 coupled RBCs. (C) 2D affinities of pMHC for a panel of TCR and CD8 calculated from the plateaued Pa according to Eq. 1 (Supporting Information Materials and Methods). Error bars represent uncertainty based on error propagation from adhesion frequency measurements.
Because of the fast TCR–pMHC dissociation, we used the thermal fluctuation assay [38] to determine the off-rates (Supporting Information Fig. 4). For all CD8− hybridoma cells, their lifetimes followed a linear distribution in the semi-log plot (Fig. 4A and Supporting Information Fig. 2F–J), consistent with a first-order kinetics of irreversible dissociation of a single monomeric bond with a single state [39]. Using this model, the off-rate is evaluated from the negative slope of the linear regression of the lifetime distribution data. The off-rates of pMHC dissociating from the individual TCRs in the panel are summarized in Fig. 4C. As the off-rates of some TCRs (W2C8, L2G2 and K4H5) are too fast to be determined by SPR [36] and because the pMHC tetramer only stained the two highest affinity TCRs when expressed in the CD8− hybridoma (Supporting Information Fig. 1C and D), the 2D data obtained here show that the thermal fluctuation assay has a higher sensitivity and temporal resolution than SPR or tetramer staining and allows us to obtain kinetic parameters for low-affinity fast dissociating TCRs that are otherwise unobtainable. The effective 2D on-rates were then calculated based on Ackon = AcKa × koff (Supporting Information Fig. 2K). We observed no correlation between 2D and 3D on-rates (R2 = 0.13; p = 0.55, Supporting Information Fig. 3B). 2D off-rates for the individual TCRs (Fig. 4C) are at least 15-fold faster than their 3D counterparts (Supporting Information Fig. 3C). The TCR with slowest 3D off-rate (19LF6; ~0.012 s−1) [36] has the fastest 2D off-rate (~11.4 s−1), amounting to a three orders of magnitude difference. Thus, for the panel of human TCRs interacting with a single pMHC, the 2D measurements substantially differ from the 3D measurements in both on- and off-rates and in affinity, similar to previous observations obtained when analyzing a single mouse TCR interacting with a panel of pMHCs [27, 28, 33].
Figure 4. TCR and CD8 dissociate from pMHC with fast 2D off-rates.
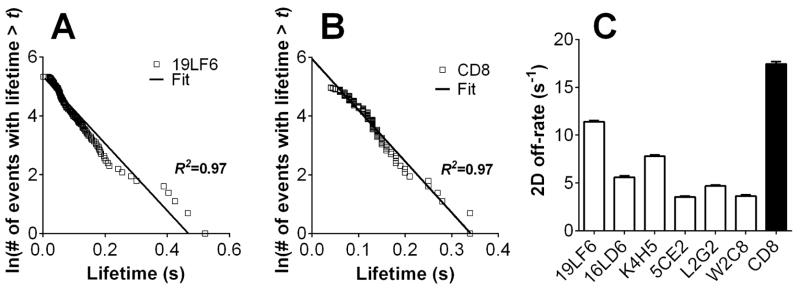
Semi-log plots of lifetime distributions of pMHC bonds with TCR (A, other TCRs are shown in Supporting Information Fig. 2F–J) or CD8 (B) measured by thermal fluctuation. The off-rate was calculated from the negative slope of linear regression. Error bars represent SEM. The high values summarized in (C) show fast dissociation kinetics.
2D HLA-A2–CD8 interaction has fast kinetics and low affinity
All of the TCRs studied here (except for 19LF6) rely on the coreceptor CD8 for their functional activities (Fig. 1C and Supporting Information Fig. 1A), yet, tetramer staining of TCR+CD8+ hybridoma cells yielded only insignificant correlation with the TCR functional outcome (Fig. 2D). Therefore, we asked whether 2D kinetic analysis of pMHC binding to these cells would better predict their T-cell responses. To dissect how CD8 contributes to 2D binding of pMHC to TCR+CD8+ cells, we first measured the HLA-A2–CD8 interaction kinetics in 2D.
Micropipette adhesion frequency revealed fast kinetics of the HLA-A2–CD8 interaction on a TCR−/CD8+ cell line (Fig. 3B). The off-rate measured by the thermal fluctuation assay was 17.4 s−1 (Fig. 4B and C). The effective 2D affinity was 1.3×10⁻⁶ μm4 (Fig. 3C). This is the first 2D kinetics measurement for human CD8 (hCD8) interacting with HLA-A2. In comparison, mouse CD8 (mCD8) has 2D affinities of 5.8×10⁻⁶ μm4 and 7.8×10⁻⁷ μm4 for H2-Kb and H2-Db, respectively [40]. The hCD8 2D affinity is more than two orders of magnitude lower than the affinities for the panel of TCRs (Fig. 3C, except for the weakest TCR, W2C8 with an affinity of 5.8×10⁻⁷ μm4), suggesting that the HLA-A2–hCD8 bimolecular interaction by itself contributes little to the gp209-2M:HLA-A2 binding to the TCR+CD8+ cells.
CD8 cooperates with TCR to bind gp209-2M:HLA-A2 synergistically
We asked how the far lower 2D affinity of the gp209-2M:HLA-A2 interaction with hCD8 compared to those with the TCRs (except for W2C8) could explain the dependence of the T-cell responses on hCD8. We recently showed that mCD8 cooperates with TCR to synergistically increase the dual-receptor binding to pMHC [34]. To test whether hCD8 plays a similar role, we used the micropipette to assay contact time-dependent adhesion frequency of RBCs bearing gp209-2M:HLA-A2 to hybridoma cells coexpressing TCR and CD8.
For each of the five TCRs with a higher affinity for gp209-2M:HLA-A2 than CD8, the Pa vs. tc curve followed a two-stage kinetics, exhibiting a low and a high plateau with a transition at ~1 s in between (Supporting Information Fig. 5A–E). These characteristic binding curves are similar to those recently observed in the mouse OT1 and F5 TCRs interacting with their respective agonist ligands [34]. To reveal the respective and the combined contributions of TCR and CD8 to each stage of the binding curve, we calculated the normalized adhesion bonds <n>/mpMHC (Eq. 2, Supporting Information Materials and Methods). For the case of single-receptor interaction, the equilibrium level of <n>/mpMHC equals the effective 2D affinity AcKa times the receptor density, mTCR or mCD8 (cf. Eq. 1, Supporting Information Materials and Methods). For the dual-receptor case, <n>/mpMHC provides a metric for the binding propensity that includes contributions from the TCR–pMHC and pMHC–CD8 bimolecular interactions as well as the TCR–pMHC–CD8 trimolecular interaction [34]. We plotted the contact time-dependent <n>/mpMHC of the dual-receptor interaction (using the data from Supporting Information Fig. 5A–F) in the same graph with those of the two single-receptor interactions (using the data from Fig. 3A, B, and Supporting Information Fig. 2A–E) for each of the six TCRs (Fig. 5). In the first five panels, the two orders of magnitude higher pMHC affinities for the TCRs than CD8 (Fig. 3C) translate to much higher <n>/mpMHC curves for the TCRs than CD8 (Fig. 5A–E, compare green circle with blue triangle), despite the compensation by the significantly higher CD8 densities mCD8 than the TCR densities mTCR (Fig. 1B). Remarkably, the first stage of the dual-receptor curve matches that of the TCR-only curve for each of the first five panels (Fig. 5A–E). Thus, when the hybridoma cells and RBCs make short contacts, there is little contribution to adhesion from the CD8 either by itself or in cooperation with these TCRs. This is further supported by the fact that affinities calculated from the first stage Pa (assuming no CD8 contribution) agree with the TCR–pMHC affinities measured using CD8− cell lines for five of the six TCRs with higher affinities for pMHC than CD8 (Supporting Information Fig. 5G). However, for contacts of pMHC to TCR+CD8+ cells above a threshold duration, CD8 clearly contributed to the dual-receptor curves as their <n>/mpMHC values at the second stage were significantly higher than those of the TCR curves for the first five TCRs (Fig. 5A–E). Because CD8 alone had a negligible binding propensity to pMHC compared to any of these TCRs, the increased <n>/mpMHC at the 2nd stage can only be explained by cooperation or synergy between TCR and CD8 for pMHC binding, or cooperative TCR–pMHC–CD8 trimolecular interaction. We quantify this synergy using Δ(<n>/mpMHC), the difference between the normalized adhesion bonds of the dual-receptor curve and the sum of the normalized adhesion bonds of the two single-receptor curves. The synergy indices Δ(<n>/mpMHC) were zero at contact times smaller than the transition point (~1 s). Beyond the transition from the first to the second stage, the values (at 2 s contact time) for the TCR panel are shown in Fig. 6A together with the <n>/mpMHC values for the two TCR–pMHC and pMHC–CD8 bimolecular interactions. These data show that the cooperative TCR–pMHC–CD8 trimolecular interaction dominates the dual-receptor interaction in the second stage.
Figure 5. Two-stage kinetics of TCR-CD8 dual-receptor interaction with pMHC.

Adhesion frequencies (Pa) were measured for hybridomas interacting with RBCs coupled with gp209-2M:HLA-A2 in a range of contact times. Normalized adhesion bonds (<n>/mpMHC), calculated from <n> = − ln(1 − Pa) divided by the pMHC site density mpMHC (Eq. 2, Supporting Information Materials and Methods), were plotted vs. contact time for different TCRs (A–F). Error bars represent uncertainty based on error propagation from adhesion frequency measurements.
Figure 6. Synergy of TCR and CD8 in pMHC binding and its correlation with 2D affinity.
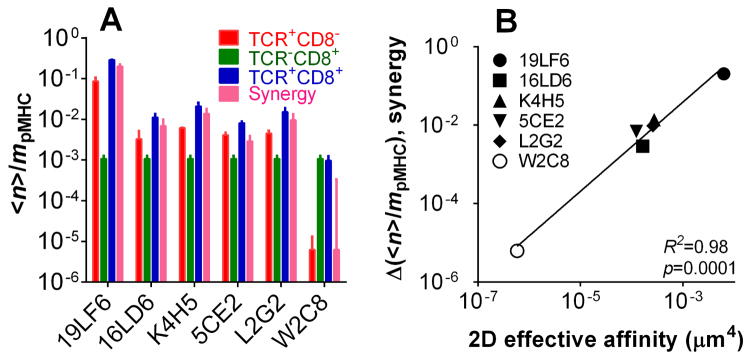
(A) The normalized average number of bonds (<n>/mpMHC) at 2-s contact time of TCR, CD8, or TCR and CD8 interacting with pMHC, or the difference (Δ<n>/mpMHC) between the latter value and the sum of the former two values for the indicated TCRs. Error bars represent uncertainty based on error propagation. (B) Correlation between Δ<n>/mpMHC and the 2D effective affinity of TCR–pMHC bimolecular interaction. The line represents a linear fit with R2 and p values indicated.
The exception in the preceding paragraph is W2C8, the TCR with lowest affinity for gp209-2M:HLA-A2, even lower than that of CD8. Its binding curve measured with the TCR+CD8+ cells shows a single plateau instead of the two-stage pattern (Supporting Information Fig. 5F) with the <n>/mpMHC values indistinguishable from those for the pMHC–CD8 bimolecular interaction but much higher than those for the TCR–pMHC bimolecular interaction (Fig. 5F). The affinity calculated from the plateau Pa agree with the CD8–pMHC affinity measured using TCR−CD8+ cells but is much higher than the TCR–pMHC affinity measured using TCR+CD8− cells, indicating the dominant CD8 contribution to binding of these TCR+CD8+ cells to RBCs bearing gp209-2M:HLA-A2 (Supporting Information Fig. 5G). Because of the lack of TCR–pMHC binding, the synergy index is negligibly small for the W2C8 TCR (Fig. 6A).
Similar to our previous finding [34], the synergy index Δ(<n>/mpMHC) increased with the 2D affinity for the TCR–pMHC interaction (Fig. 6B). Indeed, the linear regression of the Δ(<n>/mpMHC) vs. AcKa log-log plot resulted in an R2 = 0.98 (p = 0.0001), showing a strong correlation between these parameters.
2D kinetics correlates with T-cell function
Having characterized the 2D interactions on hybridoma cells, we next determined the correlation of the 2D kinetic parameters with T-cell function to evaluate whether 2D parameters perform better than their 3D counterparts. The 2D kinetic parameters (affinity, on-rate, off-rate, and <n>/mpMHC; Fig. 7) all showed better correlation with IL-2 secretion than 3D parameters (Fig 2A, D, and Supporting Information Fig. 1B, F, Table 1). Importantly, affinity, on-rate, and <n>/mpMHC all had statistically significant correlation with IL-2 secretion (p values < 0.05) while none of the 3D parameters did. R2 and ρ (Spearman coefficient) statistic and p values for both 2D and 3D parameters are summarized in Supporting Information Table 1. Taken together, these results demonstrate that the 2D kinetic parameters measured in situ under conditions that better mimic physiology match T-cell functions better than 3D parameters [27, 28, 33, 34].
Figure 7. 2D kinetics correlates with T-cell functional responses.

IL-2 secretion for each TCR-expressing cell line was plotted against 2D effective affinity (A), off-rate (B), and effective on-rate (C) of the TCR interaction with pMHC, and <n>/mpMHC of the dual-receptor interaction with pMHC (D). The lines represent linear fits with R2 and p values indicated. In each individual panel, only IL-2 secretion at a representative peptide concentration (8 μM) is shown; comparable results were obtained if using other peptide concentrations (see Materials and methods and Supporting Information Table 1).
Discussion
Several recent studies have shown that the 2D kinetics of the TCR and coreceptor interactions with pMHC differs dramatically from the 3D kinetics and that it better predicts T-cell functional outcomes [27, 28, 33, 34]. However, further study is required to determine whether these observations are general or only apply to isolated cases. Furthermore, detailed 2D vs. 3D characterizations and comparisons have not been carried out for human TCRs specific for self-pMHC, which are usually of lower affinity than pathogen-derived pMHC. Previous studies only analyzed binding of a panel of variant pMHCs to a common TCR. In this study, we analyzed six human melanoma-derived TCRs (Fig. 1A) expressed on hybridoma cells with or without coexpression of human CD8, and directly compared their 2D and 3D kinetics for binding of the common self-ligand gp209-2M:HLA-A2. The results presented here demonstrate that: (1) the mechanical-based 2D techniques are more sensitive than SPR and tetramer staining (Figs. 3C, 4C, 5 in comparison to Supporting Information Figs. 1C, D, 3C); (2) 2D TCR–pMHC affinities and on-rates have much broader dynamic ranges (4 and 5 logs, respectively) than 3D affinities (Supporting Information Fig. 3A) and on-rates (Supporting Information Fig. 3B) (2 and 1 log, respectively) for the panel of TCRs; (3) 2D TCR–pMHC off-rates are much faster than 3D off-rates, and are generally faster for more potent TCRs, whereas the 3D off-rates show a reverse trend (Supporting Information Fig. 3C); (4) although the contribution of the pMHC–CD8 bimolecular interaction to adhesion is limited due to its low affinity (Fig. 3C), CD8 synergistically enhances the binding propensity (as measured by normalized adhesion bonds) over that of the TCR–pMHC bimolecular interaction significantly via a TCR-induced delayed cooperative TCR–pMHC–CD8 trimolecular interaction (Fig. 5A–E); and (5) all of the 2D kinetic parameters (on-rate, off-rate, affinity, and <n>/mpMHC) correlate well with T-cell function as measured by IL-2 secretion (Fig. 7), in sharp contrast to the 3D on-rate and tetramer decay, which show no correlation (Supporting Information Fig. 1B and F), or the 3D affinity and tetramer staining, which show only weak (but insignificant) correlations (Fig. 2A and D). Here, we only analyzed simple models that take a single 3D kinetic parameter (off-rate or affinity) into consideration. Recently, more elaborate models, such as the “total dwell time”[41] or “confinement time” [32, 42] that combine multiple parameters (both on- and off-rates), have been proposed; however, our 3D kinetic data does not seem to be consistent with the model (Supporting Information Fig. 6), further suggesting that 3D based models are not applicable to our system.
A mechanistic understanding of the differences between the 2D and 3D kinetic measurements is a prerequisite for deciphering how these measurements relate to T-cell functions [29, 31, 32]. It is possible that both biophysical and biological factors contribute to the substantial differences between the 2D and 3D kinetics [29, 31, 32]. First, 2D and 3D interactions are physically distinct. The molecular concentration is per unit area (μm−2) in 2D and per volume (M) in 3D. As a result, the 2D KDs are measured in a unit of μm−2 and 3D KDs in unit of M. For 2D binding to occur, two surfaces have to be brought into physical contact, and the interacting partners have to be transported to close proximity and oriented appropriately. By comparison, in 3D binding at least one interacting species is in the fluid phase moving in 3D space with different transport properties. These physical distinctions have important implications to binding kinetics, especially the on-rate. Furthermore, biological factors can also affect 2D kinetics [27, 40]. Membrane-embedded native TCRs can be organized in structures such as TCR microclusters and protein islands [43] to affect bond formation [44–46]. The 2D on-rate, but not off-rate, has been shown to depend on surface microtopology and stiffness [44, 45], which can be regulated by the cell [34]. In addition, SPR experiments assume that soluble TCRs possess the same structural determinants of ligand–binding kinetics, including any induced conformational changes upon ligand binding, as do native TCRs on the cell membrane. This assumption has not been tested and may be invalid. Indeed, our studies on Fcγreceptors and selectins have shown that membrane anchor, length, orientation, glycosylation, and sulfation of receptors on the cell surface can significantly impact their ligand binding kinetics in both 2D and 3D [44–46] (Jiang, N. et al., 2013, submitted for publication). Further studies are required to resolve this important yet complicated issue.
Our in situ 2D off-rate measurements showed much accelerated TCR–pMHC bond dissociation, consistent with previous 2D results [27, 28]. Huppa et al. postulated that the fast 2D off-rates were due to actin polymerization-driven forces applied on TCR–pMHC bonds. In their FRET-based method, kinetics was measured in the immunological synapse (IS) formed between a T-cell and a supported lipid bilayer (SLB) where adhesion was contributed not only by TCR–pMHC interaction but also by ligand binding of integrins and costimulatory molecules. The synapse is an actively maintained structure induced by TCR–pMHC engagement-mediated signaling. Therefore, the binding characteristics measured could be a combination of intrinsic TCR–pMHC bond property and effects from active T cell triggering. However, as mechanical force was not monitored in the assay, it is difficult to assess whether force indeed played a definite role in their measurements.
With respect to our mechanical-based 2D assays, multiple lines of evidence argue against a role of T-cell triggering or active forces generated thereof as a major cause of the great disparity of 2D-3D off-rates. Firstly, data from the OT1 system using recombinant TCR, where no triggering is present, shows that 2D off-rate for agonist is even faster than that of native TCR on the cell surface (Liu, B. et al., unpublished data). Secondly, all the TCRs in the current study showed fast kinetics, reaching adhesion plateau from the shortest contact time of 0.1 s. The fact that the adhesion did not increase further in longer contact times suggests that factors contributing to the adhesion did not change significantly over the time scale of our 2D measurement. Thus, should signaling have occurred, it was within 0.1 s, which, to the best of our knowledge, is faster than any documented T-cell signaling events. Thirdly, in our 2D assays, off-rate measurement was performed at zero force condition. As we elaborated previously [27, 37], in the adhesion frequency assay, the stretch at the end of each contact is merely a means of detecting whether a bond was present at the very end of the contact; the binary readout (bond or no bond) but not bond duration are analyzed with a mathematical model to derive the off-rate. In the thermal fluctuation assay, more direct evidence is available for the zero force condition because we quantitatively monitor the force (by tracking the position of the BFP probe bead). If any cellular processes impose forces significantly deviate from zero on individual TCR–pMHC bonds, we should have observed them (the BFP has a ~1 pN force resolution). Fourth, the surface density of pMHC is carefully controlled such that, at any moment of contact, the majority of adhesion events are mediated by a single bond [37]. Therefore, although we cannot rule out a possible role of T-cell signaling, these factors would favor the proposition that 2D TCR–pMHC off-rate most likely reflects an intrinsic property of the native TCR in the cell membrane.
One intriguing property of 2D off-rate (or bond lifetime) for the gp100 system is that higher potency corresponds to a faster off-rate (thus shorter bond lifetime), which was also observed in the OT1 [27], 42F3 [33], and 2B4 and 5C. C7 [28] TCR-systems. However, higher potency interactions have much higher on-rates. Evaluation based on both on-rates and off-rates is actually consistent with the serial engagement model [27] and the total confinement time model [42]. Take 19LF6 TCR as an example. The measured on-rate (Ackon) is 0.072 μm4s−1 and off-rate (koff) is 11.4 s−1. For typical surface densities of 15 TCR/μm2 (mTCR)and 6 pMHC/μm2 (mpMHC) on a T cell and a RBC respectively, it takes on average 0.15 s (1/(Ackon×mTCR×mpMHC)) for a new TCR–pMHC bond to form and 0.088 s (1/koff) to dissociate. Therefore, in every minute of contact, a series of ~250 TCR–pMHC bonds would have formed to accumulate for a cumulative ~22 s bond lifetime. In contrast, for the W2C8 TCR with an Ackon of 2.1×10⁻⁶ μm4s−1 and a koff of 3.6 s−1, to achieve a similar amount of cumulative lifetime, it would require a pMHC surface density of more than 50,000/μm2 despite a slower off-rate (and a longer lifetime). Therefore, the apparently faster 2D off-rates of more potent interactions can be effectively compensated by greatly boosted 2D on-rates in terms of total confinement time as a result of fast serial TCR–pMHC engagement.
It is well known that CD8/CD4 coreceptors greatly enhance T-cell responses to antigen stimulation [11, 34, 47]. However, the underlying mechanism is unclear. It has been proposed that CD8 binds to the same pMHC engaged with TCR to stabilize the TCR–pMHC interaction [47] and that coreceptors (especially CD4) contribute to T-cell function by catalyzing the recruitment of Lck [47, 48]. SPR work using purified molecules reported discrepant results; some showed that CD8 enhances the TCR–pMHC interaction by reducing the off-rate [49] whereas others showed that TCR binds to pMHC independent of CD8[50]. However, the work presented here and previous work by others [8, 51] demonstrated that CD8 significantly enhances pMHC tetramer staining of T cells. Tetramer technology is limited by low temporal resolution, low sensitivity, and difficulty to relate to intrinsic kinetic parameters [25]. Using the micropipette adhesion frequency method with much higher sensitivity and temporal resolution, we have recently shown that in the OT1 and F5 TCR transgenic mouse systems, surrogate APCs adhere to naïve T cells in a two-stage fashion [34]. The first-stage (< 1 s contact time) is dominated by the TCR–pMHC interaction and the second-stage (> 1-s contact time) includes a significant CD8-dependent adhesion increase. The second-stage adhesion increment results from cooperative TCR–pMHC–CD8 trimeric interaction that requires cell signaling via Src kinases. In this study, we have shown that this is a shared feature of the CD8+ hybridoma cells transfected with human TCRs. However, in the gp209 system, the synergy indices Δ(<n>/mpMHC) are much higher than what we previously observed, e.g., 0.2 μm2 (Fig. 6) and 0.023 μm2 [34] for the strongest interactions in this (19LF6) and the previous (OVA) studies, respectively. Interestingly, the much higher synergy indices correlate with the ~10-fold higher levels of CD8 than the gp209-specific TCRs expressed on the hybridoma cells (Fig. 1B). By comparison, the naïve T cells used in the previous study express ~2-fold higher CD8 than OT1 TCR [34]. This suggests that the higher the CD8:TCR ratio, the greater the synergy.
This study represents the first 2D kinetic analysis of recognition of a self-antigen by a panel of TCRs, which also differs from previous 2D kinetics studies using a single TCR to interact with a panel of variant pMHC ligands. The similarity of observations in our study to previous studies [27, 34] further support 2D kinetics as a reliable predictor of T-cell function.
Our data have important implications in tumor immunology. The previous practice of choosing TCR candidates for tumor immunotherapy was mainly based on 3D affinity [52, 53], which, as we have shown here, can be problematic. Since 2D kinetics is more physiologically relevant and better predicts T-cell function, it would seem more appropriate to choose (engineered or cloned) TCRs based on 2D kinetic parameters in order for immunotherapy to achieve better therapeutic benefits.
Materials and methods
Cells and Cell Cultures
58 α-/β-hybridoma cell line (a generous gift from Dr. David Kranz, University of Illinois at Urbana Champaign) and T2 cells (ATCC) were cultured in RPMI media supplemented with 10% fetal bovine serum (FBS), Glutamax™-I, sodium pyruvate, non-essential amino acids and penicillin-streptomycin (all from Invitrogen). The parental cell line was transduced by full-length human CD8 α and β genes, TCR genes, or both as previously described [54] (see Supporting Information Materials and Methods). Human red blood cells (RBCs) were purified from peripheral blood of healthy volunteers according to a protocol approved by the Institutional Review Board of The Georgia Institute of Technology [40].
Coating of pMHC on RBCs and Glass Beads
Soluble biotin tagged gp209-2M:HLA-A2 MHC molecules were produced as previously described [55] (see Supporting Information Materials and Methods). gp209-2M:HLA-A2 was coated on RBCs and glass beads via biotin-streptavidin chemistry according to published protocols [27].
Protein Surface Density Quantification
Surface densities of gp209-2M:HLA-A2 on RBCs and beads as well as TCR and CD8 on hybridoma cells were quantified with flow cytometry [37] using PE-conjugated antibodies and standard beads. The antibodies were anti-mouse TCRβ (clone H57-597, BD Bioscience), anti-human CD8α (clone HIT8a, eBiosciences), and anti-human HLA-A2 (clone BB7.2, BD Bioscience). The standard beads were BD Quantibrite™ PE Beads.
Tetramer Staining and Tetramer Decay
Cells were incubated with gp209-2M:HLA-A2 tetramer for 2 hours at room temperature in FACS buffer (5% FBS, 1× PBS) with 0.2% fresh sodium azide. After incubation, cells were washed three times in FACS buffer, transferred into PCR tubes and cooled down to 4 °C on a PCR machine. Tetramer decay was initiated by adding a saturating amount of anti-HLA-A2 antibody (clone BB7.2, GeneTex, 50 μg/ml). At various time points, an aliquot of cells was fixed in 4% paraformaldehyde (Electron Microscopy Sciences) in a V-bottom 96-well plate. A control experiment was performed at the same time where no anti-HLA-A2 antibody was added. The samples were analyzed on a LSR II Flow Cytometer equipped with a plate reader (BD Biosciences). The data were gated for live cells based on front and side scattering and plotted as MFI (mean fluorescent intensity) vs. time and fitted with a single exponential decay function in OriginPro (OriginLab).
Cytokine ELISA
1×10⁵ hybridoma cells expressing gp209-specific TCRs and 1×10⁵ T2 cells were mixed in a 96-well U-bottom plate with various concentrations of gp209-2M peptide in a total volume of 200 μl for each well and incubated overnight at 37 °C, 5% CO2. IL-2 production was quantified by standard sandwich ELISA. Antibody pairs (anti-mouse IL-2/biotinylated anti-mouse IL-2) and IL-2 standards were from eBioscience. Streptavidin-HRP was from BD Biosciences and tetramethylbenzidine ELISA substrate was from Sigma.
Micropipette Adhesion Frequency Assay and Thermal Fluctuation Assay
The 2D effective affinity and the average number of bonds/pMHC density (<n>/mpMHC) were measured with micropipette adhesion frequency assay at room temperature [34]. The 2D off-rates of TCR–pMHC and pMHC–CD8 bonds were measured by thermal fluctuation assay with a biomembrane force probe (BFP) at room temperature [38]. Detailed procedures are described in Supporting Information Materials and Methods.
Correlation analysis of T cell IL-2 response with kinetic attributes
As cytokine production for the majority of TCRs did not exhibit the typical sigmoidal dose-response characteristic (Fig. 1C), the peptide concentration to reach half maximal response (EC50) could not be reliably derived to quantify activation potency. Instead, we used IL-2 production at individual peptide concentrations as a measure for activation potency. Briefly, for each of the peptide concentrations that generated appreciable IL-2 (0.2, 2.0, 4.0, 8.0, 16.0, 64.0, and 128.0 μM), we plotted the corresponding IL-2 level for each of the TCRs against each of the eight individual binding parameters (3D affinity, 3D on-rate, tetramer decay rate, tetramer staining MFI, 2D effective affinity, 2D off-rate, 2D effective on-rate, and <n>/mpMHC) on a double-log graph and fitted the data using linear regression analysis. The quality of fitting was evaluated with R2 statistic and p value. The p value was used to test the null hypothesis that the slope of the linear regression was different from zero; a p value of < 0.05 was deemed statistically significant. Correlation results for activation potency versus individual binding parameters at a representative peptide concentration of 8.0 μM are shown in Figures for 3D affinity (Fig. 2A), 3D on-rate (Supporting Information Fig. 1B), tetramer decay rate (Supporting Information Fig. 1F), tetramer staining MFI (Fig. 2D), 2D effective affinity (Fig. 7A), 2D off-rate (Fig. 7B), 2D effective on-rate (Fig. 7C), and <n>/mpMHC (Fig. 7D). Results obtained at other peptide concentrations analyzed are comparable and summarized in Supporting Information Table 1. We also used an alternative set of statistic – Spearman coefficients ρ and corresponding p value – to evaluate fitting quality. Results for the representative peptide concentration of 8.0 μM are shown in Supporting Information Table 1.
Supplementary Material
Acknowledgments
We thank New York University and Georgia Institute of Technology flow cytometry cores for technical assistance. We thank Dr. David Kranz and Dr. Michael Dustin for providing cell lines and plasmids, Katelyn McGary and Kevin Huang for assistance in soluble protein productions, and Dr. Jeffrey Donnell for critical reading of the manuscript. M.K. was a Pew Scholar in the Biomedical Sciences supported by the Pew Trust. This work was supported by the National Institute of Health grants NCI 1U01CA137070 and NIGMS 5R01GM085586 (to M.K.) and R01GM096187 and R56AI038282 (to C.Z.), an American Cancer Society Research Scholar grant RSG-09-070-01-LIB (to M.K), and a Cancer Research Investigator grant (to M.K.).
Footnotes
Conflict of interest: The authors declare no financial or commercial conflict of interest.
References
- 1.Smith-Garvin JE, Koretzky GA, Jordan MS. T cell activation. Annu Rev Immunol. 2009;27:591–619. doi: 10.1146/annurev.immunol.021908.132706. [DOI] [PMC free article] [PubMed] [Google Scholar]
- 2.Krogsgaard M, Davis MM. How T cells ‘see’ antigen. Nat Immunol. 2005;6:239–245. doi: 10.1038/ni1173. [DOI] [PubMed] [Google Scholar]
- 3.Holler PD, Kranz DM. Quantitative analysis of the contribution of TCR/pepMHC affinity and CD8 to T cell activation. Immunity. 2003;18:255–264. doi: 10.1016/s1074-7613(03)00019-0. [DOI] [PubMed] [Google Scholar]
- 4.Stone JD, Chervin AS, Kranz DM. T-cell receptor binding affinities and kinetics: impact on T-cell activity and specificity. Immunology. 2009;126:165–176. doi: 10.1111/j.1365-2567.2008.03015.x. [DOI] [PMC free article] [PubMed] [Google Scholar]
- 5.Krogsgaard M, Prado N, Adams EJ, He XL, Chow DC, Wilson DB, et al. Evidence that structural rearrangements and/or flexibility during TCR binding can contribute to T cell activation. Mol Cell. 2003;12:1367–1378. doi: 10.1016/s1097-2765(03)00474-x. [DOI] [PubMed] [Google Scholar]
- 6.Alam SM, Travers PJ, Wung JL, Nasholds W, Redpath S, Jameson SC, Gascoigne NR. T-cell-receptor affinity and thymocyte positive selection. Nature. 1996;381:616–620. doi: 10.1038/381616a0. [DOI] [PubMed] [Google Scholar]
- 7.Lyons DS, Lieberman SA, Hampl J, Boniface JJ, Chien Y, Berg LJ, Davis MM. A TCR binds to antagonist ligands with lower affinities and faster dissociation rates than to agonists. Immunity. 1996;5:53–61. doi: 10.1016/s1074-7613(00)80309-x. [DOI] [PubMed] [Google Scholar]
- 8.Laugel B, van den Berg HA, Gostick E, Cole DK, Wooldridge L, Boulter J, et al. Different T cell receptor affinity thresholds and CD8 coreceptor dependence govern cytotoxic T lymphocyte activation and tetramer binding properties. J Biol Chem. 2007;282:23799–23810. doi: 10.1074/jbc.M700976200. [DOI] [PubMed] [Google Scholar]
- 9.Minguet S, Swamy M, Alarcon B, Luescher IF, Schamel WW. Full activation of the T cell receptor requires both clustering and conformational changes at CD3. Immunity. 2007;26:43–54. doi: 10.1016/j.immuni.2006.10.019. [DOI] [PubMed] [Google Scholar]
- 10.Boniface JJ, Rabinowitz JD, Wulfing C, Hampl J, Reich Z, Altman JD, et al. Initiation of signal transduction through the T cell receptor requires the multivalent engagement of peptide/MHC ligands [corrected] Immunity. 1998;9:459–466. doi: 10.1016/s1074-7613(00)80629-9. [DOI] [PubMed] [Google Scholar]
- 11.Krogsgaard M, Li QJ, Sumen C, Huppa JB, Huse M, Davis MM. Agonist/endogenous peptide-MHC heterodimers drive T cell activation and sensitivity. Nature. 2005;434:238–243. doi: 10.1038/nature03391. [DOI] [PubMed] [Google Scholar]
- 12.Gascoigne NR, Zal T, Alam SM. T-cell receptor binding kinetics in T-cell development and activation. Expert Rev Mol Med. 2001;2001:1–17. doi: 10.1017/S1462399401002502. [DOI] [PubMed] [Google Scholar]
- 13.Rabinowitz JD, Beeson C, Lyons DS, Davis MM, McConnell HM. Kinetic discrimination in T-cell activation. Proc Natl Acad Sci USA. 1996;93:1401–1405. doi: 10.1073/pnas.93.4.1401. [DOI] [PMC free article] [PubMed] [Google Scholar]
- 14.van der Merwe PA. The TCR triggering puzzle. Immunity. 2001;14:665–668. doi: 10.1016/s1074-7613(01)00155-8. [DOI] [PubMed] [Google Scholar]
- 15.Rudolph MG, Wilson IA. The specificity of TCR/pMHC interaction. Curr Opin Immunol. 2002;14:52–65. doi: 10.1016/s0952-7915(01)00298-9. [DOI] [PubMed] [Google Scholar]
- 16.Rosette C, Werlen G, Daniels MA, Holman PO, Alam SM, Travers PJ, et al. The impact of duration versus extent of TCR occupancy on T cell activation: a revision of the kinetic proofreading model. Immunity. 2001;15:59–70. doi: 10.1016/s1074-7613(01)00173-x. [DOI] [PubMed] [Google Scholar]
- 17.Tian S, Maile R, Collins EJ, Frelinger JA. CD8+ T cell activation is governed by TCR-peptide/MHC affinity, not dissociation rate. J Immunol. 2007;179:2952–2960. doi: 10.4049/jimmunol.179.5.2952. [DOI] [PubMed] [Google Scholar]
- 18.Zehn D, Lee SY, Bevan MJ. Complete but curtailed T-cell response to very low-affinity antigen. Nature. 2009;458:211–214. doi: 10.1038/nature07657. [DOI] [PMC free article] [PubMed] [Google Scholar]
- 19.Schmid DA, Irving MB, Posevitz V, Hebeisen M, Posevitz-Fejfar A, Sarria JC, et al. Evidence for a TCR affinity threshold delimiting maximal CD8 T cell function. J Immunol. 2010;184:4936–4946. doi: 10.4049/jimmunol.1000173. [DOI] [PubMed] [Google Scholar]
- 20.McMahan RH, McWilliams JA, Jordan KR, Dow SW, Wilson DB, Slansky JE. Relating TCR-peptide-MHC affinity to immunogenicity for the design of tumor vaccines. J Clin Invest. 2006;116:2543–2551. doi: 10.1172/JCI26936. [DOI] [PMC free article] [PubMed] [Google Scholar]
- 21.Irving M, Zoete V, Hebeisen M, Schmid D, Baumgartner P, Guillaume P, et al. Interplay between T cell receptor binding kinetics and the level of cognate peptide presented by major histocompatibility complexes governs CD8+ T cell responsiveness. J Biol Chem. 2012;287:23068–23078. doi: 10.1074/jbc.M112.357673. [DOI] [PMC free article] [PubMed] [Google Scholar]
- 22.Corse E, Gottschalk RA, Krogsgaard M, Allison JP. Attenuated T cell responses to a high-potency ligand in vivo. PLoS Biol. 2010:8. doi: 10.1371/journal.pbio.1000481. [DOI] [PMC free article] [PubMed] [Google Scholar]
- 23.Dushek O, Aleksic M, Wheeler RJ, Zhang H, Cordoba SP, Peng YC, et al. Antigen potency and maximal efficacy reveal a mechanism of efficient T cell activation. Sci Signal. 2011;4:ra39. doi: 10.1126/scisignal.2001430. [DOI] [PMC free article] [PubMed] [Google Scholar]
- 24.Savage PA, Boniface JJ, Davis MM. A kinetic basis for T cell receptor repertoire selection during an immune response. Immunity. 1999;10:485–492. doi: 10.1016/s1074-7613(00)80048-5. [DOI] [PubMed] [Google Scholar]
- 25.Wang XL, Altman JD. Caveats in the design of MHC class I tetramer/antigen-specific T lymphocytes dissociation assays. J Immunol Methods. 2003;280:25–35. doi: 10.1016/s0022-1759(03)00079-6. [DOI] [PubMed] [Google Scholar]
- 26.Sabatino JJ, Jr, Huang J, Zhu C, Evavold BD. High prevalence of low affinity peptide-MHC II tetramer-negative effectors during polyclonal CD4+ T cell responses. J Exp Med. 2011;208:81–90. doi: 10.1084/jem.20101574. [DOI] [PMC free article] [PubMed] [Google Scholar]
- 27.Huang J, Zarnitsyna VI, Liu B, Edwards LJ, Jiang N, Evavold BD, Zhu C. The kinetics of two-dimensional TCR and pMHC interactions determine T-cell responsiveness. Nature. 2010;464:932–936. doi: 10.1038/nature08944. [DOI] [PMC free article] [PubMed] [Google Scholar]
- 28.Huppa JB, Axmann M, Mortelmaier MA, Lillemeier BF, Newell EW, Brameshuber M, et al. TCR-peptide-MHC interactions in situ show accelerated kinetics and increased affinity. Nature. 2010;463:963–967. doi: 10.1038/nature08746. [DOI] [PMC free article] [PubMed] [Google Scholar]
- 29.Edwards LJ, Zarnitsyna VI, Hood JD, Evavold BD, Zhu C. Insights into T cell recognition of antigen: significance of two-dimensional kinetic parameters. Front Immunol. 2012;3:86. doi: 10.3389/fimmu.2012.00086. [DOI] [PMC free article] [PubMed] [Google Scholar]
- 30.Zhu C, Jiang N, Huang J, Zarnitsyna VI, Evavold BD. Insights from in situ analysis of TCR-pMHC recognition: response of an interaction network. Immunol Rev. 2013;251:49–64. doi: 10.1111/imr.12016. [DOI] [PMC free article] [PubMed] [Google Scholar]
- 31.Huang J, Meyer C, Zhu C. T cell antigen recognition at the cell membrane. Mol Immunol. 2012;52:155–164. doi: 10.1016/j.molimm.2012.05.004. [DOI] [PMC free article] [PubMed] [Google Scholar]
- 32.Zarnitsyna V, Zhu C. T cell triggering: insights from 2D kinetics analysis of molecular interactions. Phys Biol. 2012;9:045005. doi: 10.1088/1478-3975/9/4/045005. [DOI] [PubMed] [Google Scholar]
- 33.Adams, Jarrett J, Narayanan S, Liu B, Birnbaum, Michael E, Kruse, Andrew C, Bowerman, Natalie A, et al. T cell receptor signaling is limited by docking geometry to peptide-major histocompatibility complex. Immunity. 2011;35:681–693. doi: 10.1016/j.immuni.2011.09.013. [DOI] [PMC free article] [PubMed] [Google Scholar]
- 34.Jiang N, Huang J, Edwards LJ, Liu B, Zhang Y, Beal CD, et al. Two-stage cooperative T cell receptor-peptide major histocompatibility complex-CD8 trimolecular interactions amplify antigen discrimination. Immunity. 2011;34:13–23. doi: 10.1016/j.immuni.2010.12.017. [DOI] [PMC free article] [PubMed] [Google Scholar]
- 35.Parkhurst MR, Salgaller ML, Southwood S, Robbins PF, Sette A, Rosenberg SA, Kawakami Y. Improved induction of melanoma-reactive CTL with peptides from the melanoma antigen gp100 modified at HLA-A*0201-binding residues. J Immunol. 1996;157:2539–2548. [PubMed] [Google Scholar]
- 36.Zhong S, Malecek K, Johnson LA, Yu Z, Vega-Saenz de Miera E, Darvishian F, et al. T-cell receptor affinity and avidity defines antitumor response and autoimmunity in T-cell immunotherapy. Proc Natl Acad Sci USA. 2013;110:6973–6978. doi: 10.1073/pnas.1221609110. [DOI] [PMC free article] [PubMed] [Google Scholar]
- 37.Chesla SE, Selvaraj P, Zhu C. Measuring two-dimensional receptor-ligand binding kinetics by micropipette. Biophys J. 1998;75:1553–1572. doi: 10.1016/S0006-3495(98)74074-3. [DOI] [PMC free article] [PubMed] [Google Scholar]
- 38.Chen W, Evans EA, McEver RP, Zhu C. Monitoring Receptor-Ligand Interactions between Surfaces by Thermal Fluctuations. Biophys J. 2008;94:694–701. doi: 10.1529/biophysj.107.117895. [DOI] [PMC free article] [PubMed] [Google Scholar]
- 39.Marshall BT, Long M, Piper JW, Yago T, McEver RP, Zhu C. Direct observation of catch bonds involving cell-adhesion molecules. Nature. 2003;423:190–193. doi: 10.1038/nature01605. [DOI] [PubMed] [Google Scholar]
- 40.Huang J, Edwards LJ, Evavold BD, Zhu C. Kinetics of MHC-CD8 interaction at the T cell membrane. J Immunol. 2007;179:7653–7662. doi: 10.4049/jimmunol.179.11.7653. [DOI] [PubMed] [Google Scholar]
- 41.Govern CC, Paczosa MK, Chakraborty AK, Huseby ES. Fast on-rates allow short dwell time ligands to activate T cells. Proc Natl Acad Sci USA. 2010;107:8724–8729. doi: 10.1073/pnas.1000966107. [DOI] [PMC free article] [PubMed] [Google Scholar]
- 42.Aleksic M, Dushek O, Zhang H, Shenderov E, Chen JL, Cerundolo V, et al. Dependence of T cell antigen recognition on T cell receptor-peptide MHC confinement time. Immunity. 2010;32:163–174. doi: 10.1016/j.immuni.2009.11.013. [DOI] [PMC free article] [PubMed] [Google Scholar]
- 43.Lillemeier BF, Mortelmaier MA, Forstner MB, Huppa JB, Groves JT, Davis MM. TCR and Lat are expressed on separate protein islands on T cell membranes and concatenate during activation. Nat Immunol. 2010;11:90–96. doi: 10.1038/ni.1832. [DOI] [PMC free article] [PubMed] [Google Scholar]
- 44.Williams TE, Nagarajan S, Selvaraj P, Zhu C. Quantifying the impact of membrane microtopology on effective two-dimensional affinity. J Biol Chem. 2001;276:13283–13288. doi: 10.1074/jbc.M010427200. [DOI] [PubMed] [Google Scholar]
- 45.Wu L, Xiao B, Jia X, Zhang Y, Lu S, Chen J, Long M. Impact of carrier stiffness and microtopology on two-dimensional kinetics of P-selectin and P-selectin glycoprotein ligand-1 (PSGL-1) interactions. J Biol Chem. 2007;282:9846–9854. doi: 10.1074/jbc.M609219200. [DOI] [PubMed] [Google Scholar]
- 46.Huang J, Chen J, Chesla SE, Yago T, Mehta P, McEver RP, et al. Quantifying the effects of molecular orientation and length on two-dimensional receptor-ligand binding kinetics. J Biol Chem. 2004;279:44915–44923. doi: 10.1074/jbc.M407039200. [DOI] [PubMed] [Google Scholar]
- 47.Artyomov MN, Lis M, Devadas S, Davis MM, Chakraborty AK. CD4 and CD8 binding to MHC molecules primarily acts to enhance Lck delivery. Proc Natl Acad Sci USA. 2010;107:16916–16921. doi: 10.1073/pnas.1010568107. [DOI] [PMC free article] [PubMed] [Google Scholar]
- 48.Li QJ, Dinner AR, Qi S, Irvine DJ, Huppa JB, Davis MM, Chakraborty AK. CD4 enhances T cell sensitivity to antigen by coordinating Lck accumulation at the immunological synapse. Nat Immunol. 2004;5:791–799. doi: 10.1038/ni1095. [DOI] [PubMed] [Google Scholar]
- 49.Garcia KC, Scott CA, Brunmark A, Carbone FR, Peterson PA, Wilson IA, Teyton L. CD8 enhances formation of stable T-cell receptor/MHC class I molecule complexes. Nature. 1996;384:577–581. doi: 10.1038/384577a0. [DOI] [PubMed] [Google Scholar]
- 50.Wyer JR, Willcox BE, Gao GF, Gerth UC, Davis SJ, Bell JI, et al. T Cell Receptor and Coreceptor CD8±± Bind Peptide-MHC Independently and with Distinct Kinetics. Immunity. 1999;10:219–225. doi: 10.1016/s1074-7613(00)80022-9. [DOI] [PubMed] [Google Scholar]
- 51.Wooldridge L, van den Berg HA, Glick M, Gostick E, Laugel B, Hutchinson SL, et al. Interaction between the CD8 coreceptor and major histocompatibility complex class I stabilizes T cell receptor-antigen complexes at the cell surface. J Biol Chem. 2005;280:27491–27501. doi: 10.1074/jbc.M500555200. [DOI] [PMC free article] [PubMed] [Google Scholar]
- 52.Engels B, Chervin AS, Sant AJ, Kranz DM, Schreiber H. Long-term persistence of CD4+ but rapid disappearance of CD8+ T Cells expressing an MHC class I-restricted TCR of nanomolar affinity. Mol Ther. 2012;20:652–660. doi: 10.1038/mt.2011.286. [DOI] [PMC free article] [PubMed] [Google Scholar]
- 53.Merhavi-Shoham E, Haga-Friedman A, Cohen CJ. Genetically modulating T-cell function to target cancer. Sem Cancer Biol. 2012;22:14–22. doi: 10.1016/j.semcancer.2011.12.006. [DOI] [PubMed] [Google Scholar]
- 54.Zhong S, Malecek K, Perez-Garcia A, Krogsgaard M. Retroviral transduction of T-cell receptors in mouse T-cells. J Vis Exp. 2010 doi: 10.3791/2307. [DOI] [PMC free article] [PubMed] [Google Scholar]
- 55.Malecek K, Zhong S, McGary K, Yu C, Huang K, Johnson LA, et al. Engineering improved T cell receptors using an alanine-scan guided T cell display selection system. J Immunol Methods. 2013;392:1–11. doi: 10.1016/j.jim.2013.02.018. [DOI] [PMC free article] [PubMed] [Google Scholar]
Associated Data
This section collects any data citations, data availability statements, or supplementary materials included in this article.