

Abstract
Despite the greater functional importance of protein levels, our knowledge of gene expression evolution is based almost entirely on studies of mRNA levels. In contrast, our understanding of how translational regulation evolves has lagged far behind. Here we have applied ribosome profiling—which measures both global mRNA levels and their translation rates—to two species of Saccharomyces yeast and their interspecific hybrid in order to assess the relative contributions of changes in mRNA abundance and translation to regulatory evolution. We report that both cis- and trans-acting regulatory divergence in translation are abundant, affecting at least 35% of genes. The majority of translational divergence acts to buffer changes in mRNA abundance, suggesting a widespread role for stabilizing selection acting across regulatory levels. Nevertheless, we observe evidence of lineage-specific selection acting on several yeast functional modules, including instances of reinforcing selection acting at both levels of regulation. Finally, we also uncover multiple instances of stop-codon readthrough that are conserved between species. Our analysis reveals the underappreciated complexity of post-transcriptional regulatory divergence and indicates that partitioning the search for the locus of selection into the binary categories of “coding” versus “regulatory” may overlook a significant source of selection, acting at multiple regulatory levels along the path from genotype to phenotype.
Almost four decades ago, it was argued that coding sequence changes were insufficient to explain the morphological divergence between humans and chimpanzees, suggesting that changes in gene expression regulation may have played a dominant role (King and Wilson 1975). More recently, a major focus of modern evolutionary genetics has been to understand the molecular basis of regulatory variation within and between species (Carroll 2005; Rockman and Kruglyak 2006). In almost all instances, however, “regulatory variation” has been used synonymously with “differences in mRNA levels”—despite decades of research indicating that post-transcriptional regulation is essential (Day and Tuite 1998). Developments in quantitative proteomics have uncovered patterns of divergence at the level of the proteome both within and between species, and a unifying observation has been that mRNA abundance is an imprecise proxy of protein abundance (e.g., de Sousa Abreu et al. 2009; Khan et al. 2012; Skelly et al. 2013; Wu et al. 2013). Indeed, when the contributions of mRNA abundance were accounted for, these studies found that protein levels were independent, heritable phenotypes, confirming that regulatory evolution beyond the level of mRNA is common. Nevertheless, the relatively low power and high cost of these approaches have limited their use in dissecting the molecular bases of regulatory variation between closely related species. This has encouraged a focus on mRNA levels—aided by the availability of high-throughput transcriptional profiling methods (e.g., microarrays and RNA-seq)—which has left many fundamental questions about the evolution of translational dynamics unanswered.
It has long been known that natural selection generates synonymous codon usage bias (CUB) in favor of codons represented by the most abundant tRNAs (Ikemura 1982; Plotkin and Kudla 2011), perhaps to enhance the speed and/or accuracy of protein translation (Akashi 2003). Both intra- and interspecies comparative studies have found that purifying selection appears to be the dominant mode of evolution acting at the level of CUB (Drummond and Wilke 2008; Zhou et al. 2010; Waldman et al. 2011). Nevertheless, potentially adaptive changes have been observed, such as an increase in CUB among cytosolic ribosomal proteins and glycolytic enzymes in anaerobic yeasts, coinciding with their shift to primarily fermentative growth (Man and Pilpel 2007). While these studies highlight the action of natural selection beyond the transcriptional level, the effect of CUB on translation is still actively debated (Ingolia et al. 2011; Tuller et al. 2011; Qian et al. 2012; Charneski and Hurst 2013), making the biological significance of such findings difficult to interpret.
Encouragingly, a wealth of insight about translational regulation has surfaced via the application of a new method enabling the measurement of protein translation rates of the coding transcriptome (Ingolia et al. 2009; Ingolia 2010). Termed “ribosome profiling” (or riboprofiling), it involves isolating and sequencing short fragments of mRNA bound by actively translating ribosomes and provides quantitative information about the translational states of all transcripts. Riboprofiling has revealed that relative translational rates vary across the transcriptome by ∼100-fold in the budding yeast Saccharomyces cerevisiae, contributing substantially to the dynamic range of expression (Ingolia et al. 2009). Furthermore, the translation of individual genes can be modulated in response to external conditions such as nutrient starvation or meiosis (Ingolia et al. 2009; Brar et al. 2012). Therefore, abundant opportunity exists for regulatory variation in translational efficiency; however, how this evolves within and between species remains unknown.
Both transcriptional and translational regulation can diverge via changes in cis-regulatory elements (CREs), or through changes affecting the trans-acting regulatory factors that bind these elements. The relative contributions of each mechanism to divergence can be dissected via measurement of individual allelic expression levels in interspecific hybrids (Wittkopp 2005; Müller and Nieduszynski 2012). The common trans environment shared by the two alleles in hybrids means that any differences in allele-specific expression (ASE) must reflect changes in CREs. The fraction of expression divergence not attributable to ASE is therefore the result of changes in trans-acting factors (in the absence of epistatic cis × trans interactions). Although much more is known about transcriptional CREs (see Wittkopp and Kalay 2011), similar cis-acting mechanisms regulate the rate of translation (Gebauer and Hentze 2004). A recent study measuring protein levels in yeast hybrids using mass spectrometry found both cis- and trans-acting effects, but with divergence detected at fewer than 100 genes (Khan et al. 2012), it is difficult to extend these conclusions to the whole transcriptome.
Because changes in CRE activities can be highly temporally and spatially specific—in contrast to amino acid changes that typically alter a protein everywhere it is expressed—it has been suggested that regulatory adaptation may primarily occur through changes in cis-regulation (Carroll 2005; Lemos et al. 2008). However, identifying those regulatory changes that have occurred due to the action of selection has traditionally proven to be challenging (Barrett and Hoekstra 2011; Fraser 2011). Several studies have applied methods to detect accelerated expression divergence in large-scale data sets (e.g., Rifkin et al. 2003, Gilad et al. 2006); however, detecting selection has not been possible in the absence of an accurate null model of neutral divergence in gene expression. More recently, a novel approach to identifying instances of selection on gene expression was introduced and takes advantage of the observation that most phenotypes are polygenic—resulting from the action of multiple functionally related genes (Weiss 2008). Significant bias in the directionality of ASE in a hybrid (favoring one parent's alleles) among multiple members of a functionally related group of genes indicates that multiple coordinated cis-acting mutations have occurred and is evidence of selection acting in a lineage-specific manner (Bullard et al. 2010; Fraser et al. 2010; Fraser 2011). Analysis of ASE in hybrids has been used to identify hundreds of genes subject to lineage-specific selection, including several complexes and pathways in domesticated yeasts (Bullard et al. 2010; Fraser et al. 2010) and pathogenic adaptations in clinical yeasts (Fraser et al. 2012), as well as morphological, physiological, and behavioral adaptations between strains of mice (Fraser et al. 2011).
Here we apply a similar framework to study the impact of natural selection on translation using ribosome profiling in hybrids of closely related species of yeast. Unlike previous studies of translational divergence, which have either used codon usage as a proxy for translational efficiency (e.g., Man and Pilpel 2007), or have had limited statistical power and/or coverage of the proteome (Khan et al. 2012), this approach captures ribosomal occupancy directly and therefore takes into account the potential for changes in the rate of initiation or pausing. Furthermore, as ribosome profiling generates ASE information for both mRNA abundance and translational efficiency simultaneously (Ingolia et al. 2009), it offers an unparalleled opportunity to compare patterns of divergence across both levels, thereby offering a glimpse into the landscape of regulatory divergence beyond mRNA abundance.
Results
Simultaneous detection of regulatory divergence at two levels
In order to compare cis-regulatory divergence in yeasts at the levels of mRNA abundance and translation simultaneously, we performed ribosome profiling (Ingolia et al. 2009; Ingolia 2010) on the interspecific hybrid of S. cerevisiae and its closely related wild congener, Saccharomyces paradoxus (∼5 million years diverged) (Scannell et al. 2011). Ribosome profiling involves the construction of two RNA-seq libraries from each sample: The first is derived from poly-adenylated mRNA (hereafter called the “mRNA” fraction) and measures the abundance of each mRNA in the cell. The second library is derived from fragments of these mRNAs protected from nuclease digestion by actively translating ribosomes (the “Ribo” fraction). As more highly transcribed genes produce more read counts in both the mRNA and Ribo fractions, the relative translational efficiency (hereafter simply “translation”) of each coding mRNA is determined by dividing its abundance in the Ribo fraction by its corresponding abundance in the mRNA fraction (both measured in reads per kilobase per million mapped reads, or RPKM). Ratios >1 indicate transcripts with higher than average translation (per mRNA transcript), while ratios <1 reflect transcripts with lower levels of translation (Ingolia et al. 2009).
After performing ribosome profiling for two biological replicates in nutrient-rich conditions (see Methods), we mapped reads to a set of 4640 high-confidence 1:1 orthologs (Scannell et al. 2011) for which most reads could be unambiguously assigned to one of the parental alleles (Supplemental Table S1; see Methods). As expected, Ribo fractions showed an overwhelming preference for the protein-coding regions of mRNAs, and biological replicate abundance measurements and estimated translational efficiency from both fractions agreed well (Spearman's ρ > 0.97 and ρ > 0.85 for estimated abundances and translational efficiencies, respectively) (Supplemental Fig. S1; Supplemental Table S2). Furthermore, the distributions of RPKMs in both fractions are not significantly different between species, indicating that there is no systematic bias in allelic abundances favoring either species (Kruskal–Wallis rank sum test, P = 0.99 and 0.88 for the mRNA and Ribo fractions, respectively).
Within hybrids, both alleles share the same trans-acting cellular environment. Therefore, ASE in the mRNA fraction is indicative of cis-regulatory divergence of mRNA abundance between species (denoted as hybrid Sc/Sp mRNA ≠ 1, where Sc/Sp indicates the ratio of the S. cerevisiae allele's expression level to that of S. paradoxus) (Fig. 1A). Similarly, the translational cis ratio refers to the ratio between the Ribo ASE and the mRNA ASE. In the absence of cis-regulatory divergence in translational efficiency, the ASE ratio of the Ribo fraction should equal that of the mRNA fraction. Therefore, significant cis-regulatory divergence in translation is inferred when these ratios differ (hybrid Sc/Sp Ribo ≠ hybrid Sc/Sp mRNA). As our inference of translational divergence includes variability in the estimates of the Sc/Sp ratio from both fractions, it likely has reduced power to detect significant differences relative to mRNA abundance (see below).
Figure 1.

(A) Identifying cis-regulatory divergence at two levels. In the example, the S. paradoxus allele (blue) is transcribed at a higher level than that of S. cerevisiae (red), as represented by the larger number of wavy lines. However, the S. cerevisiae allele has higher translational efficiency, as represented by the larger number of ribosomes per transcript (pairs of gray circles). The S. paradoxus mRNA cis bias manifests as a negative log2(Sc/Sp) ratio in the mRNA fraction. If translational efficiency was unchanged between alleles, the more abundant allele, in this case S. paradoxus, would produce more footprints in the Ribo fraction. Therefore the translational cis ratio is obtained by dividing the Sc/Sp Ribo fraction ratio by the mRNA fraction ratio (which is equivalent to a subtraction in log2). The net log2(Sc/Sp) translational cis ratio is positive, indicating cis bias favoring S. cerevisiae translation. (B) Detection of significant translational divergence is based on rejecting the null hypothesis that the observed allelic ratios are not significantly different from one another (see A). The observed Sc/Sp ratios (red circles, mRNA fraction; blue circles, Ribo fraction) (i) were obtained directly from the replicates of the two fractions. (ii) These were permuted by resampling the base-level coverage of each allele with replacement 10,000 times, generating a distribution of Sc/Sp ratios that captures the interallelic variability in base composition, length, and read coverage. (iii) The distributions of permuted ratios (boxplots) were then each reciprocally compared with the corresponding observed ratio (e.g., the permuted distribution of Sc/Sp Ribo ratios [blue boxplots] was compared with the observed mRNA Sc/Sp ratio [red circles] and vice versa) for which a two-tailed P-value was calculated. If all comparisons agreed in the parental direction of allelic bias, then (iv) the least significant P-value (indicated by the red asterisk) was used as the representative for the comparison. See Supplemental Material for application of the test to the mRNA level and trans comparisons.
Furthermore, estimates of Ribo ASE may be less accurate than mRNA ASE, because of both lower read counts (Supplemental Table S2) and greater heterogeneity within transcripts, likely due to variation in ribosomal processivity (Ingolia et al. 2009). Indeed, estimates of hybrid Sc/Sp were more reproducible between biological replicates in the mRNA fraction (Spearman's ρ = 0.78 and 0.58, for the mRNA and Ribo fractions, respectively) (Supplemental Fig. S2). Therefore we applied a previously developed test of cis-regulatory divergence to the mRNA level (Supplemental Fig. S3; Bullard et al. 2010) and modified it to account for this difference at the translational level (see Methods). Briefly, in order to detect significant translational cis-regulatory divergence (i.e., hybrid Sc/Sp Ribo ≠ hybrid Sc/Sp mRNA), we applied a resampling approach that takes into account differences between alleles in base composition, length, and read coverage (Fig. 1B). This approach was more conservative than simply testing for significant differences from binomial expectations of read coverage (Supplemental Fig. S4).
Cis-regulatory divergence in translation is pervasive
In order to compare patterns of regulatory divergence between mRNA abundance and translation directly, we restricted our analysis to the 3665 orthologs to which at least 100 reads mapped across both alleles in both fractions (see Methods). Our estimates of ASE in mRNA abundance agreed with a previous microarray-based analysis of this hybrid (Supplemental Fig. S5; Tirosh et al. 2009). Significant cis-regulatory divergence in translational efficiency was detected in 35% of orthologs, as compared with 61% with significant divergence in mRNA abundance (Fig. 2A; Supplemental Fig. S6). However, this apparently greater role of divergence in mRNA abundance is largely a result of our conservative approach to detecting translational divergence, leading to greater statistical power to detect divergence at this level. When comparing the magnitudes of divergence in mRNA abundance versus translation, we actually find a slightly stronger role for translation (median absolute log2 cis ratio = 0.325 for translation and 0.288 for mRNA abundance; Kruskal–Wallis P = 0.009). This suggests that translation efficiency may be of comparable importance to mRNA abundance in the evolution of protein production rates in yeast.
Figure 2.

(A) The relationship between cis-regulatory divergence at the mRNA abundance and translational levels (all plotted Sc/Sp ratios are the mean of the two biological replicates). Divergence was detected only at the mRNA level for a large fraction of genes (orange circles), though greater than one-tenth of orthologs were significantly diverged only in translation (blue circles). Among orthologs diverged at both levels, we observed a significant excess opposing (red triangles) as compared with reinforcing changes (green squares). The number of orthologs in each class is indicated in the barplot. (S. cer) S. cerevisiae; (S. par) S. paradoxus. (B) Opposing divergence across regulatory levels. The red line indicates the best fit of a linear regression, with equation, p, and r2 values indicated above. The slope is significantly lower than one (95% confidence interval ±0.033), indicating that Sc/Sp mRNA ratio estimates tend to overestimate the degree of difference by ∼15% relative to that of the Ribo fraction. (C) Orthologs whose promoters contain either TATA boxes (TATA) or occupied proximal nucleosome regions (OPN) (Tirosh and Barkai 2008) show more divergence in cis only at the mRNA level when compared with non-TATA promoters (Non) or depleted proximal nucleosome regions (DPNs), respectively. Kruskal–Wallis test P-values are indicated above each fraction.
Among those orthologs with significant cis-regulatory divergence in both mRNA abundance and translation, changes at the two levels could either be reinforcing (acting in the same direction) or opposing (acting in opposite directions). For neutral changes not influenced by natural selection, an equal number of each would be expected (Fraser et al. 2010). However, we found a greater than twofold excess of genes whose divergence is in opposing directions at the two regulatory levels (561 opposing vs. 256 reinforcing, χ2 test P = 7.1 × 10⁻²⁷), leading to maintenance of similar protein abundances between species (Fig. 2A). We found no evidence that this was biased by extreme measurements, as both reinforcing and opposing divergence were observed across the full range of expression levels and cis ratios (Supplemental Fig. S7; Supplemental Material). In order to address this phenomenon more generally, we compared the Sc/Sp ratios calculated from both fractions across all orthologs and found that changes in mRNA abundance tend to overestimate the divergence in protein production rate by ∼15% (Fig. 2B).
Interestingly, comparison with a data set of mRNA expression variability across 17 S. cerevisiae strains grown under nutrient-rich conditions (Kvitek et al. 2008) revealed that orthologs with opposing cis-acting divergence were significantly less variable than orthologs with reinforcing differences (Kruskal–Wallis rank sum test, P = 0.030; P = 0.0072 for strongly opposing changes, defined as the 50% of genes with the largest differences in Ribo-mRNA cis ratios). Therefore, orthologs with opposing directionality of changes, in which translational differences tend to buffer mRNA level changes, are associated with genes that show more constrained mRNA abundances across strains of S. cerevisiae, consistent with the action of stabilizing selection. We also explored patterns of sequence divergence in the promoters, 5′ UTRs, CDSs, and 3′ UTRs among orthologs with reinforcing versus opposing cis-acting divergence and found no significant differences between categories with the exception of slightly increased conservation of the 5′ UTRs of opposing orthologs (Kruskal–Wallis test, P = 0.010) (Supplemental Fig. S8).
A positive relationship has been reported between upstream sequence divergence and cis-acting divergence in mRNA levels, as expected if divergence in promoter elements underlies regulatory divergence (Tirosh et al. 2009). Controlling for confounding effects of divergence within the CDS, we found similar positive relationships between the absolute Sc/Sp mRNA and translational cis ratios and sequence divergence in 5′ UTRs, with a slightly stronger effect in the latter (P = 0.0042 and 0.00069 for the mRNA and translational levels, respectively) (see Supplemental Material).
Previous studies have noted that promoters containing a TATA box—a key CRE that affects transcription initiation—tend to have greater divergence in mRNA levels than TATA-less promoters (Tirosh et al. 2006, 2009; Landry et al. 2007; Skelly et al. 2013). A similar effect has been found for promoters with high nucleosome occupancy proximal to their transcriptional start site (hereafter “occupied proximal-nucleosome,” or OPN) (Tirosh and Barkai 2008, 2011; Tirosh et al. 2010). We observed independent positive relationships between TATA or OPN promoters and divergence at the mRNA level, but not in translation, suggesting that their effects are restricted to the level of transcription (Kruskal–Wallis rank-sum test, P = 0.00079 and 0.00040, for TATA and OPN at the mRNA level, and P = 0.43 and 0.82 at the translational level, respectively) (Fig. 2C). These results remained unchanged when considering both factors simultaneously (Supplemental Fig. S9). We also found a slight yet significant excess of TATA-less promoters among those with opposing as compared with reinforcing divergence at both regulatory levels (89% vs. 80% TATA-less for opposing and reinforcing divergence, respectively; χ2 test, P = 0.0026), supporting the notion that these genes may be subject to stabilizing selection to preserve protein levels.
At the translational level, it has been noted that ribosomal occupancy is a function of the rate of ribosomal processivity, which differs across codons (Letzring et al. 2010). Highly expressed transcripts show strong codon usage bias (CUB), which has been hypothesized to ensure high translational efficiency (preventing sequestration of ribosomes) and/or accuracy (preventing the production of nonfunctional proteins) (Gingold and Pilpel 2011). When controlling for the mRNA level, a significant negative correlation was observed between CUB as measured in S. cerevisiae and the absolute translational cis ratio, but not the absolute mRNA cis ratio (analysis of covariance [ANCOVA], P = 1.5 × 10⁻¹² and 0.13, respectively). The presence of mRNA secondary structure in the vicinity of the start codon has also been implicated in reducing translational efficiency (Kudla et al. 2009; Robbins-Pianka et al. 2010; Bentele et al. 2013; Dvir et al. 2013; Goodman et al. 2013; Shah et al. 2013). We found evidence for a positive correlation between species-specific decreases in computationally predicted secondary structure downstream from the start codon and increased translational efficiency (Supplemental Fig. S10; see Supplemental Material). Finally, we also note that several studies have suggested that the presence of translated upstream open reading frames (uORFs) in the 5′ UTRs of genes may regulate translational efficiency (Ingolia et al. 2009; Brar et al. 2012; Pelechano et al. 2013), however, we find no evidence that they play a significant role in explaining cis-regulatory divergence in translation between these species (Supplemental Material).
Trans-acting regulatory divergence is widespread at both regulatory levels
In the absence of epistasis between cis- and trans-regulation, the fraction of expression divergence not explained by cis divergence can be attributed to differences in trans-acting factors (Wittkopp 2005). In order to estimate the contribution of trans divergence at both regulatory levels, we performed riboprofiling on two biological replicates of the parental strains used to generate the hybrid and estimated the ratio of the S. cerevisiae ortholog's expression level to that of S. paradoxus (denoted as parental Sc/Sp mRNA or Ribo; see Methods). As in the case of the hybrids, we observed high concordance between replicate measurements (Supplemental Figs. S11, S12; Supplemental Table S2). Following the same logic as above, the Sc/Sp trans mRNA ratio is obtained by subtracting the log2(hybrid Sc/Sp mRNA) from log2(parental Sc/Sp mRNA). At the translational level, the trans ratio is obtained by subtracting the sum of the log2-transformed hybrid Ribo ratio and the parental mRNA ratio from the interspecific difference in the Ribo fraction (parental Sc/Sp Ribo − hybrid Sc/Sp Ribo − parental Sc/Sp mRNA), thereby accounting for mRNA differences between species as well as the fraction of translational divergence attributable to cis effects. Significant trans divergence at both levels was determined using the same resampling approach as above (see Methods).
To compare divergence in cis and trans across regulatory levels directly, we restricted the following analyses to the 3634 orthologs with sufficient coverage in all samples and replicates (Supplemental Fig. S13; see Methods). Similar numbers of cis- and trans-acting changes were detected for both mRNA (2217 cis vs. 2384 trans) and Ribo (1264 cis vs. 1275 trans).
Similar to our analysis of cis-acting divergence across regulatory levels (Fig. 2A), we tested for reinforcing or opposing patterns in trans. As was the case for the cis level, there was also a significant excess of opposing trans divergence across levels (χ2 test, P = 5.1 × 10⁻¹²) (Supplemental Fig. S14). In addition, the patterns of trans divergence support the mRNA-level specific role of TATA boxes and OPNs (Supplemental Fig. S15), similar to our findings for cis-acting divergence (Fig. 2C). Supporting a general pattern of opposing mRNA and translational divergence that buffer changes in protein production rates, we found that the parental Sc/Sp mRNA levels also overestimated the translational component of between-species regulatory divergence (Supplemental Fig. S16).
The reinforcing versus opposing distinction can also be made comparing cis and trans divergence within a single regulatory level. As has been observed in this hybrid previously (Tirosh et al. 2009), there was a slight excess of opposing cis and trans changes at the mRNA level (χ2 test, P = 0.0018) (Supplemental Fig. S17). No significant difference was observed between reinforcing versus opposing mechanisms of divergence at the translational level (χ2 test, P = 0.83); however, this may reflect the lower precision of the Ribo fraction (see Supplemental Fig. S18).
Polygenic selection at two levels of gene regulation
We next determined whether there was evidence of lineage-specific polygenic selection in either mRNA abundance or translation by taking advantage of a recently developed approach to detect nonneutral evolution across functionally related groups of genes (Bullard et al. 2010; Fraser et al. 2010; Fraser 2011). Under neutral divergence of cis-regulation, no consistent bias is expected in the relative parental direction of ASE among genes within a functional category (e.g., a protein complex, biochemical pathway, or genes contributing to the same phenotype) (Fig. 3A). Conversely, consistent directional bias across a functional group indicates that multiple independent cis-regulatory changes have altered gene expression in a coordinated fashion, and is evidence of lineage-specific selection.
Figure 3.

(A) Detecting selection from patterns of ASE in hybrids. The example above shows ASE levels (indicated by the wavy lines) for four genes belonging to a particular functional category. Black “X”s indicate down-regulating cis-regulatory differences between the parental alleles. For a given group of functionally related genes evolving neutrally, no bias is expected with respect to the directionality of ASE in hybrids (No selection). However, biased directionality, as in the case in which all down-regulating mutations occurred along the S. cerevisiae lineage (Selection), indicates a history of lineage-specific selection acting on cis-regulation. (B) Reinforcing lineage-specific bias on orthologs involved in divalent cation and heavy metal resistance. (Green triangles) Orthologs within this functional category with reinforcing directionality of bias at both regulatory levels. Significantly more (17) orthologs are reinforcing along the S. cerevisiae lineage as compared with that of S. paradoxus (five). All orthologs are indicated as gray circles. (C) S. cerevisiae strain S288c is more resistant to heavy metals than S. paradoxus strain CBS432. Shown are the log2-transformed relative growth rates (S. cerevisiae/S. paradoxus) for the four heavy metals at two concentrations (L, low; H, high) measured by Warringer et al. (2011). S. cerevisiae outperforms S. paradoxus under all conditions, although in the presence of nickel, the difference is negligible.
Therefore, we performed scans for selection independently at the level of mRNA abundance and translation, as well as among all orthologs with reinforcing directionality of bias at both regulatory levels. We tested 591 gene sets for deviation from neutral expected frequencies by means of a χ2 test, and used a permutation framework to control for the number of tests performed (see Methods).
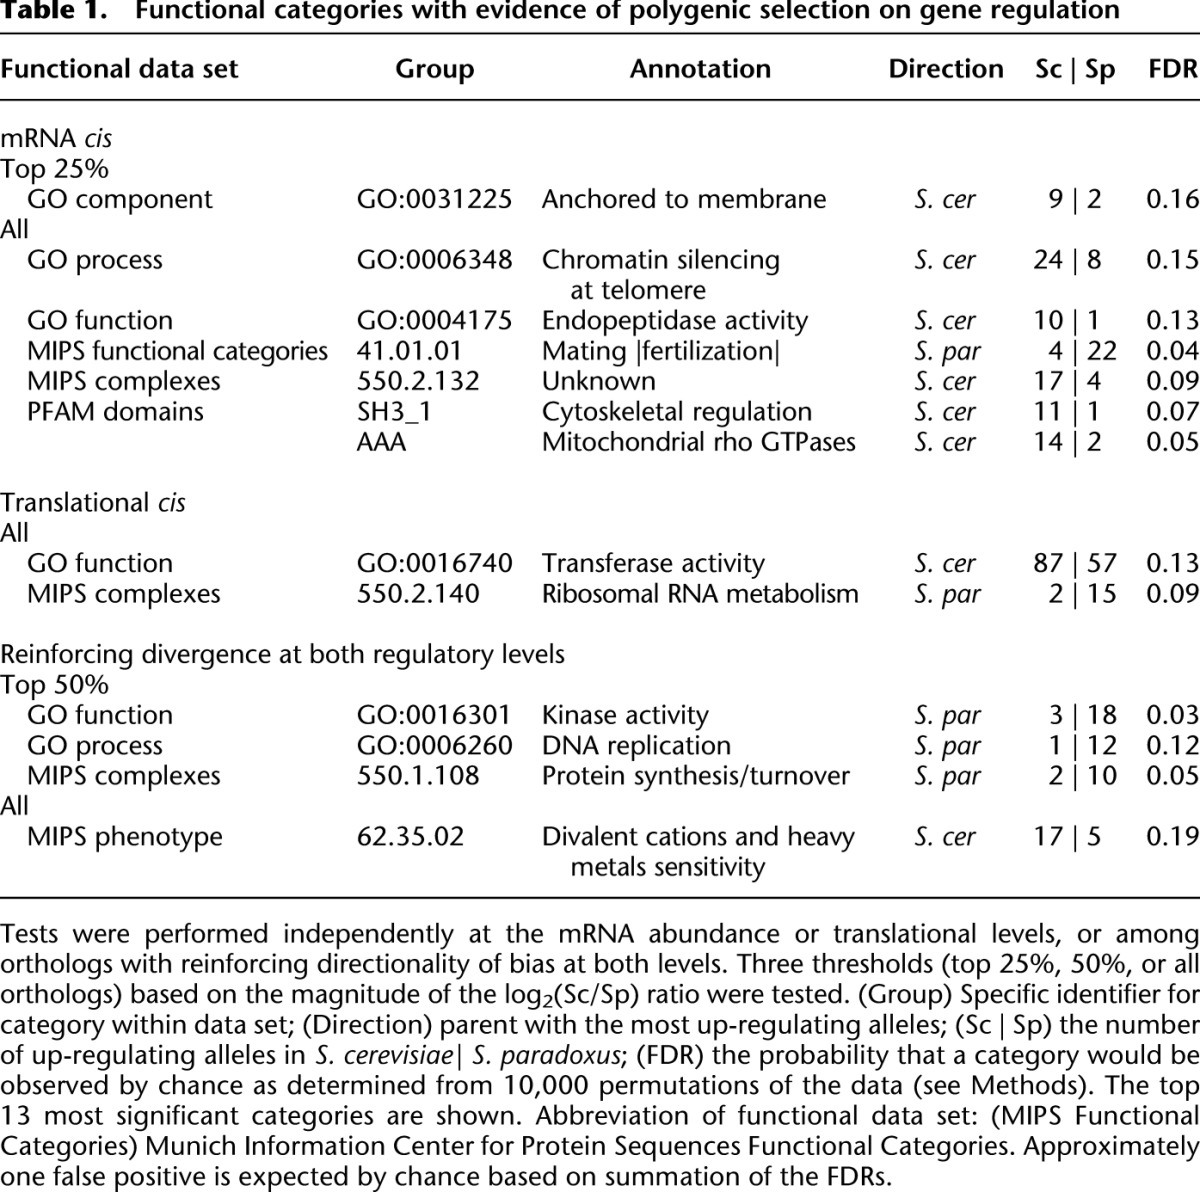
We detected lineage-specific enrichment in several functional categories representing a wide variety of cellular processes. In Table 1 we report the 13 most significant gene sets (∼1 expected by chance; full gene lists in Supplemental Table S3). Functions such as mating and telomeric silencing were found to be under lineage-specific selection on mRNA abundance, while for translation, a protein complex involved in rRNA metabolism was implicated. Combining both levels, we found several gene sets with evidence for reinforcing lineage-specific selection on both mRNA abundance and translation, including kinases and genes related to heavy metal sensitivity (Table 1). Our finding of natural selection on both levels of regulation, in some cases targeting the same gene sets, highlights the importance of considering both levels simultaneously.
Table 1.
Functional categories with evidence of polygenic selection on gene regulation
We then sought to determine whether any of the candidate instances of polygenic selection detected above was associated with phenotypic differences between these strains. One of the functional categories biased toward S. cerevisiae, “divalent cations and heavy metals sensitivity” (Fig. 3B), harbors many genes involved in vacuolar regulation and transport. Since deleting these genes leads to deficient growth in the presence of divalent cations and heavy metals, we predicted that the S. cerevisiae lineage would exhibit increased resistance to these metals.
A recent study of yeast growth rates across 200 different conditions included the parental strains we used to generate the hybrid (Warringer et al. 2011). Among these were two different concentrations (denoted here as “low” and “high”) of four divalent heavy metal cations: cadmium (CdCl2), cobalt (CoCl2), copper (CuCl2), and nickel (NiCl2). As predicted, S. cerevisiae strain S288c outperformed S. paradoxus CBS432 under all concentrations and metabolites in terms of growth rate, with the exception of nickel, where the difference between strains was negligible (Fig. 3C). In fact, the relative growth advantages of S. cerevisiae in high concentrations of copper and both concentrations of cobalt are among the largest phenotypic differences found between these strains (Warringer et al. 2011). Interestingly, the superior resistance to heavy metals of the S. cerevisiae parental strain does not appear to be a fixed difference between species, since many wild S. cerevisiae strains are less fit than their S. paradoxus counterparts in the presence of these cations (Warringer et al. 2011). Therefore, the reinforcing cis-regulatory divergence observed across regulatory levels may reflect selection acting in a strain-specific manner, rather than species-level divergence.
Identification of conserved C-terminal peptide extensions
Organisms have been shown to increase peptide diversity by infrequent stop-codon readthrough, one form of which involves the ribosome inserting an amino acid into the growing peptide at a stop-codon position and continuing in-frame translation (von der Haar and Tuite 2007). Consequences of readthrough include prevention of deadenylation increasing mRNA stability, ribosome stalling inducing mRNA degradation, or production of a protein with a C-terminal peptide extension. Two functional C-terminal extensions were previously identified in S. cerevisiae: Extension of the PDE2 gene decreases its stability, resulting in accumulation of cyclic AMP (Namy et al. 2002); and readthrough of IMP3, involved in ribosomal biogenesis, destabilizes its interaction with the U3 snoRNA (Cosnier et al. 2011). A recent systematic study of conserved protein-coding potential in candidate C-terminal extensions in eukaryotes failed to identify any candidates in yeasts (Jungreis et al. 2011); however, the investigators required strong sequence conservation of the extension across five sensu stricto species. Multi-species riboprofiling data provide an excellent opportunity to search for direct evidence of translation in putative C-terminal extensions at the transcriptome-wide level.
We identified all orthologs in which both species shared the potential for C-terminal peptide extensions via the presence of in-frame stop codons in their 3′ UTRs and assessed these putative C-terminal extensions for the presence of translation in the Ribo fractions (see Methods). Translation was detected in one or both species in 109 and 81 cases, respectively. The putative C-terminal extensions for all 190 genes were aligned and evaluated for their potential to encode conserved peptides by the absence of frameshifting indels and CDS divergence patterns consistent with purifying selection.
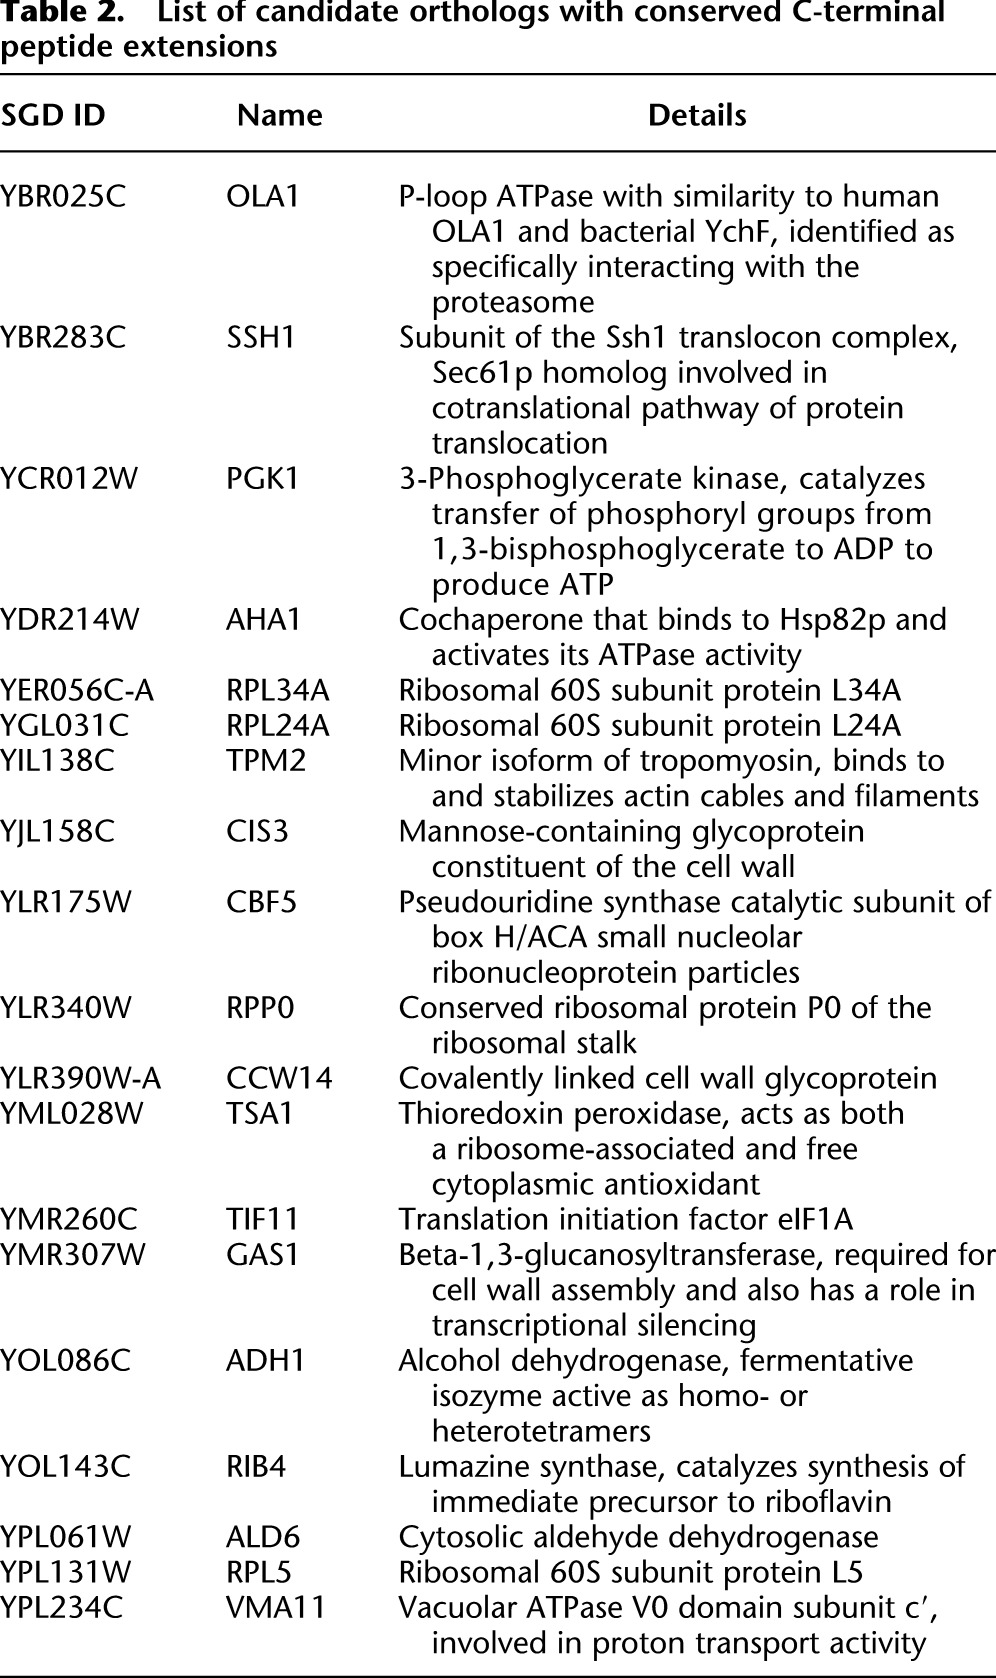
These criteria identified 19 strong candidates for conserved C-terminal peptide extensions, representing a wide variety of functions including glycolysis (PGK1), response to heat shock (AHA1), actin filament stabilization (TPM2), and the large ribosomal subunit (four genes, hypergeometric test of enrichment, P = 2.2 × 10⁻⁶) (Table 2; Supplemental Table S4). Interestingly, we detected IMP3 readthrough only in S. cerevisiae, and the peptide sequence of the extension is not conserved (see Discussion). Translation was not detected in the C-terminal extension of PDE2 in either species; however, it is in the bottom quartile of translational efficiency among yeast genes, making detection of its estimated ∼2.2% frequency of readthrough (Namy et al. 2002) challenging without very deep read coverage.
Table 2.
List of candidate orthologs with conserved C-terminal peptide extensions
An example of conserved C-terminal extension, translation initiation factor eIF1A (TIF11), is shown in Figure 4A. Tif11 is an essential protein that is involved in start codon identification whose C terminus interacts with Fun12, a GTPase also involved in initiation of translation. Stop-codon readthrough could potentially play a role in the regulation of this interaction. Several species-specific readthrough events were also observed (Fig. 4B), suggesting this may be an unappreciated source of regulatory divergence.
Figure 4.

Evidence of stop-codon readthrough leading to C-terminal peptide extension. The translation initiation codons are indicated by the right-facing arrow, the annotated ORF by the thick black lines, and the canonical stop codon by the black triangles. The candidate C-terminal peptide extension is indicated by the gray line terminated by in-frame stop codons in the 3′ UTR (gray triangles above the line for S. cerevisiae, and below for S. paradoxus). Dark shades (red, S. cerevisiae; blue, S. paradoxus) indicate nucleotide-level coverage of mRNA fraction reads, and light shades indicate Ribo fraction reads. (A) Example of conserved C-terminal peptide extension of the translation initiation factor eIF1A (TIF11). The putative 21-amino-acid extension is conserved and well covered by reads in the Ribo fraction of both species. (B) Example of a S. paradoxus–specific C-terminal extension in MRPS16, a subunit of the mitochondrial ribosome. mRNA fraction reads indicate that the 3′ UTR is expressed in both species; however, translation is only detected in the 17-amino-acid extension of S. paradoxus, and not the potential 21-amino-acid extension of S. cerevisiae. Interestingly, coverage of the C-terminal extension in S. paradoxus is comparable to that of the CDS, suggesting that readthrough of this gene may be frequent.
Discussion
Evolution at two regulatory levels
A complete understanding of the role of regulatory change in the evolution of phenotypic diversity requires approaches to measuring divergence beyond the mRNA level. Using ribosome profiling of interspecific hybrids, we have identified cis- and trans-regulatory changes at two regulatory levels simultaneously. In particular, our results suggest that cis-acting divergence at the translational level is a common yet underappreciated feature of regulatory evolution. Indeed, despite our observation of a larger proportion of orthologs with significant divergence at the mRNA level (Fig. 2A), the magnitudes of the cis-ratios were similar at both levels, indicating that we have likely underestimated the frequency of translational divergence. This is supported by recent studies that have identified quantitative trait loci associated with protein abundance (pQTLs) (Skelly et al. 2013; Wu et al. 2013), which have found that only approximately half of pQTLs can be explained by differences in transcript abundance, suggesting a substantial role for post-transcriptional regulation.
In cases in which divergence occurred at both regulatory levels, we observed a dominant pattern of opposing directionality of change (both in cis and in trans), indicating that mRNA levels tend to overestimate the regulatory divergence in protein abundance in hybrids and the total divergence between species (Fig. 2A,B; Supplemental Fig. S16). Furthermore, this phenomenon was associated with genes that show constrained mRNA abundances across strains of S. cerevisiae (Kvitek et al. 2008), consistent with the action of stabilizing selection. Previous studies of mRNA abundance have established that stabilizing selection is the primary mode of selection acting on the transcriptome (Denver et al. 2005; Rifkin et al. 2005; Bedford and Hartl 2009). The target of selection is likely protein abundance rather than mRNA expression level per se, and our results suggest that regulatory output may be canalized via changes at multiple levels.
Previous studies have found functional associations between divergence patterns in different regulatory mechanisms. For instance, Dori-Bachash et al. (2011) noted that divergence of transcription and mRNA degradation are often coupled, and controlled by the same regulators. In contrast, our findings indicate that control of mRNA levels and translation can result from different underlying architectures (e.g., related to TATA boxes and promoter nucleosomes). Interestingly, a recent analysis of mRNA and protein abundance across 22 strains of S. cerevisiae found that the presence of TATA boxes was associated with greater interstrain variability in both transcript and protein levels, the latter measured by tandem mass spectrometry (Skelly et al. 2013). Our results are consistent with this, and suggest that the relationship between TATA promoters and divergence in protein abundance results from their effect at the transcriptional level (Fig. 2C), in line with the well-established role of the TATA box (Tirosh et al. 2006, 2009; Tirosh and Barkai 2008).
Similarly, other factors may act only at the translational level. For example, translational rate is thought to vary along individual transcripts due to codon translation rate variability and/or mRNA secondary structures (Kertesz et al. 2010; Gingold and Pilpel 2011), in contrast to the more nearly constant rate of transcriptional elongation (Singh and Padgett 2009). Although analysis of ribosomal profiling data from multiple species has produced equivocal results regarding the effect of codons on translational elongation rates (Ingolia et al. 2011; Tuller et al. 2011; Qian et al. 2012; Charneski and Hurst 2013), we found an association between high CUB and conservation of translational efficiency, providing evolutionary evidence that codon usage is associated with translational dynamics. Furthermore, we observed that cis-acting translational differences are associated with changes in computationally predicted secondary structure (Supplemental Fig. S10).
Polygenic selection at multiple regulatory levels
Our observation of lineage-specific ASE bias across functional groups provides the first direct evidence of polygenic selection on translation, and indicates that such selection can be reinforcing across multiple regulatory levels. Similar to the McDonald–Kreitman test (McDonald and Kreitman 1991), our test will detect any lineage-specific difference in selection pressure; thus, an open question is which of these cases represents positive selection, as opposed to a relaxation of negative selection in one lineage. Although signatures of recent selective sweeps have been used to infer adaptation in similar cases when comparing strains within S. cerevisiae (Fraser et al. 2010, 2012), this approach has little power for the far more ancient divergence of the lineages we have studied here.
However, regardless of the mode of lineage-specific selection at work, these regulatory changes may have led to divergence in diverse phenotypes. The gene set with the clearest phenotypic connection—higher levels of both mRNA and translation in S. cerevisiae among genes whose loss leads to heavy metal sensitivity—makes the prediction that S. cerevisiae may have greater tolerance to these metals, which is, indeed, the case (Fig. 3C). As noted above, this tolerance to heavy metals is not a fixed difference between the species, but rather is specific to some domesticated strains of S. cerevisiae. In particular, the superior tolerance of domesticated strains to growth in high copper environments has long been thought to reflect artificial selection imposed by brewing in copper containers as well as the use of copper sulfate as a fungicide and insecticide (Fogel and Welch 1982). Although the amplification of the CUP1 gene is a major source of this resistance (Warringer et al. 2011), many genes are involved in metal tolerance—some unique to specific cations and others shared by multiple (Bleackley et al. 2011)—and our results suggest that the ancestors of S288c may have experienced a history of polygenic adaptation for this trait.
Another notable example of lineage-specific selection involves the mating/fertilization gene set, in which 22 genes have higher mRNA abundance from S. paradoxus alleles, compared with only four from S. cerevisiae alleles. Interestingly, while sexual reproduction is thought to be rare in the wild for both species, estimates of mating frequency are ∼50-fold higher for S. paradoxus as compared with S. cerevisiae (Ruderfer et al. 2006; Tsai et al. 2008), consistent with either selection to increase expression in S. paradoxus, or perhaps relaxed constraint on their cis-regulation in S. cerevisiae. However, for the majority of gene sets with evidence of lineage-specific selection (Table 1), we could not make any specific phenotypic predictions.
Conservation and divergence of C-terminal peptide extensions
C-terminal peptide extensions via stop-codon readthrough are thought to play a relatively minor role in eukaryotic proteomic diversity, as only a handful of experimentally observed examples are known (Jungreis et al. 2011). Combining direct translational evidence from the Ribo fraction with sequence conservation between the parental species, we identified 19 candidates for conserved C-terminal extensions (Table 2). However, in the majority of cases in which translation was detected in putative extensions, the peptide sequence was poorly conserved (62 cases) and/or species-specific (109 cases) (Supplemental Table S4), including the experimentally verified extension of IMP3 (Cosnier et al. 2011).
Our observations suggest two features of C-terminal extensions in yeasts: First, conserved peptide extensions may not require sequence conservation to be functional. Both verified extensions in yeast exert their effects by destabilizing protein function and/or interactions (Namy et al. 2002; Cosnier et al. 2011). This may result from the addition of any unstructured component to the C terminus, which can lead to destabilization and degradation of the folded polypeptide (von der Haar and Tuite 2007). Second, it has been suggested that peptide extensions represent a mechanism for organisms to transiently expose hidden genetic information (True et al. 2004). If functional, C-terminal peptide extensions may evolve rapidly because of their ability to be transiently expressed in response to specific conditions, using a translational mechanism to mitigate the potentially deleterious costs of changes in the constitutively translated portion of the peptide.
Toward a comprehensive view of gene expression evolution
Although we have discovered widespread natural selection contributing to the divergence of translation rates, complementing the extensive literature on the evolution of mRNA abundances, these two levels still represent only a fraction of the steps from DNA to protein. Other regulatory mechanisms, such as mRNA splicing/editing/localization/decay, post-translational modification, and protein decay, are all likely targets of natural selection as well. As technologies able to probe these levels continue to be developed, a more holistic understanding of how gene expression evolves will be achievable. We speculate that transcription and translation (together with alternative splicing in some species) may emerge as the dominant levels at which selection shapes protein abundances, owing to the exquisite spatial and temporal specificity achievable by minor alterations of the multitude of discrete cis-regulatory elements controlling these two regulatory levels.
Methods
Yeast strains and growth conditions
A diploid interspecific hybrid yeast strain was produced by mating the haploid strains of S. cerevisiae (isogenic to BY4716 MATα lys2 ura∷KAN) and S. paradoxus CBS432 (MATa ura∷HYG). All samples and replicates were derived from single colonies grown in YPD medium at 30°C. Two biological replicates of the hybrid and parental strains were collected during log phase growth (OD600 = 0.5–0.7) from 750-mL YPD cultures grown in a C24 Incubator Shaker (New Brunswick Scientific) for at least 16 h at 30°C.
Ribosome profiling library construction and sequencing
Ribosome profiling next-generation sequencing (NGS) libraries were prepared as detailed in Ingolia (2010) with modifications by Brar et al. (2012) and sequenced to a read length of 36 bases using an Illumina HiSeq 2000 instrument at the Stanford Center for Genomics and Personalized Medicine (see Supplemental Material).
Allele-specific read mapping
Hybrid and parental reads from both fractions were mapped using Bowtie version 0.12 (Langmead et al. 2009) in a strand-specific manner using the iterative method described in Ingolia (2010) in order to enrich for ribosome-protected fragments and account for spurious adenine (A) bases added to the 3′ ends of reads by the oligo(dT)-mediated reverse transcription (see Supplemental Methods). All analyses of coverage were restricted to locations where all possible reads spanning the nucleotide of interest would map uniquely. Furthermore, we removed all nucleotides within 27 bp of a splice junction as junction-spanning reads were likely to be underrepresented in our short read lengths.
Mapping reads were assigned to genomic locations (CDS, 5′ and 3′ UTRs, or introns) based on the position of their 5′-most base. Criteria follow Ingolia et al. (2009), except for the CDS (16 bases upstream of the first nucleotide and 16 bases upstream of the last nucleotide) and 3′ UTRs (13 bases upstream of the first nucleotide to 15 bases upstream of the last nucleotide) in order to minimize the possibility that reads assigned to the latter were spurious signal from the CDS during our analysis of candidate stop-codon readthrough (see below).
Genome assemblies and annotation
S. cerevisiae and S. paradoxus genome assemblies, annotations, and orthology assignments were obtained from Scannell et al. (2011), from which we curated a high-confidence set of 4640 nuclear genes (Supplemental Table S1; Supplemental Material).
Detecting significant cis-regulatory divergence in hybrids
We first obtained base-level read coverages in the CDSs of both species for all uniquely mappable positions for all hybrid fractions and replicates for the 4640 orthologs. A minimum of 100 reads mapping among both alleles within each replicate mRNA fraction (4436 orthologs) or each replicate in both the mRNA and Ribo fractions (3665 orthologs) was required to test for evidence of mRNA and translational cis-regulatory divergence, respectively. To test for significant cis differences in the mRNA abundance (Sc/Sp mRNA ≠ 1), we implemented the resampling test detailed in Bullard et al. (2010) (Supplemental Fig. S2; Supplemental Material). For the test of significant cis-regulatory divergence in translation (as shown in Fig. 1B), we sought to reject the null hypothesis that log2(Sc/Sp Ribo) was not significantly different from log2(Sc/Sp mRNA). Therefore, we resampled the CDS base-level coverage of the S. cerevisiae allele using the S. cerevisiae marginal nucleotide frequencies (πc = πc[A], πc[C], πc[G], πc[T]) and length (Lc) and the S. paradoxus allele using πp and Lp 10,000 times in each replicate of the Ribo fraction. Each resampling was used to generate a distribution of started log2 ratios (total base level coverage from πc, Lc + 1/total base level coverage from πp, Lp + 1), denoted as log2[(Sc + 1)/(Sp + 1)], which takes into account the variability in read coverage across each allele. These distributions were then compared to the observed log2[(Sc + 1)/(Sp + 1) mRNA] ratio in the same replicate to generate a P-value based on how often the observed ratio was outside the bounds of the permuted distribution. The same resampling was then repeated reciprocally in each mRNA fraction replicate, which was compared with the observed log2[(Sc + 1)/(Sp + 1) Ribo] ratio in the same replicate. If the directionality of difference agreed among all comparisons, the least significant of the four P-values was retained. Finally, P-values were adjusted such that we retained only those comparisons significant at an FDR of 5% for further analysis (Benjamini and Hochberg 1995). We used an equivalent approach to detect trans-divergence using the parental data (Supplemental Material).
Analysis of factors associated with cis-regulatory divergence
We obtained Supplemental Table S3 from Kvitek et al. (2008) and calculated the corrected coefficient of variation ([1 + 1/4n] × COV) across the mean-centered expression coefficients for the 17 strains analyzed. The distributions of corrected COV were then compared among orthologs with significant reinforcing or opposing divergence at both regulatory levels. S. cer and S. par promoter (the 200 nt upstream of the TSS), 5′ UTR, CDS, and 3′ UTR sequences were aligned using DIALIGN-TX version 1.0.0 (Subramanian et al. 2008) and pairwise % divergence (1 − % identity) was calculated according to method four of Raghava and Barton (2006), which considers only internal but not terminal gaps. For correlations, pairwise tests, and multiple regressions, only orthologs with sufficient numbers of mapping reads to be tested for significance were analyzed. The multiple regression model was lm(|Sc/Sp mRNA or translational cis| ∼ Promoter %DIV + 5′ UTR %DIV + 3′ UTR %DIV + CDS %DIV), where “% DIV” stands for % divergence. The presence or absence of a TATA box or OPN in the promoter was determined for each gene in our data set represented in Tirosh et al. (2006) and Tirosh and Barkai (2008) and used to test for an association with increased absolute cis ratio using the Kruskal–Wallis rank-sum test. In order to analyze the effects of TATA boxes and OPNs individually, we analyzed genes containing either one or the other element, but not both, independently (as shown in Fig. 2C; Supplemental Fig. S9 shows the same analysis when not excluding orthologs that have both elements). As a measure of CUB, we obtained the codon bias index (CBI) values from the Saccharomyces Genome Database (SGD) (Cherry et al. 2012) for each ortholog with an SGD identifier. Because CBI is associated with mean mRNA fraction RPKM across alleles and replicates (Spearman's ρ = 0.615, P < 10−15), the relationship between absolute divergence in cis ratio was determined by analysis of covariance, including mean mRNA fraction RPKM as a covariate.
Detecting lineage-specific cis-regulatory divergence
Orthologs with significant cis-regulatory divergence at either level were divided into two categories based on the up-regulating parental allele and ranked based on the magnitude of their absolute cis ratio (from largest to smallest). In order to increase our power to detect selection among genes with reinforcing bias, we used the replicate averaged mRNA and translational cis ratios to identify reinforcing divergence among all orthologs that passed our threshold for analysis at both regulatory levels (e.g., 3665). Any replicates whose direction of reinforcement differed between replicates (<2%) were removed. Reinforcing orthologs were ranked as above using the sum of their log2 cis ratios. This resulted in three ranked gene sets consisting of S. cerevisiae and S. paradoxus biased orthologs: mRNA abundance, translation, and reinforcing.
We searched for lineage-specific bias among the following functional categories represented in the FunSpec database (Robinson et al. 2002): Gene Ontology (GO) biological process, GO molecular function, GO cellular component, MIPS functional category, MIPS phenotypes, MIPS complexes, MIPS protein classes, and PFAM domains. In order to detect lineage-specific bias within a gene set, we identified all functional categories containing at least 10 members in the set and determined whether significant bias existed in the direction of one or the other lineage using a χ2 “goodness of fit” test. Because many different categories were being tested, we determined the probability of observing a particular enrichment by permuting ortholog assignments and repeating the test 10,000 times, retaining the most significant P-value observed in each functional data set. A category specific FDR was obtained by asking how often a P-value of equal or greater significance would be observed in the permuted data. The test of bias was performed on three difference thresholds, using either the top 25 or 50% most biased orthologs along each parental lineage, or analyzing all biased orthologs. In the case in which a functional category was shared in two data sets and the test was performed on the exact same orthologs, only the category with the lowest FDR was reported.
The analysis of the data of Warringer et al. (2011) was performed on the growth rate measurement in Data Set S1. The S. cerevisiae BY4716 strain used in this study is isogenic to strain S288C, which was used for the comparison to S. paradoxus strain CBS432.
Identification of candidate 3′-UTR C-terminal extensions
The S. cerevisiae 3′ UTRs identified by Nagalakshmi et al. (2008) and sequence of equivalent length downstream from the stop codon of S. paradoxus orthologs were scanned for an in-frame stop codon (TAA, TAG, or TGA) at least 5 codons downstream from the canonical stop in both species. Orthologs with downstream in-frame stop codons in both species were retained for analysis (but see below). Because of the low number of reads mapping to 3′ UTRs, we applied several different criteria to identify instances of readthrough (Supplemental Table S4 lists all potential C-terminal extensions that at least meet the criteria for single-species translation; Supplemental Material). In the case of PDE2, a gene previously identified to experience functional readthrough (Namy et al. 2002), we identified a frameshift indel that extends the C-terminal extension to 32 amino acids in S. paradoxus as compared with 22 in S. cerevisiae. This required extending 81 bp of annotated 3′ UTR to at least 96 bp in S. paradoxus.
Statistics
All statistics were performed using R version 2.14.0 (R Core Team 2013). Kruskal–Wallis rank sum tests were performed using 10,000 permutations of the data as implemented in the “coin” package (Hothorn et al. 2008). FDRs for significant cis-regulatory divergence were calculated using the Benjaminin and Hochberg method (1995) using the p.adjust() command.
Data access
All raw sequencing reads have been submitted to the NCBI Sequence Read Archive (SRA; http://www.ncbi.nlm.nih.gov/sra) under accession number SRP028614. Raw expression data have been submitted to the NCBI Gene Expression Omnibus (GEO; http://www.ncbi.nlm.nih.gov/geo/) under accession number GSE50049.
Supplementary Material
Acknowledgments
We are indebted to the members of Patrick O. Brown's laboratory at Stanford, in particular, Dustin Hite and Dan Klass, for sharing resources, equipment, and advice. We also thank members of the Fraser and Petrov laboratories in addition to three anonymous reviewers for useful comments on earlier versions of this manuscript. This work was supported by an NSERC Postdoctoral Fellowship to C.G.A. and NIH grant 1R01GM097171-01A1. H.B.F. is a Sloan Fellow and Pew Scholar.
Author contributions: C.G.A. and H.B.F. designed the study. C.G.A. performed all experimental work and data analysis. C.G.A. and H.B.F. wrote the manuscript.
Footnotes
[Supplemental material is available for this article.]
Article published online before print. Article, supplemental material, and publication date are at http://www.genome.org/cgi/doi/10.1101/gr.165522.113.
References
- Akashi H 2003. Translational selection and yeast proteome evolution. Genetics 164: 1291–1303 [DOI] [PMC free article] [PubMed] [Google Scholar]
- Barrett RD, Hoekstra HE 2011. Molecular spandrels: Tests of adaptation at the genetic level. Nat Rev Genet 12: 767–780 [DOI] [PubMed] [Google Scholar]
- Bedford T, Hartl DL 2009. Optimization of gene expression by natural selection. Proc Natl Acad Sci 106: 1133–1138 [DOI] [PMC free article] [PubMed] [Google Scholar]
- Benjamini Y, Hochberg Y 1995. Controlling the false discovery rate: A practical and powerful approach to multiple testing. J R Stat Soc Ser B Methodol 57: 289–300 [Google Scholar]
- Bentele K, Saffert P, Rauscher R, Ignatova Z, Blüthgen N 2013. Efficient translation initiation dictates codon usage at gene start. Mol Syst Biol 9: 675. [DOI] [PMC free article] [PubMed] [Google Scholar]
- Bleackley MR, Young BP, Loewen CJ, MacGillivray RT 2011. High density array screening to identify the genetic requirements for transition metal tolerance in Saccharomyces cerevisiae. Metallomics 3: 195–205 [DOI] [PubMed] [Google Scholar]
- Brar GA, Yassour M, Friedman N, Regev A, Ingolia NT, Weissman JS 2012. High-resolution view of the yeast meiotic program revealed by ribosome profiling. Science 335: 552–557 [DOI] [PMC free article] [PubMed] [Google Scholar]
- Bullard JH, Mostovoy Y, Dudoit S, Brem RB 2010. Polygenic and directional regulatory evolution across pathways in Saccharomyces. Proc Natl Acad Sci 107: 5058–5063 [DOI] [PMC free article] [PubMed] [Google Scholar]
- Carroll SB 2005. Evolution at two levels: On genes and form. PLoS Biol 3: e245. [DOI] [PMC free article] [PubMed] [Google Scholar]
- Charneski CA, Hurst LD 2013. Positively charged residues are the major determinants of ribosomal velocity. PLoS Biol 11: e1001508. [DOI] [PMC free article] [PubMed] [Google Scholar]
- Cherry JM, Hong EL, Amundsen C, Balakrishnan R, Binkley G, Chan ET, Christie KR, Costanzo MC, Dwight SS, Engel SR, et al. 2012. Saccharomyces Genome Database: The genomics resource of budding yeast. Nucleic Acids Res 40: D700–D705 [DOI] [PMC free article] [PubMed] [Google Scholar]
- Cosnier B, Kwapisz M, Hatin I, Namy O, Hermann-Le Denmat S, Morillon A, Rousset JP, Fabret C 2011. A viable hypomorphic allele of the essential IMP3 gene reveals novel protein functions in Saccharomyces cerevisiae. PLoS ONE 6: e19500. [DOI] [PMC free article] [PubMed] [Google Scholar]
- Day DA, Tuite MF 1998. Post-transcriptional gene regulatory mechanisms in eukaryotes: An overview. J Endocrinol 157: 361–371 [DOI] [PubMed] [Google Scholar]
- de Sousa Abreu R, Penalva LO, Marcotte EM, Vogel C 2009. Global signatures of protein and mRNA expression levels. Mol Biosyst 5: 1512–1526 [DOI] [PMC free article] [PubMed] [Google Scholar]
- Denver DR, Morris K, Streelman JT, Kim SK, Lynch M, Thomas WK 2005. The transcriptional consequences of mutation and natural selection in Caenorhabditis elegans. Nat Genet 37: 544–548 [DOI] [PubMed] [Google Scholar]
- Dori-Bachash M, Shema E, Tirosh I 2011. Coupled evolution of transcription and mRNA degradation. PLoS Biol 9: e1001106. [DOI] [PMC free article] [PubMed] [Google Scholar]
- Drummond DA, Wilke CO 2008. Mistranslation-induced protein misfolding as a dominant constraint on coding-sequence evolution. Cell 134: 341–352 [DOI] [PMC free article] [PubMed] [Google Scholar]
- Dvir S, Velten L, Sharon E, Zeevi D, Carey LB, Weinberger A, Segal E 2013. Deciphering the rules by which 5′-UTR sequences affect protein expression in yeast. Proc Natl Acad Sci 110: E2792–E2801 [DOI] [PMC free article] [PubMed] [Google Scholar]
- Fogel S, Welch JW 1982. Tandem gene amplification mediates copper resistance in yeast. Proc Natl Acad Sci 79: 5342–5346 [DOI] [PMC free article] [PubMed] [Google Scholar]
- Fraser HB 2011. Genome-wide approaches to the study of adaptive gene expression evolution: Systematic studies of evolutionary adaptations involving gene expression will allow many fundamental questions in evolutionary biology to be addressed. BioEssays 33: 469–477 [DOI] [PubMed] [Google Scholar]
- Fraser HB, Moses AM, Schadt EE 2010. Evidence for widespread adaptive evolution of gene expression in budding yeast. Proc Natl Acad Sci 107: 2977–2982 [DOI] [PMC free article] [PubMed] [Google Scholar]
- Fraser HB, Babak T, Tsang J, Zhou Y, Zhang B, Mehrabian M, Schadt EE 2011. Systematic detection of polygenic cis-regulatory evolution. PLoS Genet 7: e1002023. [DOI] [PMC free article] [PubMed] [Google Scholar]
- Fraser HB, Levy S, Chavan A, Shah HB, Perez JC, Zhou Y, Siegal ML, Sinha H 2012. Polygenic cis-regulatory adaptation in the evolution of yeast pathogenicity. Genome Res 22: 1930–1939 [DOI] [PMC free article] [PubMed] [Google Scholar]
- Gebauer F, Hentze MW 2004. Molecular mechanisms of translational control. Nat Rev Mol Cell Biol 5: 827–835 [DOI] [PMC free article] [PubMed] [Google Scholar]
- Gilad Y, Oshlack A, Smyth GK, Speed TP, White KP 2006. Expression profiling in primates reveals a rapid evolution of human transcription factors. Nature 440: 242–245 [DOI] [PubMed] [Google Scholar]
- Gingold H, Pilpel Y 2011. Determinants of translation efficiency and accuracy. Mol Syst Biol 7: 481. [DOI] [PMC free article] [PubMed] [Google Scholar]
- Goodman DB, Church GM, Kosuri S 2013. Causes and effects of N-terminal codon bias in bacterial genes. Science 342: 475–479 [DOI] [PubMed] [Google Scholar]
- Hothorn T, Hornik K, van de Wiel MA, Zeileis A 2008. Implementing a class of permutation tests: The coin package. J Stat Software 28: 1–23 [Google Scholar]
- Ikemura T 1982. Correlation between the abundance of yeast transfer RNAs and the occurrence of the respective codons in protein genes. Differences in synonymous codon choice patterns of yeast and Escherichia coli with reference to the abundance of isoaccepting transfer RNAs. J Mol Biol 158: 573–597 [DOI] [PubMed] [Google Scholar]
- Ingolia NT. 2010. Genome-wide translational profiling by ribosome footprinting. In Methods in enzymology (ed. Weissman J, et al.), Vol. 470, pp. 119–142. Academic Press, Waltham, MA. [Google Scholar]
- Ingolia NT, Ghaemmaghami S, Newman JRS, Weissman JS 2009. Genome-wide analysis in vivo of translation with nucleotide resolution using ribosome profiling. Science 324: 218–223 [DOI] [PMC free article] [PubMed] [Google Scholar]
- Ingolia NT, Lareau LF, Weissman JS 2011. Ribosome profiling of mouse embryonic stem cells reveals the complexity and dynamics of mammalian proteomes. Cell 147: 789–802 [DOI] [PMC free article] [PubMed] [Google Scholar]
- Jungreis I, Lin MF, Spokony R, Chan CS, Negre N, Victorsen A, White KP, Kellis M 2011. Evidence of abundant stop codon readthrough in Drosophila and other metazoa. Genome Res 21: 2096–2113 [DOI] [PMC free article] [PubMed] [Google Scholar]
- Kertesz M, Wan Y, Mazor E, Rinn JL, Nutter RC, Chang HY, Segal E 2010. Genome-wide measurement of RNA secondary structure in yeast. Nature 467: 103–107 [DOI] [PMC free article] [PubMed] [Google Scholar]
- Khan Z, Bloom JS, Amini S, Singh M, Perlman DH, Caudy AA, Kruglyak L 2012. Quantitative measurement of allele-specific protein expression in a diploid yeast hybrid by LC-MS. Mol Syst Biol 8: 602. [DOI] [PMC free article] [PubMed] [Google Scholar]
- King MC, Wilson AC 1975. Evolution at two levels in humans and chimpanzees. Science 188: 107–116 [DOI] [PubMed] [Google Scholar]
- Kudla G, Murray AW, Tollervey D, Plotkin JB 2009. Coding-sequence determinants of gene expression in Escherichia coli. Science 324: 255–258 [DOI] [PMC free article] [PubMed] [Google Scholar]
- Kvitek DJ, Will JL, Gasch AP 2008. Variations in stress sensitivity and genomic expression in diverse S. cerevisiae isolates. PLoS Genet 4: e1000223. [DOI] [PMC free article] [PubMed] [Google Scholar]
- Landry CR, Lemos B, Rifkin SA, Dickinson WJ, Hartl DL 2007. Genetic properties influencing the evolvability of gene expression. Science 317: 118–121 [DOI] [PubMed] [Google Scholar]
- Langmead B, Trapnell C, Pop M, Salzberg SL 2009. Ultrafast and memory-efficient alignment of short DNA sequences to the human genome. Genome Biol 10: R25. [DOI] [PMC free article] [PubMed] [Google Scholar]
- Lemos B, Araripe LO, Fontanillas P, Hartl DL 2008. Dominance and the evolutionary accumulation of cis- and trans-effects on gene expression. Proc Natl Acad Sci 105: 14471–14476 [DOI] [PMC free article] [PubMed] [Google Scholar]
- Letzring DP, Dean KM, Grayhack EJ 2010. Control of translation efficiency in yeast by codon–anticodon interactions. RNA 16: 2516–2528 [DOI] [PMC free article] [PubMed] [Google Scholar]
- Man O, Pilpel Y 2007. Differential translation efficiency of orthologous genes is involved in phenotypic divergence of yeast species. Nat Genet 39: 415–421 [DOI] [PubMed] [Google Scholar]
- McDonald JH, Kreitman M 1991. Adaptive protein evolution at the Adh locus in Drosophila. Nature 351: 652–654 [DOI] [PubMed] [Google Scholar]
- Müller CA, Nieduszynski CA 2012. Conservation of replication timing reveals global and local regulation of replication origin activity. Genome Res 22: 1953–1962 [DOI] [PMC free article] [PubMed] [Google Scholar]
- Nagalakshmi U, Wang Z, Waern K, Shou C, Raha D, Gerstein M, Snyder M 2008. The transcriptional landscape of the yeast genome defined by RNA sequencing. Science 320: 1344–1349 [DOI] [PMC free article] [PubMed] [Google Scholar]
- Namy O, Duchateau-Nguyen G, Rousset JP 2002. Translational readthrough of the PDE2 stop codon modulates cAMP levels in Saccharomyces cerevisiae. Mol Microbiol 43: 641–652 [DOI] [PubMed] [Google Scholar]
- Pelechano V, Wei W, Steinmetz LM 2013. Extensive transcriptional heterogeneity revealed by isoform profiling. Nature 497: 127–131 [DOI] [PMC free article] [PubMed] [Google Scholar]
- Plotkin JB, Kudla G 2011. Synonymous but not the same: The causes and consequences of codon bias. Nat Rev Genet 12: 32–42 [DOI] [PMC free article] [PubMed] [Google Scholar]
- Qian W, Yang JR, Pearson NM, Maclean C, Zhang J 2012. Balanced codon usage optimizes eukaryotic translational efficiency. PLoS Genet 8: e1002603. [DOI] [PMC free article] [PubMed] [Google Scholar]
- R Core Team. 2013. R: A language and environment for statistical computing. R Foundation for Statistical Computing, Vienna, Austria [Google Scholar]
- Raghava GP, Barton GJ 2006. Quantification of the variation in percentage identity for protein sequence alignments. BMC Bioinformatics 7: 415. [DOI] [PMC free article] [PubMed] [Google Scholar]
- Rifkin SA, Kim J, White KP 2003. Evolution of gene expression in the Drosophila melanogaster subgroup. Nat Genet 33: 138–144 [DOI] [PubMed] [Google Scholar]
- Rifkin SA, Houle D, Kim J, White KP 2005. A mutation accumulation assay reveals a broad capacity for rapid evolution of gene expression. Nature 438: 220–223 [DOI] [PubMed] [Google Scholar]
- Robbins-Pianka A, Rice MD, Weir MP 2010. The mRNA landscape at yeast translation initiation sites. Bioinformatics 26: 2651–2655 [DOI] [PubMed] [Google Scholar]
- Robinson MD, Grigull J, Mohammad N, Hughes TR 2002. FunSpec: A web-based cluster interpreter for yeast. BMC Bioinformatics 3: 35. [DOI] [PMC free article] [PubMed] [Google Scholar]
- Rockman MV, Kruglyak L 2006. Genetics of global gene expression. Nat Rev Genet 7: 862–872 [DOI] [PubMed] [Google Scholar]
- Ruderfer DM, Pratt SC, Seidel HS, Kruglyak L 2006. Population genomic analysis of outcrossing and recombination in yeast. Nat Genet 38: 1077–1081 [DOI] [PubMed] [Google Scholar]
- Scannell DR, Zill OA, Rokas A, Payen C, Dunham MJ, Eisen MB, Rine J, Johnston M, Hittinger CT 2011. The awesome power of yeast evolutionary genetics: New genome sequences and strain resources for the Saccharomyces sensu stricto genus. G3 (Bethesda) 1: 11–25 [DOI] [PMC free article] [PubMed] [Google Scholar]
- Shah P, Ding Y, Niemczyk M, Kudla G, Plotkin JB 2013. Rate-limiting steps in yeast protein translation. Cell 153: 1589–1601 [DOI] [PMC free article] [PubMed] [Google Scholar]
- Singh J, Padgett RA 2009. Rates of in situ transcription and splicing in large human genes. Nat Struct Mol Biol 16: 1128–1133 [DOI] [PMC free article] [PubMed] [Google Scholar]
- Skelly DA, Merrihew GE, Riffle M, Connelly CF, Kerr EO, Johansson M, Jaschob D, Graczyk B, Shulman NJ, Wakefield J, et al. 2013. Integrative phenomics reveals insight into the structure of phenotypic diversity in budding yeast. Genome Res 23: 1496–1504 [DOI] [PMC free article] [PubMed] [Google Scholar]
- Subramanian AM, Kaufmann M, Morgenstern B 2008. DIALIGN-TX: Greedy and progressive approaches for segment-based multiple sequence alignment. Algorithm Mol Biol 3: 6. [DOI] [PMC free article] [PubMed] [Google Scholar]
- Tirosh I, Barkai N 2008. Two strategies for gene regulation by promoter nucleosomes. Genome Res 18: 1084–1091 [DOI] [PMC free article] [PubMed] [Google Scholar]
- Tirosh I, Barkai N 2011. Inferring regulatory mechanisms from patterns of evolutionary divergence. Mol Syst Biol 7: 530. [DOI] [PMC free article] [PubMed] [Google Scholar]
- Tirosh I, Weinberger A, Carmi M, Barkai N 2006. A genetic signature of interspecies variations in gene expression. Nat Genet 38: 830–834 [DOI] [PubMed] [Google Scholar]
- Tirosh I, Reikhav S, Levy AA, Barkai N 2009. A yeast hybrid provides insight into the evolution of gene expression regulation. Science 324: 659–662 [DOI] [PubMed] [Google Scholar]
- Tirosh I, Sigal N, Barkai N 2010. Divergence of nucleosome positioning between two closely related yeast species: Genetic basis and functional consequences. Mol Syst Biol 6: 365. [DOI] [PMC free article] [PubMed] [Google Scholar]
- True HL, Berlin I, Lindquist SL 2004. Epigenetic regulation of translation reveals hidden genetic variation to produce complex traits. Nature 431: 184–187 [DOI] [PubMed] [Google Scholar]
- Tsai IJ, Bensasson D, Burt A, Koufopanou V 2008. Population genomics of the wild yeast Saccharomyces paradoxus: Quantifying the life cycle. Proc Natl Acad Sci 105: 4957–4962 [DOI] [PMC free article] [PubMed] [Google Scholar]
- Tuller T, Veksler-Lublinsky I, Gazit N, Kupiec M, Ruppin E, Ziv-Ukelson M 2011. Composite effects of gene determinants on the translation speed and density of ribosomes. Genome Biol 12: R110. [DOI] [PMC free article] [PubMed] [Google Scholar]
- von der Haar T, Tuite MF 2007. Regulated translational bypass of stop codons in yeast. Trends Microbiol 15: 78–86 [DOI] [PubMed] [Google Scholar]
- Waldman YY, Tuller T, Keinan A, Ruppin E 2011. Selection for translation efficiency on synonymous polymorphisms in recent human evolution. Genome Biol Evol 3: 749–761 [DOI] [PMC free article] [PubMed] [Google Scholar]
- Warringer J, Zörgö E, Cubillos FA, Zia A, Gjuvsland A, Simpson JT, Forsmark A, Durbin R, Omholt SW, Louis EJ, et al. 2011. Trait variation in yeast is defined by population history. PLoS Genet 7: e1002111. [DOI] [PMC free article] [PubMed] [Google Scholar]
- Weiss KM 2008. Tilting at quixotic trait loci (QTL): An evolutionary perspective on genetic causation. Genetics 179: 1741–1756 [DOI] [PMC free article] [PubMed] [Google Scholar]
- Wittkopp PJ 2005. Genomic sources of regulatory variation in cis and in trans. Cell Mol Life Sci 62: 1779–1783 [DOI] [PMC free article] [PubMed] [Google Scholar]
- Wittkopp PJ, Kalay G 2011. Cis-regulatory elements: Molecular mechanisms and evolutionary processes underlying divergence. Nat Rev Genet 13: 59–69 [DOI] [PubMed] [Google Scholar]
- Wu L, Candille SI, Choi Y, Xie D, Jiang L, Li-Pook-Than J, Tang H, Snyder M 2013. Variation and genetic control of protein abundance in humans. Nature 499: 79–82 [DOI] [PMC free article] [PubMed] [Google Scholar]
- Zhou T, Gu W, Wilke CO 2010. Detecting positive and purifying selection at synonymous sites in yeast and worm. Mol Biol Evol 27: 1912–1922 [DOI] [PMC free article] [PubMed] [Google Scholar]
Associated Data
This section collects any data citations, data availability statements, or supplementary materials included in this article.