

Abstract
Recombination is a major determinant of adaptive and nonadaptive evolution. Understanding how the recombination landscape has evolved in humans is thus key to the interpretation of human genomic evolution. Comparison of fine-scale recombination maps of human and chimpanzee has revealed large changes at fine genomic scales and conservation over large scales. Here we demonstrate how a fine-scale recombination map can be derived for the ancestor of human and chimpanzee, allowing us to study the changes that have occurred in human and chimpanzee since these species diverged. The map is produced from more than one million accurately determined recombination events. We find that this new recombination map is intermediate to the maps of human and chimpanzee but that the recombination landscape has evolved more rapidly in the human lineage than in the chimpanzee lineage. We use the map to show that recombination rate, through the effect of GC-biased gene conversion, is an even stronger determinant of base composition evolution than previously reported.
In recent years, significant progress has been made in elucidating the genome-wide patterns of recombination. Until recently, interest has focused on humans, and multiple recombination maps have been published describing these patterns. Human recom-bination maps are based on either parent-offspring transmission (Kong et al. 2002, 2010), on patterns of linkage disequilibrium (LD) (McVean et al. 2004; Myers et al. 2005), or exploiting the fact that African Americans are genetic mixtures of African and European ancestry (Hinch et al. 2011; Wegmann et al. 2011). These have revealed that, to a large extent, recombination occurs in hotspots ∼1–2 kb wide where recombination rates can be orders of magnitude larger than in the surrounding sequence. Comparison of human recombination maps with a recent map based on polymorphism data from 10 Western chimpanzees (Auton et al. 2012) shows that the locations of hotspots differ entirely between the two species, implying that recombination hotspots are highly transient (McVean et al. 2004; Myers et al. 2005; Ptak et al. 2005; Winckler et al. 2005). Larger agreement of recombination rates on a mega-base scale, however, suggests that the regional density and/or intensity of hotspots are conserved, and that large-scale variation is determined by other factors.
The possible effect of recombination on the neutral substitution process has been much debated. Empirical evidence across metazoans (Capra and Pollard 2011), including humans (Duret and Arndt 2008) and chimpanzees (Auton et al. 2012), shows a correlation of recombination rate and substitution bias favoring fixation of GC variants. A consensus emerges that GC-biased gene conversion (gBGC) is driving this effect through a preference for GC over AT bases in repair of mismatches in hetero-duplex tracts formed during recombination. However, previously reported correlations between recombination rate and such substitution bias are likely underestimates of the true correlation. This is in part due to the uncertainty in estimating recombination rates, and in part because current recombination maps mainly measure very recent recombination that may not represent the effect of substitution on the entire human or chimpanzee branches. To better quantify the effect of recombination rate on substitution processes, estimates of recombination on a larger time scale are required.
To further our understanding of how patterns of recombination evolve in response to genomic changes, and how genome evolution in turn is affected by recombination, we need to effectively associate genomic change with change in recombination rate in individual species. This has not been possible, as it would require knowledge of the recombination patterns in the common ancestor to such species. Here we demonstrate how a recombination map of an ancestral species can be created, allowing us to study how recombination has evolved in the descendant species.
Along a genomic alignment of species, divergence times differ due to segregating polymorphism in the ancestral species. In some cases, the population size of the ancestral species is sufficiently large and the time span between two speciation events sufficiently small that ancestral polymorphism may lead to gene trees with topologies different from the species tree. This phenomenon is termed incomplete lineage sorting (ILS) and implies that segments of the genome will have alternative genealogies. The transition from a segment sharing one genealogy to a segment sharing a different genealogy identifies a recombination event decoupling the genealogical paths of the two segments. This circumstance allows recombination patterns of the ancestral species to be directly exposed by evolutionary analysis of single genomes from four closely related species. Full genome sequences are available for human, chimpanzee, gorilla, and orangutan (International Human Genome Sequencing Consortium 2001; The Chimpanzee Sequencing and Analysis Consortium 2005; Locke et al. 2011; Scally et al. 2012), and these are easily aligned. ILS is well-established between human, chimpanzee, and gorilla (Scally et al. 2012), and we have previously shown that a coalescent hidden Markov model can accurately discern segments of aligned genomes sharing a certain species relationship (Hobolth et al. 2007; Dutheil et al. 2009).
Here we present an ILS-based recombination map of the common ancestor of humans and chimpanzees. This lets us resolve the differences between humans and chimpanzees into the changes that occurred in each species since their divergence. We test whether changes in recombination rate occur at the same pace in these two species and identify the changes in recombination rate that result from large-scale genomic events in humans and chimpanzees. Finally, we show that our ancestral map is especially suited to address the effect of recombination on genome-wide substitution patterns.
Results
A recombination map of the human–chimpanzee ancestor
The recombination process in the human–chimpanzee ancestor is revealed from the pattern of change in genealogy along the multispecies alignment. The hidden Markov model applied distinguishes four genealogies with three different topologies (Supplemental Text S1). Each change between these genealogies represents a crossover event in the ancestral species, and we are able to confidently infer more than a million such crossover events. These events are used to reconstruct the recombination map of the human–chimpanzee ancestor by calibrating the density of identified crossovers to 1 cM/Mb (Fig. 1). On the chromosome scale, the ancestral map shows an increase in rate toward the ends of chromosomes as observed in sex-averaged maps for humans and chimpanzees. Comparing the ancestral map with the LD-based human (HapMap, Myers et al. 2005) and chimpanzee (PanMap, Auton et al. 2012) recombination maps separates the evolution of the recombination rate in the human and chimpanzee lineages, and we can identify regions where the ancestral recombination rate is closer to either of the extant species (Fig. 1; Supplemental Fig. S4). On large scales, the distribution of recombination in the ancestral map is very similar to both human and chimpanzee maps.
Figure 1.

Recombination map for the human–chimpanzee ancestor. The inferred recombination map normalized to a global mean of one. Each gray line represents a chromosome, and the impulses over each line represent the recombination rates for nonoverlapping 1-Mb bins. The vertical distance between chromosomes represents 5 cM/Mb. Red (blue) blocks painted on each chromosome correspond to 2-Mb regions where mean recombination rate in the human (chimpanzee) map is most similar to the ancestral map.
To reveal the expected properties of the ancestral map, we simulate 10,000 ancestral recombination graphs. We confirm that our map reflects recombination events predominantly occurring in the ancestor species (61%) (Fig. 2A). The contribution from recombination events not falling between the two speciation times occurs in the proximal ends of the human, chimpanzee, and gorilla branches as well as in the branch of the human–chimpanzee–gorilla ancestor (Fig. 2B). These events are separate from the recent recombination events measured in human and chimpanzee recombination maps.
Figure 2.
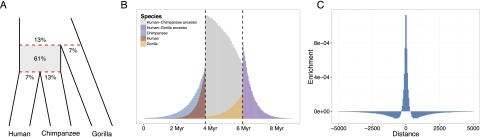
Distribution in time and accuracy of inferred recombination events. (A) Species tree with proportions of simulated crossover events that result in change between genealogies in our model, falling between and outside the speciation events (shown in red). (B) Distribution in time of simulated crossover events as in A, partitioned according to the branch of the species tree on which they occur. Vertical dashed lines indicate the speciation times used in simulations. (C) The distribution of distance between called and simulated crossover events with randomized background subtracted (distance truncated at 5000). Individual crossover points were called on alignments generated from simulations. Randomized background was obtained by randomly permuting called events prior to alignment to simulated events.
The performance of our method was evaluated by applying our method to 10,000 100-kb alignments generated from the 10,000 simulated ancestral recombination graphs. In total, 1,234,391 events are simulated, of which 422,044 were called. To evaluate the overlap between the series of simulated and called recombination events, the two series must be aligned. A global alignment was produced using a Needleman-Wunsch algorithm with a match penalty equal to the sequence distance between simulated and called events. The choice of gap penalty controls the number of called events in alignment with simulated events, and thus influences the measured sensitivity and specificity. To evaluate performance in the face of this problem, we chose a gap penalty so large (1 × 10⁶) that all inferred events are forced into alignment with a simulated event. This mimics analysis of real data where all called events are considered true and render sensitivity the ratio of called and simulated events, which is 34%. To evaluate the accuracy (specificity) of called events, we compute the distribution of the sequence distance between each called event and the simulated event to which it is aligned. Of the 422,044 called events, 33% are correctly predicted as transitions between simulated topologies, and 82% of these are predicted within ±200 bp of the simulated event. Another 39% of called events only predict the simulated topology on one side of the event, likely because a neighboring event is not called, and 79% of these are called within ±200 bp. Of the remaining 28% of called events, 73% are within ±200 bp of a simulated event.
The alignment of simulated and inferred events will minimize the distance between simulated and called events even on uncorrelated series of events. To address this, the distribution of distance between called and simulated events was compared with a background distribution produced from alignments where the positions of called events were randomly shuffled. The difference between the two distributions reflects the enrichment of correctly predicted events close to simulated events (Fig. 2C). We further simulated five hundred 100-kb alignments for each of the recombination rates: 0.2 × 10⁻⁸, 0.4 × 10⁻⁸, 0.5 × 10⁻⁸, 0.8 × 10⁻⁸, 1 × 10⁻⁸, 2 × 10⁻⁸, 3 × 10⁻⁸, and observed that the number of called events is an almost linear function of simulated recombination rates <1 cM/Mb, but that a lower sensitivity to high rates suggests that our estimates of high rates on real data may be conservative (Supplemental Fig. S3).
Large-scale changes in humans caused by chromosomal rearrangements
By separately addressing change in recombination rate in human and chimpanzee, we can directly determine the effect of large-scale chromosomal rearrangements (Supplemental Fig. S4). Two major chromosomal events have been fixed in humans. The ancestral chromosomes 2a and 2b fused to form the human chromosome 2, resulting in a broad-scale decrease in human recombination rate across the fusion region (Fig. 3A; Supplemental Fig. S5). The other major chromosomal event, a pericentric inversion on chromosome 18, has resulted in a marked increase in recombination rate across the inverted region (Fig. 3B; Supplemental Fig. S6). Both examples highlight the effect of chromosomal position on recombination rate. In contrast, the large inversions in the chimpanzee lineage have not led to characteristic changes in recombination rate. These inversions may be more recent or may have resulted in smaller overall changes in proximity to chromosome ends. The mean recombination rate of entire chromosomes is very similar between maps, with the above-mentioned exceptions (Supplemental Fig. S7).
Figure 3.

Large-scale changes following chromosomal rearrangements. (A) Ideogram of human chromosome 2 showing changes in recombination rate in humans and chimpanzees. Each impulse represents ancestral rate minus human rate (red) or ancestral rate minus chimpanzee rate (blue) in 2-Mb bins. The dotted vertical line marks the point of fusion of the ancestral chromosomes 2a and 2b. (B) Ideogram of human chromosome 18. The dashed line encloses the region of inversion in the human lineage.
Faster evolution of recombination in humans
The mean absolute difference between human, chimpanzee, and ancestral recombination rates decreases logarithmically as a function of window size, and the ancestral recombination rate in regions without chromosomal rearrangements is consistently more similar to human and chimpanzee rates than these are to each other (Fig. 4A). This is also reflected by the Spearman (rank) correlations of rate between the same regions of the three maps (Fig. 4B; Supplemental Figs. S8, S9). Here the effect is significant on the 10-kb and 40-kb scales, showing that the ancestral map represents an intermediate between the two maps, even at fine scales.
Figure 4.

The human–chimpanzee ancestor map compared with the human and chimpanzee maps. (A) Mean absolute difference in recombination rate between the noninverted part of the ancestral, human, and chimpanzee maps (excl. chromosome 2) for nonoverlapping bins quadrupling from 10 kb to 2.56 Mb. Error bars indicate standard error of mean obtained by bootstrapping. (B) Spearman correlation between the noninverted part of the ancestral, human, and chimpanzee maps (excl. chromosome 2) for bins as in A. Confidence intervals for individual correlations and significance of difference between correlations were obtained by bootstrapping. The only comparisons not significant (P-values > 0.05) are ancestral–chimpanzee vs. ancestral–human for 40 kb and 2.56 Mb, and ancestral–human vs. human–chimpanzee for 640 kb and 2.56 Mb.
Across scales, the ancestral recombination map is more similar to, and correlates more strongly with, the chimpanzee map, suggesting a more rapid evolution of recombination in the human lineage than in the chimpanzee lineage. At the 10-kb scale this pattern is not observed for the rank correlation. This could indicate slower evolution in humans. However, the fact that the ancestral–human correlation remains substantially larger than the human–chimpanzee correlation suggests that the exception may result from a larger amount of noise in the chimpanzee map at the finest scale. This is not unexpected as the chimpanzee map is produced from a smaller amount of polymorphism data than is the human map (Auton et al. 2012).
The effective population size of chimpanzees is larger than that of humans. This implies that a recombination map produced from diversity data will on average reflect older recombination events in chimpanzees than in humans. In addition, the larger population size of chimpanzees implies that sequence fragments separated by a recombination event will remain longer as separate linages before they coalesce back into one lineage. As a consequence, recombination events measured in the ancestral map may have occurred earlier in the chimpanzee branch than in the human branch as shown in Figure 2B. An ILS-based ancestral map is thus expected to overlap LD-based maps in chimpanzees more than in humans. To evaluate the extent to which this may explain the larger similarity between the ancestral and chimpanzee maps, we calculate the theoretical overlap of recombination events affecting diversity patterns of an extant species with those measured by an ILS-based ancestral map (see Supplemental Text S3). Assuming effective population sizes of 20,000 in chimpanzees and 10,000 in humans, we find that 1.5% of chimpanzee recombination events and 0.02% of human events susceptible of being incorporated into an LD-based map will also be available to an ILS-based ancestral map. The difference in overlap (∼1.5%) is an order of magnitude smaller than the difference in similarity of the human and chimpanzee maps to the ancestral map (∼18%), thus not explaining the faster change in recombination patterns on the human branch.
As the recombination events included in the ancestral map stretches longer into the chimpanzee than the human branch, the ancestral map will on average be less divergent from present chimpanzees than from present humans. To assess the magnitude of this effect and its contribution to the smaller difference between the chimpanzee and ancestral maps, we computed the evolutionary divergence time from recombination events measured in the ancestral map (as shown in Fig. 2B) to extant humans and to extant chimpanzees (Supplemental Fig. S10). The relative difference in mean divergence time to humans and chimpanzee is 0.2% and is thus expected to contribute only marginally to the observed differences.
Fine-scale comparison to human and chimpanzee maps
We do not identify recombination hotspots in the ancestral map, as recombination rates on the 2-kb scale vary only by a single order of magnitude. This is expected if the locations of hotspots have changed continually over the more than two million years where recombination is measured. In this case, we do not expect our map, which presents an average over this process, to exhibit the characteristic separation between hotspots and non-hotspots seen in the chimpanzee and human maps that monitor much shorter time spans. Furthermore, compared with human and chimpanzee maps based on polymorphism, which are able to estimate more than one recombination event between adjacent sites, our approach can estimate one event only as indicated from a change in topology.
However, if humans or chimpanzees share locations of hotspots with their common ancestor, we expect an enrichment of called recombination events at the locations of human and chimpanzee hotspots (here called as regions with reported recombination rates >10 cM/Mb). We compare 2-kb regions centered at hotspots with flanking 10-kb regions 10 kb away from the hotspots and find 3% enrichment at human hotspots and 9% enrichment at chimpanzee hotspots. Although we cannot rule out that hotspot locations are conserved to some extent, it is a more parsimonious explanation that a small proportion of human and chimpanzee recombination events is also measured by the ancestral map. The contribution of human and chimpanzee recombination events to the ancestral map required to fully explain these enrichments is 0.4% from human and 1.2% from chimpanzee. This is readily calculated as (a − 1)/(e − 1), where a and e are the ancestral and extant recombination rates at hotspot locations relative to their flanking regions. This direct measure of overlap further suggests that the difference in contribution from human and chimpanzee maps may be even smaller than the theoretical estimate given above.
Recombination strongly affects substitution bias in the human–chimpanzee ancestor
To address the magnitude of GC-biased gene conversion (gBGC) in the human–chimpanzee ancestor, we calculated the equilibrium GC content, GC*, from substitution patterns observed in the alignment. We observed strong (Pearson) correlation between non-CpG GC* and recombination rate in the ancestor (R2: 0.64) (Fig. 5A) compared with the corresponding correlations in human and chimpanzee (R2: 0.46 and 0.39) (Supplemental Fig. S11). If the chimpanzee map, built from only 10 individuals, is noisier than the human map, this could explain the lower correlations in chimpanzee. The same correlations at CpG sites are lower for all three species (R2: 0.50, 0.37, and 0.30).
Figure 5.

The effect of recombination on evolution of GC content in the human–chimpanzee ancestor. (A) Correlation between ancestral GC* and ancestral recombination rate in 1-Mb bins in green for non-CpG sites and yellow for CpG sites. (B) Mean GC* as a function of recombination rate for the ancestral map (green), the human map (red), and the chimpanzee map (blue). Error bars represent confidence interval of mean obtained by bootstrapping. Mean rates based on <10 observations are not shown. (C) Human GC* as a function of both ancestral and human recombination rate in bins of 0.5 cM/Mb. Each cell in the grid corresponds to an interval of ancestral and human recombination rate and is colored in accordance with mean GC* in the associated 1-Mb bins.
GC content in the ancestor is correlated to both recombination rate (R2: 0.24) and GC* (R2: 0.48), and multivariate regression shows that recombination rate and GC content together explain a larger portion of the variance in GC* (R2: 0.75) than recombination rate does alone. However, if GC* was driven by GC content, we would expect a larger correlation to GC content than to recombination rate. This is clearly not the case, which supports earlier findings (Duret and Arndt 2008).
The effect of gBGC on GC variants is not distinguishable from that of selection in the diffusion limit (Nagylaki 1983) and is thus predicted to be stronger in species with larger effective population sizes (Duret and Arndt 2008). The effective population size of the human–chimpanzee ancestor is estimated to be 73,000 (Scally et al. 2012) (assuming a mutation rate of 1 × 10⁻⁹ per year and a generation time of 20 yr) compared with ∼10,000 for humans, and we are thus in an excellent position to test this prediction in two very closely related species. As expected, we observe a larger mean ancestral GC* of 0.47 in the ancestral lineage versus 0.41 for both human and chimpanzee lineages. As expected, we also observe that GC* increases more rapidly with increased recombination rate owing to the larger efficiency of selection in a larger population (Supplemental Fig. S11). In Figure 5B, we plot mean GC* in 10-kb windows as a function of recombination rate. The relationship between recombination rate and GC* is strikingly different in the human–chimpanzee ancestor. The much greater slope spanning a larger interval of GC* reveals recombination as a stronger driving force for genomic GC content than previously inferred from intra-specific studies.
Our recombination map is not only highly informative of the substitution process in the ancestral lineage but also in the human and chimpanzee lineages, as it represents the recombination landscape at the other endpoint of these branches (Fig. 1A). On the 1-Mb scale for non-CpG sites, the ancestral map explains human GC* almost as well as the human map (R2: 0.31), and even explains chimpanzee GC* slightly better than the chimpanzee map (R2: 0.43). Using both ancestral and extant maps to explain human and chimpanzee GC* raises R2 to 0.49 and 0.48. Furthermore, human GC* in the 10% 1-Mb windows with the highest ancestral recombination rate is almost 20% higher (0.46) than in windows with the 10% in the lowest rate (0.39) (Fig. 5C). Indeed, fitting a linear model explaining human GC* by both ancestral and human recombination rates reveals GC* as a function of both rates (Supplemental Fig. S13).
The correlation between recombination rate and GC* in all three species makes GC* a proxy for relative recombination rate. This is nicely illustrated at the fusion point on chromosome 2 where we observe a peak in GC* in all three species (Supplemental Fig. S14), as previously reported for humans (Dreszer et al. 2007). While GC* depends on the recombination rate, the estimation of GC* is independent of the estimation of the recombination rate and thus not affected by any biases imposed by differences in the way recombination is inferred in the three maps. To independently support our finding that evolution of recombination has been more rapid in the human lineage, we therefore calculate the Pearson correlation of ancestral GC* to both human and chimpanzee GC*. We confirm that the correlation between ancestral and human GC* is indeed smaller than that between ancestral and chimpanzee GC* (Fig. 6; Supplemental Fig. S15).
Figure 6.

Correlation between GC* in noninverted regions (excl. chromosome 2) for the three species using the same bins as in Figure 4. The ancestral–chimpanzee correlations are significantly larger than the ancestral–human correlations for the 160-kb and 640-kb bins (evaluated using bootstrapping).
Discussion
We have shown that the existence of ILS allows for construction of highly resolved recombination maps without polymorphism data. This approach should prove useful for inferring common maps of closely related species from just four full genome sequences. The resulting map is derived from individual accurately identified crossover events. In this respect it differs from polymorphism-based maps that infer local recombination rates from linkage disequilibrium patterns between single-nucleotide polymorphisms. However, the main property that sets the ancestral map apart from maps of extant species is the time scale on which recombination is measured. The polymorphism-based extant maps cover the recent history of the two species with increased sensitivity to very recent recombination strongly affected by current hotspot locations. In contrast, our ancestral recombination map measures recombination on the entire branch of the species tree that represents the ancestral species. On this time scale, hotspots may have changed location several times (Jeffreys et al. 2013). Our ancestral map presents an average over this process at a cost to lower sensitivity to the effect of individual hotspots. However, the observation that the ancestral map shows a stronger correlation to the human and chimpanzee maps than these do to each other, even at the finest scales, indicates that our map is sensitive to fine-scale variation in recombination rate at the level of hotspots. Although we do not identify hotspots, we report a small enrichment of called events at the locations of human and chimpanzee hotspots. This may be explained by the expected contribution from human and chimpanzee recombination events to the ancestral map, primarily manifested at hotspots, suggesting that the turnover of hotspots in primates is faster than the divergence time of humans and chimpanzees.
We observe that the ancestral map shows a smaller difference in rate and correlates more strongly with the chimpanzee than with the human map across scales suggestive of more rapid evolution in humans. One possible explanation could be a more rapid evolution of PRDM9 DNA-binding motifs on the human linage. The PRDM9 protein plays an important role in the definition of recombination hotspots by binding to sequence motifs in the genome (Baudat et al. 2010; Myers et al. 2010; Parvanov et al. 2010). Although DNA-contacting residues of this protein are under positive selection (Oliver et al. 2009), recent findings indicate that the hyper-mutability of the DNA-contacting zinc-finger array can explain the rapid evolution of fine-scale recombination patterns (Jeffreys et al. 2013). This report also shows that destabilizer alleles of PRDM9 influence the instability of the zinc-finger array of both alleles in heterozygous males. We hypothesize that if the effective population size was generally smaller in the human than in the chimpanzee lineage (Prüfer et al. 2012; Prado-Martinez et al. 2013), the human population would maintain a higher load of destabilizer variants, increasing the rate at which PRDM9 evolves. In addition, negative selection constraining mechanisms that directly or indirectly determine recombination patterns would be less effective in a smaller population. However, considering that only one-third of recombination events occur in hotspots (Kong et al. 2010) and that the ancestral recombination map is less sensitive to hotspots, the observed effect may be attributed to the evolution of other, yet unknown, mechanisms controlling variation in local recombination rate.
In two cases, the large-scale chromosomal rearrangements between human and chimpanzee have resulted in prominent changes in recombination rate. This can be directly observed as differences from the ancestral map separating recombination rate change in the two species. We believe that our approach will be a valuable tool in the study of closely related species showing more rearrangements, allowing the effects of genomic sequence and chromosomal position to be isolated.
The ancestral map lets us track the effect of recombination on substitution patterns on an evolutionary time scale. We observe a larger effect of recombination on GC*, attributable to the larger effective population size of human–chimpanzee population increasing the effect of gBGC. We also observe a stronger correlation between recombination and GC*. It is not likely that this stronger correlation arises because GC* is better determined in the ancestor, as the number of recorded substitutions used to calculate GC* is larger on the human and chimpanzee branch (8,055,009 and 8,588,980) than on the ancestral branch (3,037,486). The stronger correlation may result in part from a larger overlap in time of counted substitutions and measured recombination rates. Assuming the speciation times and population sizes reported in Scally et al. (2012), the interval where ancestral recombination is measured overlaps ∼25% of the ancestral branch where substitutions are counted (Supplemental Text S4). In comparison, the human and chimpanzee recombination maps are expected to overlap a much smaller proportion of the substitutions counted on their respective branches. In addition, the recombination maps describe recombination over very different time scales. The LD-based extant maps cover the recent history of the two species with increased sensitivity to very recent recombination. At the fine scale, such recent rates are strongly affected by transient hotspot activity that is only weakly correlated to long-term substitution processes. In contrast, our ancestral recombination map represents an average recombination rate >2 Myr. Although our map is a much stronger predictor of GC* than the human map, the expected statistical uncertainty of rate estimates suggests that the true correlation is significantly higher.
Methods
Preparation of alignment
We use the EPO alignment of human, chimpanzee, gorilla, and orangutan produced by the Gorilla Sequencing Consortium (Scally et al. 2012; Supplemental Material). To improve data quality, the alignment is filtered to remove regions of low sequencing quality and regions with a large proportion of gaps or uncalled bases. All alignment blocks that do not contain one and only one sequence for each of the four species are discarded. Then, all alignment columns of only gaps in human, chimpanzee, and gorilla sequence are removed. To take base call uncertainty into account, we then slide a 10-nt window by 1 nt. If the mean quality score is <7, the window is removed and the alignment block is split accordingly. To further filter for gap content, we slide a window of size 50 by 1 nt. If a window contains ≥49 gaps, it is removed and the alignment block is split accordingly. Blocks <300 are removed. The resulting alignment blocks are joined if <100 bases apart (and padded accordingly with “N”), or split where they contain runs of >100 alignment columns of all “N.”
Inference of recombination events
An independent coalescent hidden Markov model (CoalHMM) (Hobolth et al. 2007; Dutheil et al. 2009; Supplemental Text S1) analysis is then run on each mega base of alignment blocks. CoalHMM returns the posterior probability of each hidden state at each position in the alignment. Crossover events are inferred as transitions between states along the alignment. Specifically, we identify a crossover event in the middle of each interval flanked by alignment positions supporting different states with a posterior probability >0.5. We infer a total of 1,059,537 crossover events. Recombination rates, in bins of 10 kb in human coordinates (hg19), are computed as the number of inferred crossover events per column of analyzed alignment. To obtain absolute values of recombination rate comparable to existing recombination maps, reported rates are normalized to a global mean of 1 cM/Mb.
Comparison to human and chimpanzee maps
The HapMap recombination map (Myers et al. 2005) was downloaded from the HapMap website (2011-01_phaseII_B37), and the mean rate in 10-kb bins (in hg19 coordinates) was computed. The PanMap recombination map (Auton et al. 2012) was downloaded from the PanMap website. Each interval assigned to a recombination rate was lifted to hg19 coordinates using the liftOver tool (Hinrichs et al. 2006), and the mean rate in 10-kb bins was computed. To avoid bias from differences in coverage, all 10-kb bins where the recombination rate is zero or missing in any of the three maps are considered missing data in all three maps. The resulting maps were then normalized to a global mean of 1 cM/Mb. For analyses of large-scale variation, we generated a data set representing nonoverlapping 1-Mb and 2-Mb windows in hg19 coordinates. Only windows where the alignment analyzed by CoalHMM makes up at least 30% of the window were included. Further, 1-Mb bins with <500,000 and 2-Mb bins with <900,000 alignment columns used to calculate substitution rates were discarded.
Simulations
Ancestral recombination graphs were simulated using the CoaSim package (Mailund et al. 2005). We simulated 10,000 ancestral recombination graphs and generated 100-kb alignments using the Bio++ package (Dutheil et al. 2006) using a recombination rate of 1 × 10⁻⁸ per generation and a mutation rate of 1 × 10⁻⁹ per year. We use constant population sizes along each branch of the species tree. Extant population sizes were set to 10,000 for human, 20,000 for chimpanzee, and 20,000 for gorilla. Generation time was set to 20 yr. Population sizes for the human–chimpanzee and the human–chimpanzee–gorilla ancestors were set to 73,200 and 39,000, and split times to 3.7 Myr and 5.95 Myr as reported by Scally et al. (2012). The distribution of crossover events that may be detected by our model was obtained by recording the time of occurrence of crossover events in the simulated ancestral recombination graphs that separate the genealogies in our model.
Correlation of ancestor, human, and chimpanzee maps
Approximate coordinates of major inversions are obtained from the chimpanzee genome paper (The Chimpanzee Sequencing and Analysis Consortium 2005) and Newman et al. (2005) and mapped to hg19 coordinates using the liftOver tool (Hinrichs et al. 2006). For analysis of correlation between maps, we apply the Spearman correlation. This is less sensitive than the Pearson correlation but robust in violations of multi-normality observed in comparison of rates on fine scales. Prior to calculation of Spearman correlations, regions of inversions and noninversions are separated and the subsets are renormalized to a mean rate of 1 cM/Mb. Correlation of rates across nonoverlapping bins is then calculated for pairs of maps.
Substitution statistics
We identified AT to GC substitutions and the AT background on the human–chimpanzee branch and on the human and chimpanzee branches. Only alignment columns explained by a single substitution were retained. AT substitutions were called in the human–chimpanzee ancestor if human and chimp agree in G or C and gorilla and orangutan agree in A or T. AT background was obtained as the number of sites where gorilla and orangutan agree in A or T. AT substitutions on the human and chimpanzee branches were only called if all other species agreed in the alternative. AT background was obtained as the number of such sites where the three other species agree. GC to AT substitutions and GC background were obtained in the same way, although separately for CpG and non-CpG sites. This simple approach is taken to allow alignment columns supporting ILS genealogies to be ignored, as these are not informative of the substitution process in the human–chimpanzee ancestor. The observed substitution bias, GCflux, is calculated as the AT to GC over GC to AT substitution rate. The equilibrium GC content resulting from this bias, GC*, is calculated as GCflux/(1 + GCflux).
Data access
The recombination map is available in the Supplemental Material and at http://birc.au.dk/software/hcmap.
Supplementary Material
Acknowledgments
We thank Laurent Duret, Nicolas Galtier, Gilean McVean, Gerton Lunter, and Adam Siepel for discussions and valuable comments. The research was funded by The Danish Council for Independent Research, Natural Sciences, Grant nos. 09-065923 and 12-125062.
Footnotes
[Supplemental material is available for this article.]
Article published online before print. Article, supplemental material, and publication date are at http://www.genome.org/cgi/doi/10.1101/gr.158469.113.
References
- Auton A, Fledel-Alon A, Pfeifer S, Venn O, Ségurel L, Street T, Leffler EM, Bowden R, Aneas I, Broxholme J, et al. 2012. A fine-scale chimpanzee genetic map from population sequencing. Science 336: 193–198 [DOI] [PMC free article] [PubMed] [Google Scholar]
- Baudat F, Buard J, Grey C, Fledel-Alon A, Ober C, Przeworski M, Coop G, de Massy B 2010. PRDM9 is a major determinant of meiotic recombination hotspots in humans and mice. Science 327: 836–840 [DOI] [PMC free article] [PubMed] [Google Scholar]
- Capra JA, Pollard KS 2011. Substitution patterns are GC-biased in divergent sequences across the metazoans. Genome Biol Evol 3: 516–527 [DOI] [PMC free article] [PubMed] [Google Scholar]
- The Chimpanzee Sequencing and Analysis Consortium. 2005. Initial sequence of the chimpanzee genome and comparison with the human genome. Nature 437: 69–87 [DOI] [PubMed] [Google Scholar]
- Dreszer TR, Wall GD, Haussler D, Pollard KS 2007. Biased clustered substitutions in the human genome: The footprints of male-driven biased gene conversion. Genome Res 17: 1420–1430 [DOI] [PMC free article] [PubMed] [Google Scholar]
- Duret L, Arndt PF 2008. The impact of recombination on nucleotide substitutions in the human genome. PLoS Genet 4: e1000071. [DOI] [PMC free article] [PubMed] [Google Scholar]
- Dutheil J, Gaillard S, Bazin E, Glemin S, Ranwez V, Galtier N, Belkhir K 2006. Bio++: A set of C++ libraries for sequence analysis, phylogenetics, molecular evolution and population genetics. BMC Bioinformatics 7: 188. [DOI] [PMC free article] [PubMed] [Google Scholar]
- Dutheil JY, Ganapathy G, Hobolth A, Mailund T, Uyenoyama MK, Schierup MH 2009. Ancestral population genomics: The coalescent hidden Markov model approach. Genetics 183: 259–274 [DOI] [PMC free article] [PubMed] [Google Scholar]
- Hinch AG, Hinch AG, Tandon A, Tandon A, Patterson N, Patterson N, Song Y, Song Y, Rohland N, Rohland N, et al. 2011. The landscape of recombination in African Americans. Nature 476: 170–175 [DOI] [PMC free article] [PubMed] [Google Scholar]
- Hinrichs AS, Karolchik D, Baertsch R, Barber GP, Bejerano G, Clawson H, Diekhans M, Furey TS, Harte RA, Hsu F, et al. 2006. The UCSC Genome Browser Database: Update 2006. Nucleic Acids Res 34: D590–D598 [DOI] [PMC free article] [PubMed] [Google Scholar]
- Hobolth A, Christensen OF, Mailund T, Schierup MH 2007. Genomic relationships and speciation times of human, chimpanzee, and gorilla inferred from a coalescent hidden Markov model. PLoS Genet 3: e7. [DOI] [PMC free article] [PubMed] [Google Scholar]
- International Human Genome Sequencing Consortium. 2001. Initial sequencing and analysis of the human genome. Nature 409: 860–921 [DOI] [PubMed] [Google Scholar]
- Jeffreys AJ, Cotton VE, Neumann R, Lam K-WG 2013. Recombination regulator PRDM9 influences the instability of its own coding sequence in humans. Proc Natl Acad Sci 110: 600–605 [DOI] [PMC free article] [PubMed] [Google Scholar]
- Kong A, Gudbjartsson DF, Sainz J, Richardsson B, Barnard J, Hallbeck B, Palsson ST, Gulcher JR, Stefansson K, Jonsdottir GM, et al. 2002. A high-resolution recombination map of the human genome. Nat Genet 31: 241–247 [DOI] [PubMed] [Google Scholar]
- Kong A, Thorleifsson G, Gudbjartsson DF, Masson G, Sigurdsson A, Jonasdottir A, Walters GB, Jonasdottir A, Gylfason A, Kristinsson KT, et al. 2010. Fine-scale recombination rate differences between sexes, populations and individuals. Nature 467: 1099–1103 [DOI] [PubMed] [Google Scholar]
- Locke DP, Hillier LW, Warren WC, Worley KC, Nazareth LV, Muzny DM, Yang S-P, Wang Z, Chinwalla AT, Minx P, et al. 2011. Comparative and demographic analysis of orang-utan genomes. Nature 469: 529–533 [DOI] [PMC free article] [PubMed] [Google Scholar]
- Mailund T, Schierup MH, Pedersen CNS, Mechlenborg PJM, Madsen JN, Schauser L 2005. CoaSim: A flexible environment for simulating genetic data under coalescent models. BMC Bioinformatics 6: 252. [DOI] [PMC free article] [PubMed] [Google Scholar]
- McVean GA, Myers SR, Hunt S, Deloukas P, Bentley DR, Donnelly P 2004. The fine-scale structure of recombination rate variation in the human genome. Science 304: 581–584 [DOI] [PubMed] [Google Scholar]
- Myers S, Bottolo L, Freeman C, McVean G, Donnelly P 2005. A fine-scale map of recombination rates and hotspots across the human genome. Science 310: 321–324 [DOI] [PubMed] [Google Scholar]
- Myers S, Bowden R, Tumian A, Bontrop RE, Freeman C, MacFie TS, McVean G, Donnelly P 2010. Drive against hotspot motifs in primates implicates the PRDM9 gene in meiotic recombination. Science 327: 876–879 [DOI] [PMC free article] [PubMed] [Google Scholar]
- Nagylaki T 1983. Evolution of a finite population under gene conversion. Proc Natl Acad Sci 80: 6278–6281 [DOI] [PMC free article] [PubMed] [Google Scholar]
- Newman TL, Tuzun E, Morrison VA, Hayden KE, Ventura M, McGrath SD, Rocchi M, Eichler EE 2005. A genome-wide survey of structural variation between human and chimpanzee. Genome Res 15: 1344–1356 [DOI] [PMC free article] [PubMed] [Google Scholar]
- Oliver PL, Goodstadt L, Bayes JJ, Birtle Z, Roach KC, Phadnis N, Beatson SA, Lunter G, Malik HS, Ponting CP 2009. Accelerated evolution of the Prdm9 speciation gene across diverse metazoan taxa. PLoS Genet 5: e1000753. [DOI] [PMC free article] [PubMed] [Google Scholar]
- Parvanov ED, Petkov PM, Paigen K 2010. Prdm9 controls activation of mammalian recombination hotspots. Science 327: 835. [DOI] [PMC free article] [PubMed] [Google Scholar]
- Prado-Martinez J, Sudmant PH, Kidd JM, Li H, Kelley JL, Lorente-Galdos B, Veeramah KR, Woerner AE, O'Connor TD, Santpere G, et al. 2013. Great ape genetic diversity and population history. Nature 499: 471–475 [DOI] [PMC free article] [PubMed] [Google Scholar]
- Prüfer K, Munch K, Hellmann I, Akagi K, Miller JR, Walenz B, Koren S, Sutton G, Kodira C, Winer R, et al. 2012. The bonobo genome compared with the chimpanzee and human genomes. Nature 486: 527–531 [DOI] [PMC free article] [PubMed] [Google Scholar]
- Ptak SE, Hinds DA, Koehler K, Nickel B, Patil N, Ballinger DG, Przeworski M, Frazer KA, Pääbo S 2005. Fine-scale recombination patterns differ between chimpanzees and humans. Nat Genet 37: 429–434 [DOI] [PubMed] [Google Scholar]
- Scally A, Dutheil JY, Hillier LW, Jordan GE, Goodhead I, Herrero J, Hobolth A, Lappalainen T, Mailund T, Marques-Bonet T, et al. 2012. Insights into hominid evolution from the gorilla genome sequence. Nature 483: 169–175 [DOI] [PMC free article] [PubMed] [Google Scholar]
- Wegmann D, Kessner DE, Veeramah KR, Mathias RA, Nicolae DL, Yanek LR, Sun YV, Torgerson DG, Rafaels N, Mosley T, et al. 2011. Recombination rates in admixed individuals identified by ancestry-based inference. Nat Genet 43: 847–853 [DOI] [PMC free article] [PubMed] [Google Scholar]
- Winckler W, Myers S, Richter D, Onofrio R, McDonald G, Bontrop R, McVean G, Gabriel S, Reich D, Donneley P, et al. 2005. Comparison of fine-scale recombination rates in humans and chimpanzees. Science 308: 107–111 [DOI] [PubMed] [Google Scholar]
Associated Data
This section collects any data citations, data availability statements, or supplementary materials included in this article.