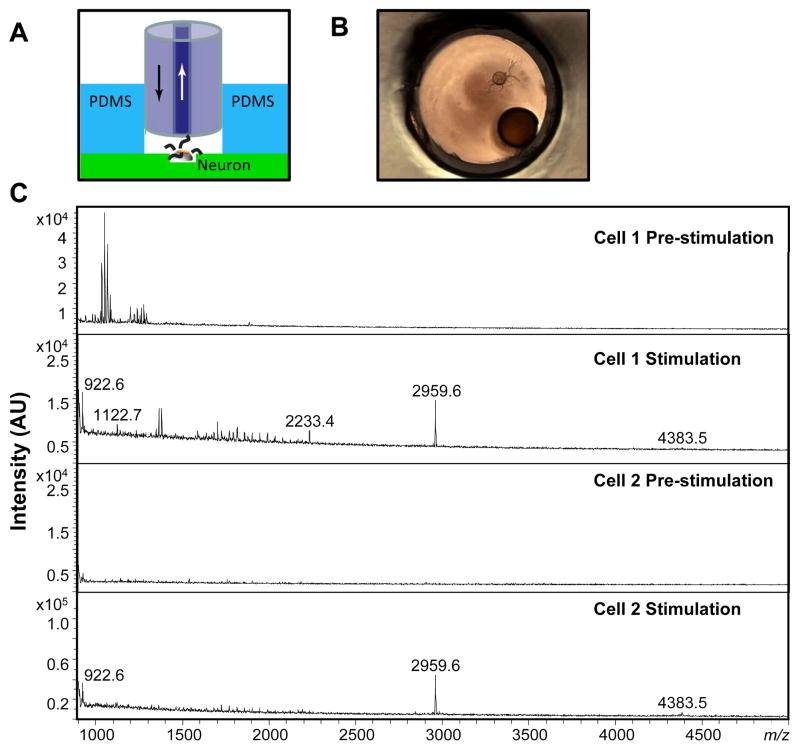
Figure 3.
(A) Schematic illustration of the single-neuron releasate collection approach using the dual-capillary collection system and the neuron sample well. Arrows indicate flow direction. (B) Microscopic view of a dual-capillary collection from a single cultured bag cell neuron in the well. (C) MALDI MS spectra from the releasates from two individual bag cell neurons collected both pre-stimulation (showing few peaks) and during/after KCl stimulation of the neuron showing α-BCP(1–7) at m/z 922.6, α-BCP at m/z 1122.7, AP(1–20) at m/z 2233.4, AP at m/z 2959.6, and ELH at m/z 4383.5.

