

Abstract
Lung cancer is the leading cause of cancer-related deaths worldwide. By now, genome-wide association studies (GWAS) have identified numerous loci associated with the risk of developing lung cancer. However, these loci account for only a small fraction of the familial lung cancer risk. We hypothesized that epistasis may contribute to the missing heritability. To test this hypothesis, we systematically evaluated the association of epistasis of genetic variants with risk of lung cancer in Han Chinese cohorts. We conducted a pairwise genetic interaction analysis of 591370 variants, using BOolean Operation-based Screening and Testing (BOOST), in an ongoing GWAS of lung cancer that includes 2331 cases and 3077 controls. Pairs of epistatic loci with P BOOST ≤ 1.00×10⁻⁶ were further evaluated by a logistic regression model (LRM) with covariate adjustment. Four promising epistatic pairs identified at the screening stage (P LRM ≤ 2.86×10− 13) were validated in two replication cohorts: the first from Beijing (1534 cases and 1489 controls) and the second from Shenyang and Guangzhou (2512 cases and 2449 controls). Using this combined analysis, we identified an interaction between rs2562796 and rs16832404 at 2p32.2 that was significantly associated with the risk of developing lung cancer (P LRM = 1.03×10⁻¹³ in total 13 392 subjects). This study is the first investigation of epistasis for lung cancer on a genome-wide scale in Han Chinese. It addresses part of the missing heritability in lung cancer risk and provides novel insight into the multifactorial etiology of lung cancer.
Introduction
It is estimated that 40% of new lung cancer cases arise in Eastern Asia (mainly in China) (1). After tobacco smoke, genetic factors are the second most important risk factors for lung cancer, with a heritability estimate of 26% (2). So far, genome-wide association studies (GWAS) have successfully identified 16 loci with P ≤ 5.00×10− 8 that are associated with an increased risk of lung cancer (3–10). However, these common variants account for only a small fraction of the familial risk of developing lung cancer, with a modest effect contributed by each locus (per-allele odds ratios, or ORs, ranging from 1.1 to 1.4) (11). To explain the missing heritability, many hypotheses have been proposed and tested on a small scale, including contributions from rare variants (12), copy number variants (13) and gene–gene or gene–environment interactions (14–16). However, no genome-wide gene–gene interaction (also referred to as epistasis) (17) analysis has been carried out to identify novel epistatic determinants for lung cancer risk. To detect the genome-wide impact of epistasis on lung cancer risk, we performed a three-stage, genome-wide analysis of epistasis in Han Chinese cohorts with a total of 13 392 subjects (6377 cases and 7015 controls).
Materials and methods
Study populations
A genome-wide two-locus epistasis analysis was first performed in the discovery population from an ongoing GWAS of lung cancer that includes two study sites (Nanjing: 1473 cases and 1962 controls; and Beijing: 858 cases and 1115 controls). An independent population that includes 1534 cases and 1489 controls from Beijing was treated as the first-stage replication population (Replication I). In the second-stage replication (Replication II), the population is consisted of 2512 cases and 2449 controls from Shenyang (1133 cases and 1251 controls) and Guangzhou (1379 cases and 1198 controls) (Figure 1 and Supplementary Table S1, available at Carcinogenesis Online). The details of these populations have been described previously (9,10). Briefly, the cases newly diagnosed with lung cancer were recruited from hospitals. The histology for each case was histopathologically or cytologically confirmed by at least two local pathologists. Cancer-free control subjects were recruited in local hospitals for individuals receiving routine physical examinations or in the communities for those participating screening of non-communicable diseases. The controls were frequency matched to lung cancer cases for age, gender and geographic regions. Individuals were defined as smokers if they had smoked at an average of one cigarette or more per day and for at least 1 year in their lifetime; otherwise, subjects were considered as non-smokers. Smokers were considered as former smokers who quit for at least 1 year before recruitment. Both current and former smokers were divided into light and heavy smokers according to the threshold of 25 pack-years (median value among the controls).
Fig. 1.

Summary of the whole study design.
Ethics statement
All subjects provided informed consent, and the institutional review boards of each participating institution approved this collaborative study.
Genotype data and quality control
The GWAS was conducted using an Affymetrix Genome-Wide Human SNP Array 6.0, which was followed by a systematic quality control procedure before the association analysis as described previously (9). In brief, single nucleotide polymorphisms (SNPs) were excluded if they met any of the following conditions (see flow diagram in Supplementary Figure S1, available at Carcinogenesis Online): did not map to autosomal chromosomes, had a call rate <95%, had a minor allele frequency <0.05, had a P < 1.00×10⁻⁵ for Hardy–Weinberg equilibrium in all GWAS samples or had a P < 1.00×10⁻⁴ for Hardy–Weinberg equilibrium in either the Nanjing or Beijing study samples and unclear genotyping clusters. We also removed samples if they met any of the following conditions (see flow diagram in Supplementary Figure S2, available at Carcinogenesis Online): call rate <95%, ambiguous gender, familial relationships, extreme heterozygosity rate and outliers. After a stringent quality control procedure, a total of 2331 lung cancer cases and 3077 controls including 591 370 SNPs were used in the subsequent gene–gene interaction analysis.
Statistical analysis
Since there are ~180 billion tests in this study, we adopted a ‘screening before testing’ strategy for dimensional reduction. BOolean Operation-based Screening and Testing (BOOST) (18) was utilized as a screening tool. In BOOST, the interaction between two SNPs was evaluated by testing the difference between two log-linear models (one with interaction item and the other without interaction item). The difference of the maximum log-likelihood of these two models is defined as 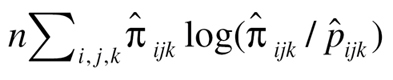 , where n is the sample size,
  is the observed frequency of subjects with SNP1 coded i (0, 1 and 2), SNP2 coded j (0, 1 and 2) and disease status coded k (0 and 1),
  is the expected frequency under null hypothesis. BOOST used Kirkwood superposition approximation instead of maximum likelihood estimation to compute
  . Kirkwood superposition approximation without iteration process helps BOOST to quickly finish exhaustive search of SNP–SNP interaction in a relative short time, meanwhile guaranteeing no missing of positive results.
The top SNP pairs identified in BOOST screening were retested by a logistic regression model (LRM) with covariate adjustment to detect interactions. In (1), βa and βb are the main effects of SNPa and SNPb, respectively, and βab is the interaction item and Covari are the covariates for adjustment, including age, gender, pack-years of smoking and eigenvectors. We used the Minimac software (http://genome.sph.umich.edu/wiki/Minimac/) to impute untyped SNPs using the linkage disequilibrium information on the basis of reference panels downloaded from the 1000 Genomes database (http://www.1000genomes.org/). General analyses were performed by R software (version 2.14.0; The R Foundation for Statistical Computing, http://www.cran.r-project.org/).
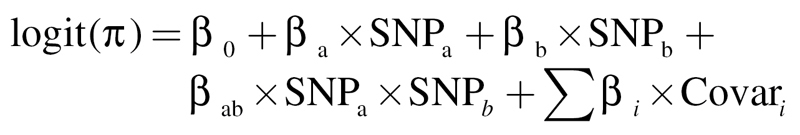 |
(1) |
SNP pair selection and genotyping for replication
From the discovery stage, we selected SNP pairs that met the following criteria for Replication I: (i) the epistasis had a P LRM ≤ 2.86×10− 13 in all GWAS populations and had a P LRM ≤ 1.0×10− 4 in both the Nanjing and Beijing studies, the number of interactions tested in GWAS was 1.75×10¹¹; thus, the genome-wide significance level was 2.86×10− 13 using Bonferroni correction; (ii) the directions of ORs for the two SNPs and their interactions derived from LRM were consistent in both the Nanjing and Beijing studies and (iii) both SNPs had clear genotyping clusters.
Genotyping analysis in Replication I was performed using the iPLEX Sequenom MassARRAY platform (Sequenom, Inc). A TaqMan allelic discrimination assay (Applied Biosystems) was used for the Replication II validation samples. The following series of methods was used to control the quality of genotyping: (i) case and control samples were mixed on each plate; (ii) genotyping was performed blinded to case or control status; (iii) two water controls were used in each plate as blank controls and (iv) 5% of the samples were randomly selected for repeat genotyping, as blind duplicates, and the reproducibility was 100%.
The predictive ability of the newly indentified epistasis
The integrated discrimination improvement (IDI) and the net reclassification improvement (NRI) are two statistics proposed to evaluate the significance of novel predictors (19). The IDI measures the new model’s improvement in average sensitivity without sacrificing average specificity. The relative IDI is defined using (2). Here, the baseline LRM including age, gender and pack-years of smoking was denoted as model 1. The new model added with epistasis was denoted as model 2. 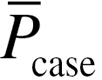 and
and  are the mean of the predicted probability derived from LRM for cases and controls, respectively.
 |
(2) |
The NRI measures the correctness of reclassification of subjects based on their predicted probabilities of events using the new model. The N case and N control are the number of cases and controls, respectively. P is the predicted probability for each subject, derived from LRM. The category-free NRI is defined using (3), which means the proportion for cases/controls with the predicted probability moving up/down in model 2 compared with model 1.
 |
(3) |
Functional annotation based on public available databases
We performed expression quantitative trait loci (eQTL) analysis using the University of Chicago eQTL Browser (http://eqtl.uchicago.edu/cgi-bin/gbrowse/eqtl/), which contains significant eQTLs that were identified in recent studies across multiple cell lines and populations. Open chromatin regions, recognized by DNase I hypersensitive site sequencing, are associated with gene regulatory elements, including promoters, enhancers, silencers, insulators and locus control region. Whether these SNPs located in the DNase I hypersensitive site sequencing peaks were derived from the ENCODE database (http://genome.ucsc.edu/ENCODE/). The extent by which the SNPs affect micro-RNAs-binding was predicted by Patrocles (http://www.patrocles.org/).
Results
The pairwise analysis was conducted with 591 370 SNPs in the discovery stage (the Nanjing study: 1473 cases and 1962 controls; the Beijing study: 858 cases and 1115 controls) using BOOST. This screening identified 493 177 epistatic pairs with P BOOST ≤ 1.00×10− 6.
These 493 177 top epistatic pairs were further evaluated by LRM with adjustment for covariates (age, gender, pack-years of smoking and eigenvectors generated by EIGENSTRAT 3.0) (20). A total of four pairs (Table I and Supplementary Table S2, available at Carcinogenesis Online) met the criteria, with P LRM ≤ 2.86×10− 13 within the discovery stage. These four pairs were also consistently associated at P LRM ≤ 1.0×10− 4 when independently tested in either the Nanjing study or the Beijing study at the discovery stage.
Table I.
Interactions between rs2562796 and rs16832404, and the effect on lung cancer risk
| Study | Single-locus association analysis | Interaction | ||||
|---|---|---|---|---|---|---|
| rs2562796 G/Ta | rs16832404 A/Ga | rs2562796-rs16832404 | ||||
| OR (95% CI)b | P b | OR (95% CI)b | P b | OR (95% CI)b | P b | |
| GWAS | 1.03 (0.95–1.12) | 4.94×10⁻¹ | 1.06 (0.97–1.17) | 2.12×10⁻¹ | 2.58 (2.24–2.97) | 1.37×10−39 |
| Replication I | 1.00 (0.90–1.12) | 9.66×10⁻¹ | 1.08 (0.96–1.21) | 1.98×10⁻¹ | 1.17 (0.99–1.38) | 6.37×10⁻² |
| Replication II | 1.05 (0.97–1.14) | 2.13×10⁻¹ | 1.01 (0.92–1.10) | 8.67×10⁻¹ | 1.21 (1.06–1.38) | 4.61×10⁻³ |
| Combined | 1.05 (1.00–1.10) | 5.62×10⁻² | 1.05 (0.99–1.11) | 9.53×10⁻² | 1.33 (1.23–1.43) | 1.03×10⁻¹³ |
aMajor/minor alleles.
bAdjusted for age, gender, pack-years of smoking and eigenvectors where appropriate.
Fast-track replication of the four potential interactions was performed in an independent lung cancer cohort from Beijing (Replication I; 1534 cases and 1489 controls) and was further validated in other lung cancer cohorts from Shenyang and Guangzhou (Replication II; 2512 cases and 2449 controls). In Replication I, the epistasis of one of the pairs (rs2562796 and rs16832404) had a borderline significant association with lung cancer risk (P LRM = 6.37×10− 2; Table I), with a consistent interaction pattern, similar to that observed in the GWAS. This interaction was again observed in Replication II (P LRM = 4.61×10− 3; Table I). The other three pairs did not show significant interaction in Replication I and were not analyzed in Replication II.
The genotype counts of this epistasis in cases and controls were at least 5 for each genotype combination in each study stage (Supplementary Table S3, available at Carcinogenesis Online). It indicates that the result of this association is robust, and the statistical significance may not due to the extreme values in the contingency tables.
As shown in Figure 2A, the effect of rs2562796 was modified by the genotype of rs16832404. In the combined three-stage analysis, the minor allele (T) of rs2562796 was significantly associated with a reduced risk of lung cancer in subjects carrying the AA genotype of rs16832404 [OR = 0.92, 95% confidence interval (95% CI) = 0.86–0.98, P = 1.04×10⁻²], whereas it was significantly associated with an increased risk in those carrying the heterozygous AG genotype of rs16832404 (OR = 1.15, 95% CI = 1.06–1.25, P = 1.00×10⁻³). The risk was much greater in those with the homozygous GG genotype of rs16832404 (OR = 1.74, 95% CI = 1.48–2.06, P = 3.23×10⁻¹¹).
Fig. 2.

Association of rs2562796 genotypes with lung cancer risk among subjects carrying different genotypes of rs16832404 (A), or association of rs16832404 genotypes with lung cancer risk among subjects carrying different genotypes of rs2562796 (B). The box and horizontal line represent the OR and 95% CI, respectively.
Similarly, the minor allele (G) of rs16832404 was significantly associated with decreased lung cancer risk in subjects carrying the GG genotype of rs2562796 (OR = 0.80, 95% CI = 0.72–0.88, P = 1.71×10− 5) but increased risk in those carrying the GT genotype of rs2562796 (OR = 1.08, 95% CI = 1.00–1.18, P = 6.43×10− 2). There was an even greater risk in those with the TT genotype of rs2562796 (OR = 1.41, 95% CI = 1.26–1.57, P = 1.29×10− 9) (Figure 2B). The same gene–gene interaction patterns between these two SNPs were observed in the GWAS and the two replication studies. Moreover, we observed a similar pattern of epistasis between rs2562796 and rs16832404 in subpopulations stratified by age, gender, smoking history and histological classification (Supplementary Table S4, available at Carcinogenesis Online). The interaction between rs2562796 and rs16832404 was more significant in males (OR = 1.40, 95% CI = 1.27–1.54, P = 6.37×10− 12), current smokers (OR = 1.58, 95% CI = 1.40–1.79, P = 2.90×10− 13) and patients with adenocarcinoma (OR = 1.41, 95% CI = 1.29–1.54, P = 1.16×10− 13).
To confirm epistasis in this region, we performed a genomic imputation with our GWAS data. For the imputed SNPs located in the 30 kb flanking rs2562796 and rs16832404, we selected 170 SNPs (imputed r 2 > 0.5, minor allele frequency > 0.05). After BOOST screening for those 170 imputed SNPs, there were 579 epistasis pairs with P BOOST ≤ 1.00×10− 6, and of these, 439 epistatic pairs were P LRM ≤ 2.86×10− 13. By plotting the P BOOST values of pairwise interactions between 76 SNPs near rs2562796 and 94 SNPs near rs16832404 (Figure 3), we visualized multiple pairs of epistatic loci between these two regions that were significantly associated with risk for lung cancer.
Fig. 3.

Interaction map for all possible epistatic pairs in the 30kb flanking the two marker SNPs rs2562796 and rs16832404. The P values for each epistatic interaction were acquired from the BOOST screening of the GWAS data, by using imputed data, and were plotted on a −log10 scale. The P values are truncated at P = 1.0×10− 12. The blue point represents the identified epistatic interaction.
We evaluated the predictive ability for the newly identified epistasis using two LRMs (without or with epistasis). In this study, the relative IDI for the model with epistasis added is 8.35%, P < 0.0001 (Supplementary Table S5, available at Carcinogenesis Online), whereas the category-free NRI is 10.52%, P < 0.0001 (Supplementary Table S6, available at Carcinogenesis Online).
Discussion
We therefore identified a consistent interaction between rs2562796, rs16832404 and lung cancer risk. A number of epidemiological observations suggest the majority of lung cancer cases worldwide are males and attributable to cigarette smoking (21), and adenocarcinoma is the predominant histologic type of lung cancer (22). Of interest, the interaction effects appeared to be stronger in males, current smokers and patients with adenocarcinoma, which may address more missing heritability in those populations.
Interestingly, neither of these SNPs, individually, showed significant association with the risk of lung cancer (P combined = 5.62×10− 2 and 9.53×10− 2 for rs2562796 and rs16832404, respectively) (Table I). Similar associations with epistatic pairs of loci have been reported for type 2 diabetes (23) and prostate cancer (24). For example, two epistatic pairs associated with prostate cancer did not show significant marginal effects (P ranging from 0.16 to 0.99) but had strong interactions (24). Taken together with our data, these findings highlight that whole-genome epistasis evaluations are necessary for understanding the genetic determinants of disease.
Both relative IDI and category-free NRI are significant for this identified epistasis, indicating the improvement of the predicative ability with epistasis added in the model. These results suggest epistasis between these two SNPs and may help explain some of the missing heritability of lung cancer susceptibility. However, this improvement still only explains a relatively small portion of the missing heritability of lung cancer. Since this is a genome-wide analysis of interactions among common variants, the remaining missing heritability may be due to rare variants, copy number variants, gene–environment interactions or other unaccounted factors. Further studies of which are warranted to discover more missing heritability of lung cancer.
The SNP rs2562796 is located in intron 9 of HIBCH (3-hydroxyisobutyryl-CoA hydrolase), which is a member of the enoyl-CoA superfamily (25). The expression of enoyl-CoA hydratase was downregulated in betulin-induced human lung cancer A549 cells, although betulin showed anticancer activity in A549 cells by inducing apoptosis, indicating enoyl-CoA hydratase may serve as a potential critical factor attributable to tumorigenesis (26,27). In addition, rs2562796 is located ~90kb upstream of inositol polyphosphate-1-phosphatase (INPP1). INPP1 plays a pivotal role in the phosphatidylinositol signaling pathway, which is upregulated in colorectal cancer (28), indicating INPP1 overexpression may have a role in facilitating tumor development.
In addition to HIBCH and INPP1, both rs2562796 and rs16832404 are located near PMS1 (postmeiotic segregation increased 1) and STAT1 (signal transducer and activator of transcription 1, 91kDa). The SNP rs2562796 is located ~370 kb downstream of PMS1 and 725 kb downstream of STAT1, whereas rs16832404 is located ~310 kb downstream of PMS1 and 785 kb downstream of STAT1. PMS1 encodes a DNA mismatch repair (MMR) mutL/hexB family protein. The MMR pathway contributes to tumor suppression, and cells with defective MMR may have enhanced tumorigenesis (29,30). The loss of MMR activity is also associated with various cancers, including lung cancer (31–34). STAT1 is a regulator of apoptosis and a tumor suppressor (35) and is significantly associated with better survival of non-small-cell lung cancer in Chinese patients (36).
Notably, rs16832404 and rs2562796 are ~60 kb apart, whereas rs16832404 is also located near HIBCH (15 kb downstream) and INPP1 (150 kb upstream). We then performed functional annotation for the two marker SNPs (rs2562796 and rs16832404), as well as those are tagged by the two marker SNPs (r 2 > 0.8) based on public available data sets or tools (see Materials and methods; Supplementary Table S7, available at Carcinogenesis Online). Among the 2 marker SNPs and those 40 SNPs highly correlated with these, 8 SNPs were significantly associated with the messenger RNA expression levels of HIBCH or INPP1 (eQTL analysis). Subsequently, we evaluated whether these SNPs modulate the HIBCH or INPP1 messenger RNA expression levels through transcriptional or posttranscriptional mechanism. Based on the DNase I hypersensitive site sequencing data set, we found that two SNPs, rs16832404 and rs291407, are within open chromatin regions associated with gene regulatory elements. Furthermore, nine SNPs may affect the micro-RNAs binding. In summary, these analyses suggest that the two marker SNPs and those tagged by these SNPs may transcriptionally or posttranscriptionally modulate the expression of HIBCH or INPP1. It is plausible that variations in the two SNPs (rs2562796 and rs16832404), or in SNPs in high linkage disequilibrium with these two SNPs, collaboratively result in the aberrant activities of certain transcriptional or posttranscriptional factors. In turn, those factors may interactively regulate the expression of the same target genes nearby or throughout the genome, hence activating the crucial signaling pathways that drive lung carcinogenesis. However, these results are very preliminary and merit further investigations.
This study was highlighted with five major features. (i) This was the first exploratory study of epistasis of lung cancer risk in Han Chinese population on a genome-wide scale using external replication populations. What we found partly addressed the missing heritability and may provide a novel statistical evidence for further study. (ii) The exhaustive search strategy guaranteed the systematic evaluation of all pairwise epistasis. (iii) We applied the quite tight control of false positives through the study. The stringent threshold in the discovery stage was defined using the conservative method (Bonferroni) considering the correction of the multiple comparisons. (iv) We had a large sample size in the study of lung cancer (13 392 subjects: 6377 cases and 7015 controls), which contributed to the statistical power. (v) The result of association was confident. The significance was not possible due to the extreme values of genotype counts in the cases and controls. Also, we observed a significant association in subgroup populations in stratification analysis and a cluster of epistasis signals nearby the identified one using imputed genotypes.
It is worth mentioning that the interaction between rs2562796 and rs16832404 seems to be driven mainly by the Beijing study in the discovery stage (P = 9.35 × 10− 37 for the Beijing study and P = 2.02 × 10− 5 for the Nanjing study). As we know, this lung cancer GWAS includes two studies: the Nanjing discovery study (1473 cases and 1962 controls) and the Beijing discovery study (858 cases and 1115 controls). It is possible that small sample size may easily result in false positives, although the P value of this epistasis in the Beijing discovery study is extremely low. To control the false-positive rate in exhaustive search of epistasis, we have set relative stringent criteria: the P value ≤ 1.0×10− 4 in both the Nanjing discovery study and the Beijing discovery study although P value ≤ 2.86×10− 13 in combined GWAS data. In this way, even though the one with extremely low P value only in the Beijing discovery study could not be selected for further replication. However, further studies with large sample size are warranted to validate and extend our findings.
In summary, we systematically screened for epistasis on a genome-wide scale using BOOST and retested the top 493 177 hits by LRM with adjustment for covariates. We validated the epistasis of rs2562796 and rs16832404 in two replication stages. This three-stage designed case–control study is the first epistasis study in a GWAS of lung cancer in Han Chinese. The identified gene–gene interaction may contribute to some of the missing heritability in lung cancer. This study also provides novel insight into the multifactorial etiology of lung cancer. Additional functional studies will be necessary to elucidate the role of the identified epistatic interaction in lung cancer development.
Supplementary material
Supplementary Tables S1–S7 and Figures S1 and S2 can be found at http://carcin.oxfordjournals.org/
Funding
National Key Basic Research Program Grant (2011CB503805, 2013CB911400); National Natural Science Foundation of China (81230067, 81225020, 81270044, 81072389, 81373102); Jiangsu Natural Science Foundation (BK2012042); Natural Science Foundation of the Jiangsu Higher Education Institutions of China (11KJA330001, 10KJA33034); Research Fund for the Doctoral Program of Higher Education of China (20113234110002); US National Institutes of Health Grant (U19 CA148127); New Century Excellent Talents in University (NCET-10-0178); Research and Innovation Project for College Graduates of Jiangsu Province (CXZZ11_0733, CXZZ11_0734, CXZZ12_0591); Priority Academic Program Development of Jiangsu Higher Education Institutions (PAPD).
Supplementary Material
Acknowledgements
We thank all of the study subjects, research staff and students who participated in this work. We acknowledge Dr C.Yang for kindly responding to all our questions related to BOOST software. We also appreciate two anonymous reviewers for their valuable suggestions for this manuscript.
Conflict of Interest Statement: None declared.
Glossary
Abbreviations:
- BOOST
BOolean Operation-based Screening and Testing
- CI
confidence interval
- eQTL
expression quantitative trait loci
- GWAS
genome-wide association study
- HIBCH
3-hydroxyisobutyryl-CoA hydrolase
- IDI
integrated discrimination improvement
- INPP1
inositol polyphosphate-1-phosphatase
- LRM
logistic regression model
- MMR
mismatch repair
- NRI
net reclassification improvement
- OR
odds ratio
- PMS1
postmeiotic segregation increased 1
- SNP
single nucleotide polymorphism
- STAT1
signal transducer and activator of transcription 1.
References
- 1. Ferlay J., et al. (2010). Estimates of worldwide burden of cancer in 2008: GLOBOCAN 2008. Int. J. Cancer, 127, 2893–2917 [DOI] [PubMed] [Google Scholar]
- 2. Lichtenstein P., et al. (2000). Environmental and heritable factors in the causation of cancer—analyses of cohorts of twins from Sweden, Denmark, and Finland. N. Engl. J. Med., 343, 78–85 [DOI] [PubMed] [Google Scholar]
- 3. Hung R.J., et al. (2008). A susceptibility locus for lung cancer maps to nicotinic acetylcholine receptor subunit genes on 15q25. Nature, 452, 633–637 [DOI] [PubMed] [Google Scholar]
- 4. Amos C.I., et al. (2008). Genome-wide association scan of tag SNPs identifies a susceptibility locus for lung cancer at 15q25.1. Nat. Genet., 40, 616–622 [DOI] [PMC free article] [PubMed] [Google Scholar]
- 5. Wang Y., et al. (2008). Common 5p15.33 and 6p21.33 variants influence lung cancer risk. Nat. Genet., 40, 1407–1409 [DOI] [PMC free article] [PubMed] [Google Scholar]
- 6. McKay J.D., et al. (2008). Lung cancer susceptibility locus at 5p15.33. Nat. Genet., 40, 1404–1406 [DOI] [PMC free article] [PubMed] [Google Scholar]
- 7. Lan Q., et al. (2012). Genome-wide association analysis identifies new lung cancer susceptibility loci in never-smoking women in Asia. Nat. Genet., 44, 1330–1335 [DOI] [PMC free article] [PubMed] [Google Scholar]
- 8. Shiraishi K., et al. (2012). A genome-wide association study identifies two new susceptibility loci for lung adenocarcinoma in the Japanese population. Nat. Genet., 44, 900–903 [DOI] [PubMed] [Google Scholar]
- 9. Hu Z., et al. (2011). A genome-wide association study identifies two new lung cancer susceptibility loci at 13q12.12 and 22q12.2 in Han Chinese. Nat. Genet., 43, 792–796 [DOI] [PubMed] [Google Scholar]
- 10. Dong J., et al. (2012). Association analyses identify multiple new lung cancer susceptibility loci and their interactions with smoking in the Chinese population. Nat. Genet., 44, 895–899 [DOI] [PMC free article] [PubMed] [Google Scholar]
- 11. Manolio T.A., et al. (2009). Finding the missing heritability of complex diseases. Nature, 461, 747–753 [DOI] [PMC free article] [PubMed] [Google Scholar]
- 12. Bodmer W., et al. (2008). Common and rare variants in multifactorial susceptibility to common diseases. Nat. Genet., 40, 695–701 [DOI] [PMC free article] [PubMed] [Google Scholar]
- 13. Korn J.M., et al. (2008). Integrated genotype calling and association analysis of SNPs, common copy number polymorphisms and rare CNVs. Nat. Genet., 40, 1253–1260 [DOI] [PMC free article] [PubMed] [Google Scholar]
- 14. Cordell H.J. (2009). Detecting gene-gene interactions that underlie human diseases. Nat. Rev. Genet., 10, 392–404 [DOI] [PMC free article] [PubMed] [Google Scholar]
- 15. Musani S.K., et al. (2007). Detection of gene x gene interactions in genome-wide association studies of human population data. Hum. Hered., 63, 67–84 [DOI] [PubMed] [Google Scholar]
- 16. Moore J.H., et al. (2009). Epistasis and its implications for personal genetics. Am. J. Hum. Genet., 85, 309–320 [DOI] [PMC free article] [PubMed] [Google Scholar]
- 17. Cordell H.J. (2002). Epistasis: what it means, what it doesn’t mean, and statistical methods to detect it in humans. Hum. Mol. Genet., 11, 2463–2468 [DOI] [PubMed] [Google Scholar]
- 18. Wan X., et al. (2010). BOOST: a fast approach to detecting gene-gene interactions in genome-wide case-control studies. Am. J. Hum. Genet., 87, 325–340 [DOI] [PMC free article] [PubMed] [Google Scholar]
- 19. Pencina M.J., et al. (2008). Evaluating the added predictive ability of a new marker: from area under the ROC curve to reclassification and beyond. Stat. Med., 27, 157–172; discussion 207. [DOI] [PubMed] [Google Scholar]
- 20. Price A.L., et al. (2006). Principal components analysis corrects for stratification in genome-wide association studies. Nat. Genet., 38, 904–909 [DOI] [PubMed] [Google Scholar]
- 21. Parkin D.M., et al. (2005). Global cancer statistics, 2002. CA Cancer J. Clin., 55, 74–108 [DOI] [PubMed] [Google Scholar]
- 22. Travis W.D. (2002). Pathology of lung cancer. Clin. Chest Med., 23, 65–81, viii. [DOI] [PubMed] [Google Scholar]
- 23. Bell J.T., et al. (2011). Genome-wide association scan allowing for epistasis in type 2 diabetes. Ann. Hum. Genet., 75, 10–19 [DOI] [PMC free article] [PubMed] [Google Scholar]
- 24. Tao S., et al. (2012). Genome-wide two-locus epistasis scans in prostate cancer using two European populations. Hum. Genet., 131, 1225–1234 [DOI] [PMC free article] [PubMed] [Google Scholar]
- 25. Wong B.J., et al. (2003). Divergent function in the crotonase superfamily: an anhydride intermediate in the reaction catalyzed by 3-hydroxyisobutyryl-CoA hydrolase. J. Am. Chem. Soc., 125, 12076–12077 [DOI] [PubMed] [Google Scholar]
- 26. Pyo J.S., et al. (2009). Anti-cancer effect of Betulin on a human lung cancer cell line: a pharmacoproteomic approach using 2 D SDS PAGE coupled with nano-HPLC tandem mass spectrometry. Planta Med., 75, 127–131 [DOI] [PubMed] [Google Scholar]
- 27. Zhang J., et al. (2011). Enoyl coenzyme A hydratase 1 is an important factor in the lymphatic metastasis of tumors. Biomed. Pharmacother., 65, 157–162 [DOI] [PubMed] [Google Scholar]
- 28. Li S.R., et al. (2000). Transcription of the inositol polyphosphate 1-phosphatase gene (INPP1) is upregulated in human colorectal cancer. Mol. Carcinog., 27, 322–329 [DOI] [PubMed] [Google Scholar]
- 29. Buermeyer A.B., et al. (1999). Mammalian DNA mismatch repair. Annu. Rev. Genet., 33, 533–564 [DOI] [PubMed] [Google Scholar]
- 30. Stojic L., et al. (2004). Mismatch repair and DNA damage signalling. DNA Repair (Amst.), 3, 1091–1101 [DOI] [PubMed] [Google Scholar]
- 31. Win A.K., et al. (2012). Colorectal and other cancer risks for carriers and noncarriers from families with a DNA mismatch repair gene mutation: a prospective cohort study. J. Clin. Oncol., 30, 958–964 [DOI] [PMC free article] [PubMed] [Google Scholar]
- 32. Ramírez-Ramírez M.A., et al. (2012). Loss of expression of DNA mismatch repair proteins in aberrant crypt foci identified in vivo by magnifying colonoscopy in subjects with hereditary nonpolyposic and sporadic colon rectal cancer. J. Gastrointest. Cancer, 43, 209–214 [DOI] [PubMed] [Google Scholar]
- 33. Vogelsang M., et al. (2012). The cumulative effects of polymorphisms in the DNA mismatch repair genes and tobacco smoking in oesophageal cancer risk. PLoS One, 7, e36962. [DOI] [PMC free article] [PubMed] [Google Scholar]
- 34. Barnetson R.A., et al. (2006). Identification and survival of carriers of mutations in DNA mismatch-repair genes in colon cancer. N. Engl. J. Med., 354, 2751–2763 [DOI] [PubMed] [Google Scholar]
- 35. Stephanou A., et al. (2003). STAT-1: a novel regulator of apoptosis. Int. J. Exp. Pathol., 84, 239–244 [DOI] [PMC free article] [PubMed] [Google Scholar]
- 36. Chen H.Y., et al. (2007). A five-gene signature and clinical outcome in non-small-cell lung cancer. N. Engl. J. Med., 356, 11–20 [DOI] [PubMed] [Google Scholar]
Associated Data
This section collects any data citations, data availability statements, or supplementary materials included in this article.