Abstract
Fluid-fluid interfacial area for porous-media systems can be measured with the aqueous-phase interfacial partitioning tracer test (IPTT) method or with high-resolution microtomography. The results of prior studies have shown that interfacial areas measured with the IPTT method are larger than values measured with microtomography. The observed disparity has been hypothesized to result from the impact of porous-medium surface roughness on film-associated interfacial area, wherein the influence of surface roughness is characterized to some extent by the IPTT method but not by microtomography due to resolution constraints. This hypothesis was tested by using the two methods to measure interfacial area between an organic immiscible liquid and water for an ideal glass-beads medium that has no measurable surface roughness. The tracer tests yielded a mean interfacial area of 2.8 (± 5 cm−1), while microtomography produced an interfacial area of 2.7 (± 2 cm−1). Maximum specific interfacial areas, equivalent to areas normalized by non-wetting fluid volume, were calculated and compared to measures of the specific solid surface area. The normalized interfacial areas were similar to the specific solid surface area calculated using the smooth-sphere assumption, and to the specific solid surface area measured using the N2/BET method. The results presented herein indicate that both the IPTT and microtomography methods provide robust characterization of fluid-fluid interfacial area, and that they are comparable absent the impact of surface roughness.
INTRODUCTION
Two primary methods are available to measure fluid-fluid interfacial areas for natural porous-media systems, interfacial partitioning tracer tests (e.g., Karkare and Fort, 1996; Brusseau et al., 1997; Saripalli et al., 1997, 1998; Kim et al., 1997, 1999; Anwar et al., 2000; Schaefer et al., 2000; Costanza-Robinson and Brusseau, 2002; Jain et al., 2003; Cho and Annable, 2005; Peng and Brusseau, 2005; Brusseau et al., 2006, 2007, 2008; Dobson et al., 2006) and high-resolution microtomography (e.g., Culligan et al., 2004; Al-Raoush and Willson, 2005; Schnaar and Brusseau, 2005, 2006a,b; Brusseau et al., 2006, 2007, 2008, 2009; Culligan et al., 2006; Prodanovic et al., 2006; Costanza-Robinson et al., 2008). The results of prior studies have shown that interfacial areas measured with the IPTT method are larger than values measured with microtomography (Brusseau et al., 2006, 2007, 2008). The observed disparity has been hypothesized to result from the impact of porous-medium surface roughness. Specifically, it is posited that the microtomography method is unable to measure interfacial area associated with microscopic surface roughness due to resolution constraints, whereas the IPTT method does characterize some portion of roughness-associated interfacial area.
As discussed by Brusseau et al. (2008), fluid-fluid interfacial area in natural porous media is generally associated with both capillary and film domains. The capillary domain comprises interfaces associated with the bulk fluid (e.g. menisci, pendular rings), while the film domain consists of interfaces associated with nonwetting-phase bodies in contact with films of the wetting fluid solvating the surfaces of the solids. It is well known that the surfaces of natural porous media are typically rough because of features such as pits, crevices, and micropores. The nature and magnitude of film-associated interfacial area is dependent on the properties of the solid surfaces and the amount of wetting-phase fluid present (e.g. Philip, 1978; Israelachvili, 1992). Specifically, the external surface of a very thin (i.e., only a few molecules thick) film of fluid solvating the solid surface will closely reflect the topology of the solid surface, as will the interface between the wetting and nonwetting fluid. As the film of wetting fluid becomes thicker, its reflection of the solid-surface topology will be increasingly muted and the fluid-fluid interface will become increasingly smooth. Thus, the magnitude of fluid-fluid interfacial area associated with microscopic surface roughness will decrease as the wetting-phase saturation increases. This effect was observed by Peng and Brusseau (2005), where the magnitude of air-water interfacial areas were similar to N2/BET solid-surface areas at very low water saturations (2–4%) but were approximately 10 times smaller at moderately low saturations (~20%)
The results of prior research indicate that the IPTT method characterizes to some extent the interfacial area associated with surface roughness. For example,Saripalli et al. (1997) conducted aqueous-phase tracer tests using a system composed of spherical, uniform-diameter, silanized glass beads coated with a thin (0.3 µm), uniform layer of decane. The use of such a medium allowed for a relatively precise estimation of smooth-sphere-based surface area (300 cm−1). Because the immiscible liquid was distributed only as thin films, the fluid-fluid interfacial area was assumed to be equivalent to the calculated specific solid surface area. The interfacial area determined with the tracer tests was 450 cm−1, 50% larger than the estimated fluid-fluid interfacial area. This disparity was attributed to the impact of surface roughness. The results reported by Peng and Brusseau (2005) noted above also illustrate the ability of the IPTT method to characterize interfacial area associated with surface roughness. Conversely, given its resolution (usually 8–10 µm/pixel), microscopic surface roughness cannot typically be discerned by synchrotron X-ray microtomography. Given these resolution constraints, microtomography generally cannot measure interfacial area associated with microscopic surface roughness.
Comparison of results obtained with the two methods is complicated by the apparent method-specific impact of surface roughness. The objective of this study was to test the operative hypothesis by using the two methods to measure interfacial area between an organic immiscible liquid and water for an ideal glass-beads medium that has no measurable surface roughness. The robustness of the two methods is evaluated by comparing normalized interfacial areas to specific solid surface areas determined using the smooth-sphere assumption and the N2/BET method.
MATERIALS AND METHODS
Glass beads ranging in size from 0.94 mm to 1.4 mm with mean diameter of 1.16 mm were used as an ideal medium. A volume-normalized specific solid surface area (SSSA) was calculated for the beads using the smooth-sphere assumption: SSSA = 6(1-n)/d, where n is porosity and d is median grain diameter. This calculated value is based on the assumption that the surfaces of the solids are smooth. Thus, the impact of surface roughness is not incorporated in this calculation of surface area. Specific solid surface area was measured using the N2/BET method. This surface area (to be referred to as NBET surface area) does incorporate the contributions of surface roughness. Tetrachloroethene (PCE) and trichloroethene (TCE) were used as the model organic immiscible liquids.
The aqueous-phase interfacial partitioning tracer test was used to measure organic-liquid/water interfacial areas. Sodium dodecyl benzenesulfonate (SDBS) (~50 mg/L) was used as the interfacial partitioning tracer and pentafluorobenzoic acid (PFBA) (150 mg/L) was used as the non-reactive tracer. The solutions were prepared with deionized water saturated with the organic compound. The PFBA (non-reactive) and SDBS (partitioning) tracer tests were conducted sequentially, and a total of three sets of tests were conducted. In addition, another tracer test was conducted wherein the non-reactive and partitioning tracers were present together in solution. Deuterium served as the non-reactive tracer for these experiments, whereby glacial meltwater deficient in deuterium relative to the deionized water was used to create the tracer solution. This approach allowed non-reactive and interfacial tracer tests to be conducted simultaneously.
The columns used for the tracer tests were constructed of stainless steel, and were 7-cm long by 2.2-cm diameter. All tubing, porous frits, and connectors were constructed of stainless steel. The columns were dry packed to obtain uniform bulk densities. The packed columns were then flushed with CO2 to displace air, then saturated with de-aerated water using a single-piston precision-flow HPLC pump to provide constant flow to the bottom of the vertically oriented column. Non-reactive tracer tests were conducted before and after emplacement of the organic liquid to characterize the hydrodynamic properties of the packed columns. In addition, tracer tests were conducted to measure adsorption of SDBS by the porous medium. A small but measureable amount of sorption of SDBS was observed for the glass beads.
After completion of the requisite tracer tests, a few pore-volume equivalents of the organic liquid were pumped into the bottom of the water-saturated column using a syringe pump (Sage, Model 355). Water saturated with the organic compound was then pumped into the column from the top to displace mobile organic liquid and thus establish a residual saturation. The capillary number for this displacement was calculated to be 1·10−6, which is similar to values typically used to establish a stable, discontinuous distribution (i.e., residual saturation) of non-wetting liquid (e.g., Wardlaw and McKellar, 1985; Schnaar and Brusseau, 2005). All tracer tests were conducted at a flow rate equivalent to an average pore-water velocity of approximately 25 cm/h. Properties of the packed columns are reported in Table 1.
Table 1.
Results of Interfacial Partitioning Tracer Tests
| IPTT 1 | IPTT 2 | IPTT 3 | IPTT 4 | |
|---|---|---|---|---|
| Column | 1 | 1 | 1 | 2 |
| Bulk density (ρb) (g/cm3) | 1.41 | 1.41 | 1.41 | 1.42 |
| Porosity (n) | 0.38 | 0.38 | 0.38 | 0.39 |
| PCE saturation (Sn) | 0.08 | 0.08 | 0.08 | 0.12 |
| Equilibrium Sorption Coefficient (Ks) | 0.05 | 0.05 | 0.04 | 0.05 |
| Retardation factor (R) | 1.23 | 1.20 | 1.19 | 1.23 |
| Specific Interfacial Area (Anw) | 6.0 | 1.4 | 3.4 | 0.6 |
Effluent concentrations of PFBA and SDBS were analyzed using UV-Vis spectrophotometry (Shimadzu, model 1601). Meltwater samples were analyzed for deuterium content using laser mass-spectroscopy performed at the Geosciences Department at the University of Arizona. The meltwater comprised −165 δD per mill whereas the DI water used in the experiment comprised −65 δD per mill. The analytical precision of the laser mass spectrometer was 1 δD per mill, giving a signal-to-noise ratio of 114.
Retardation factors for SDBS were obtained by calculating the area above the arrival wave of the breakthrough curves, and by moment analysis of the full breakthrough curves (including extrapolation of elution curves). Retardation values obtained with the two methods were statistically identical, which supports the robustness of the results. The specific organic-liquid/water interfacial area (Anw, L−1), which represents interfacial area normalized by the porous-medium volume, was obtained with knowledge of the retardation factor R, interfacial partition coefficient (Ki), equilibrium sorption coefficient (Ks), bulk density (ρ), and volumetric water content (θw):
| (1) |
where Ki was determined by measurement of interfacial tension as a function of SDBS concentration (e.g., Saripalli et al. 1997, 1998). The concentration of SDBS in the tracer solution varied slighty among the experiments, and the resultant impact on Ki and Ks was accounted for in calculating Anw.
Synchrotron X-ray microtomography was also used to measure interfacial areas. Given the objective of comparing results to the IPTT method, and that the latter method produces interfacial areas that include contributions from both capillary and film domains, the microtomography method was used to obtain meaures of total interfacial area. For this method, the glass beads were dry-packed into thin-walled, X-ray transparent columns constructed of aluminum, with aluminum fittings. The columns were 4.4 cm long, with an outer diameter of 0.635 cm and an inner diameter of 0.58 cm. Polypropylene porous frits (10-µm pores) were placed on both ends of the column to promote uniform flow and retain the porous media.
Two sets of measurements were obtained for the microtomography experiments, one wherein different columns of fixed organic-liquid saturation were imaged, and one wherein images of a single column were obtained at different saturations through successive drainage/imbibition steps. For the first approach, a residual saturation of organic liquid was created following the procedure used for the IPTT experiments. For the second approach, a water-saturated column was taken to the synchrotron facility and subjected to several incremental injections of organic liquid or water saturated with the organic compound. Images were collected after each successive drainage/imbibition step. The organic liquid in all cases was doped with an iodo-organic compound to enhance image contrast.
The imaging was conducted at the GeoSoilEnviroCARS (GSECARS) BM-13D beamline at the Advanced Photon Source (APS), Argonne National Laboratory, IL and at beamline 8.3.2 at the Advanced Light Source (ALS) at Lawrence Berkeley National Lab in Berkeley, CA. A summary of the specific beamline set-up at the GSECARS BM-13D beamline has been reviewed elsewhere (e.g. Culligan et al., 2004; Schnaar et al., 2005); a brief description will be presented here. Imaging was conducted by directing the monochromatic X-ray beam through the column, perpendicular to the longitudinal axis. The transmitted X-rays were converted to visible light with a single-crystal scintillator, and projected onto a mirror at a 45° incline to the incoming beam. A photograph of the image on the mirror was then taken with a high resolution CCD-camera attached to a microscope objective (5×). This image represents a depth-integrated grayscale map of the linear attenuation of the X-ray beam as it passed through the column. After an image was collected, the column was rotated 0.25° and the image-acquisition process was repeated. A total of 720 two-dimensional images of each sample were collected in this manner through a 180° rotation. The image resolution (pixel size) was approximately 10 µm. The length of the imaged zone was approximately 5 mm. The set of two-dimensional images collected for a given scan were preprocessed and reconstructed with algorithms developed by Rivers (2003) to build a single three-dimensional image file from the two-dimensional images.
A detailed description of the procedure for collecting images at the Advanced Light Source beamline 8.3.2. can be found at the beamline 8.3.2 website, or in Kinney et al. (1994). The image-capture procedure employed at ALS is very similar to that described above, with a few notable exceptions. Images were taken at either 0.25° or 0.5° increments over a 180° angular range to obtain 360 or 720 depth-integrated images. The spatial resolution of the resulting images was 8.8 µm. Vertical beam size was approximately 1–2 mm, so several sets of images, called tiles, were collected during each scan. The tiles were “stitched” together to form a single, continuous image set using a program developed at the ALS. A second program, Octopus, was used to preprocess and reconstruct the three-dimensional sample. A detailed description of this program can be found at the University of Ghent Center for X-ray Tomography (UGCT) website.
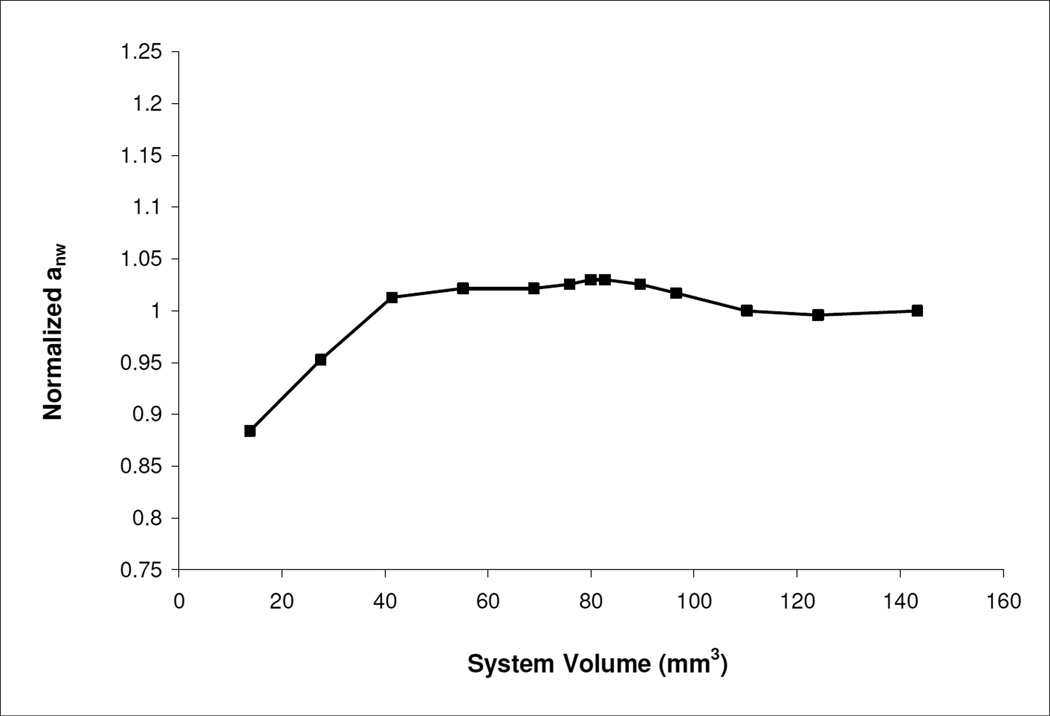
The images were collected from the centers of the columns, thus minimizing the potential influence of end effects. Analysis of the data sets indicated that REV requirements were met for image volumes of approximately 30–50 mm3 (Figure 1). These results are similar to those reported in prior studies (Culligan et al., 2004; Brusseau et al., 2008). The volumes of the imaged zones were larger than the minimum for all data sets.
Figure 1.
Representative elementary volume (REV) analysis for a column packed with glass beads. Normalized organic-liquid/water interfacial area (y-axis) was computed for various system volumes (x-axis) for a single image set. Images were collected at the Advanced Photon Source with a resolution of 10.7 mm/pixel.
Additional image data processing and extraction of quantitative information was conducted with the software package Blob3D, which was specifically developed for high resolution X-ray microtomography data (Ketcham, 2005). A global thresholding technique was used whereby the average grayscale value of each phase was used to determine the threshold for a given image set. This was done to create an array of binary images wherein voxels considered to be organic liquid were assigned a grayscale of 255 (white) and all others were assigned a grayscale of 0 (black). Contiguous voxels assigned as organic liquid were identified and combined to form three-dimensional units (blobs). Once data processing was complete, quantitative information was generated for each individual organic-liquid blob. Blob volume was calculated as the total volume of all the voxels contained within a blob. The effective resolution with respect to blob volume was approximately 10−5 mm3, which is considered to represent the smallest volume that can be distinguished with certainty in the images. Surface area was calculated from the isosurface connecting the selected grayscale value in the binarized image. A feature of Blob3D called isosurface smoothing was implemented to account for the pixilation of smooth surfaces caused by the finite resolution of the microtomography technique and data binarization due to thresholding. The glass beads are considered to be strongly water-wetting, and their surfaces are assumed to be solvated by a thin layer of water at all times. In such a case, organic-liquid surface area is equivalent to total (capillary and film) organic-liquid/water interfacial area. The methods used have been tested and employed successfully in prior research (Schnaar and Brusseau, 2005, 2006a, 2006b; Brusseau et al., 2006, 2007, 2008, 2009).
RESULTS
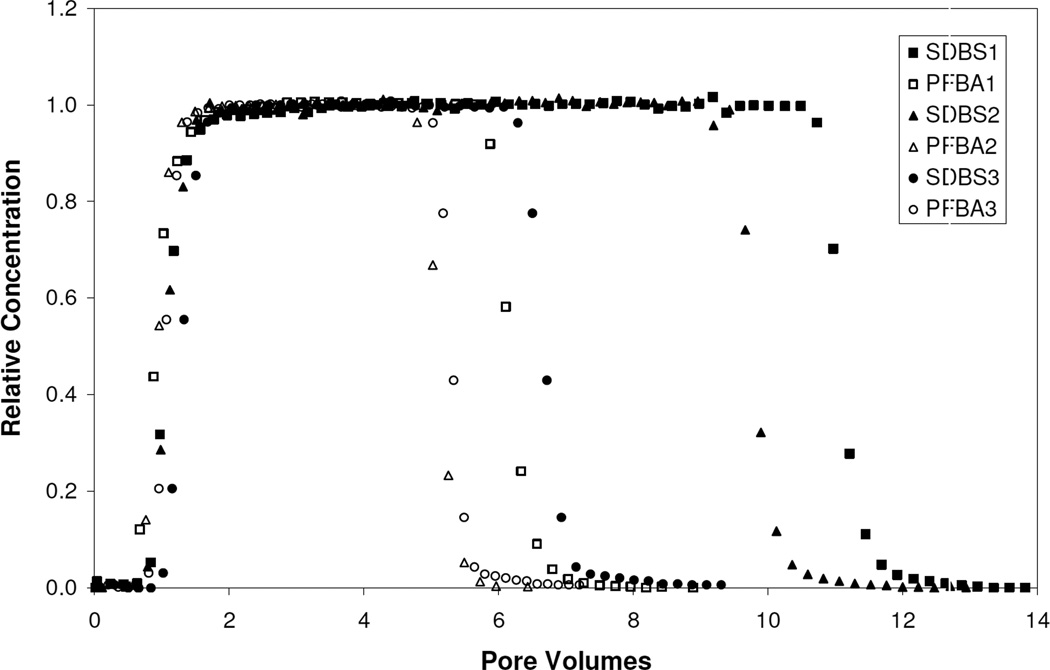
Breakthrough curves obtained from the PFBA-SDBS tracer tests are presented in Figure 2. Breakthrough curves for the nonreactive tracer tests conducted before and after immiscible displacement were essentially identical, which indicates minimal impact of organic-liquid saturation on overall tracer transport, and suggests that the glass-bead packs were stable throughout the immiscible-displacement process. Retardation factors of approximately 1.2 were obtained for SDBS, the interfacial partitioning tracer (Table 1). The mean tracer mass recovery for the four experiments was 99%. A mean specific interfacial area of 2.8 (± 5 cm−1) was obtained from the retardation factors for the four experiments conducted. Relatively large uncertainties are typically observed for IPTT results, which in the present case may be exacerbated by the low values for retardation.
Figure 2.
Breakthrough curves for PFBA (nonreactive tracer) and SDBS (interfacial tracer) transport in columns containing a residual saturation of organic liquid. The tracer tests were conducted sequentially.
The value of interfacial area obtained from these experiments is significantly smaller than values reported in prior IPTT studies employing sands and glass-bead media, which range from approximately 30 to 100 cm−1 for similar Sn values (Saripalli et al., 1997, 1998; Schaefer et al., 2000; Jain et al., 2003; Cho and Annable, 2005; Dobson et al., 2006; Brusseau et al., 2008). It is of note that the measured solid surface areas for the porous media used in these prior studies are significantly larger than that of the glass beads used herein while median grain diameters are similar.
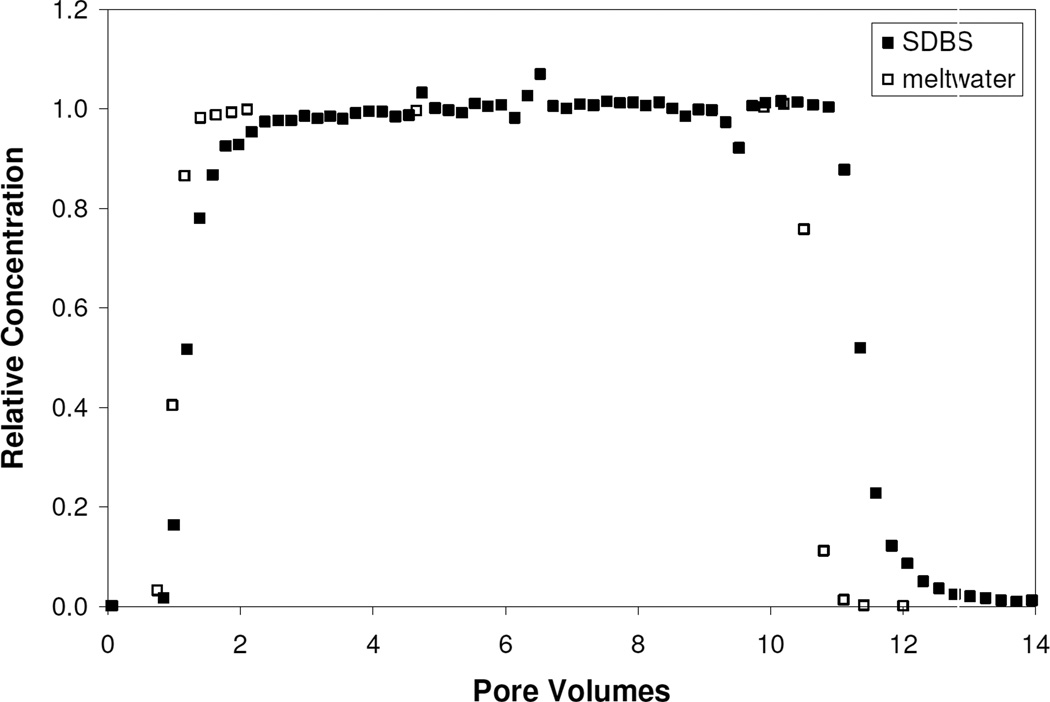
Most interfacial partitioning tracer tests are conducted such that the non-reactive and partitioning tracer test components are performed sequentially, as was done herein for the PFBA-SDBS tracer pair. In this study, non-reactive and partitioning tracer tests were also conducted simultaneously using the meltwater tracer (IPTT 1; Table 1). The breakthrough curves obtained for this experiment are plotted in Figure 3. The interfacial area obtained for this experiment was similar to those obtained from the sequential tracer tests.
Figure 3.
Breakthrough curves for the simultaneous meltwater and SDBS tracer experiment.
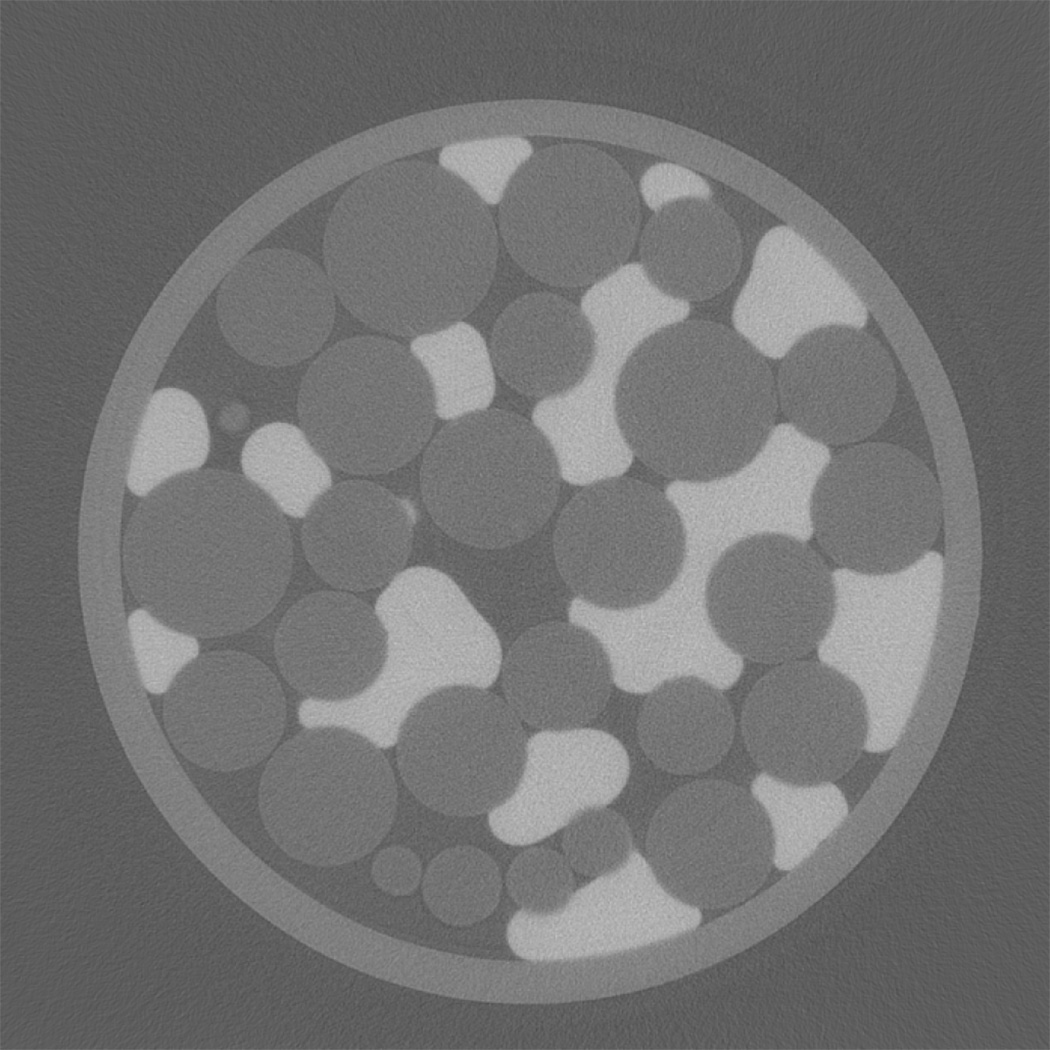
Inspection of the microtomography image data shows that the three phases, organic liquid, water, and porous-medium grains, were very well differentiated, as illustrated in Figure 4. The organic liquid was observed to be evenly distributed throughout the columns, both longitudinally and radially, with no apparent preferential accumulation along the walls or centers of the columns. Inspection also revealed no air was present, indicating that the column preparation procedures produced water-saturated conditions. The average porosity of the microtomography columns was 0.41. This is similar to the porosities of the larger columns used for interfacial partitioning tracer tests. Inspection of the microtomography data showed that multiple injections of fluid caused no measurable displacement of the glass beads, indicating stable packs.
Figure 4.
Cross-sectional (x-y) image of the column packed with glass beads. Glass beads are light gray, water is dark gray, and tetrachloroethene is white.
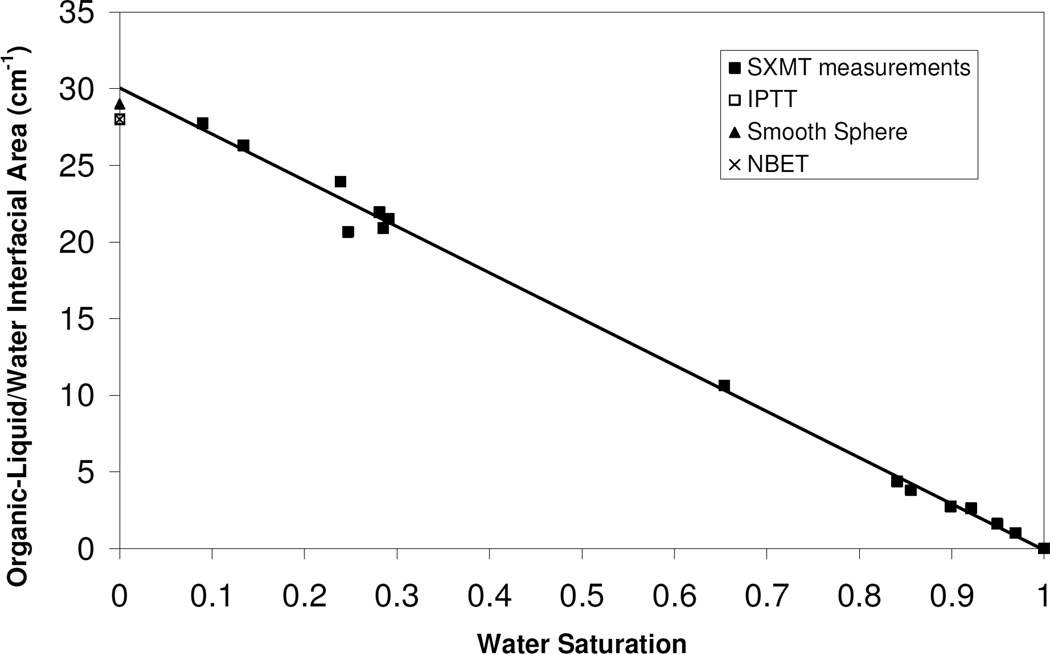
The organic–liquid/water interfacial areas obtained from microtomography represent total (capillary and film) area, and are presented in Figure 5. The figure includes data from primary drainage as well as secondary imbibition (residual saturation). The interfacial area measured via microtomography is observed to increase linearly with decreasing wetting-phase saturation over the range investigated. These results are consistent with the results of prior theoretical, computational, and experimental studies (e.g., Leverett, 1941; Schaefer et al., 2000; Dalla et al., 2002; Brusseau et al., 2006, 2007, 2009; Costanza-Robinson et al., 2008).
Figure 5.
Organic-liquid/water interfacial areas, measured using synchrotron X-ray microtomography (SXMT), as a function of water saturation. Values of specific solid surface area obtained using interfacial partitioning tracer tests (IPTT), the smooth sphere assumption, and by nitrogen BET analysis (NBET) are displayed on the y-axis.
The mean specific organic-liquid/water interfacial area measured for the columns with a residual nonwetting-phase saturation was 2.7 ± 2 cm−1, which is very similar to the mean value measured with the IPTT method. The linear Anw-Sw function illustrated in Figure 5 is described by the equation Anw = 30(1-Sw). Using this equation, a value for organic-liquid/water interfacial area based on the composite data set can be determined for any given wetting-phase saturation. A specific organic-liquid/water interfacial area of 2.7 ± 2 cm−1 was calculated using the composite data for the weighted-mean wetting-phase saturation associated with the IPTT experiments (0.91). This value is identical to the value determined for the individual residual-saturation microtomography experiments, and is also essentially identical to the mean specific interfacial area measured with the IPTT method (2.8 ± 5 cm−1).
The previously described Anw-Sw function takes the generic form Anw = Am(1-Sw), where Am is the maximum specific interfacial area. The Am, which is equivalent to interfacial area normalized by non-wetting fluid volume, serves as an index for a given system, indicative of the magnitude of interfacial area associated with that system (Brusseau et al., 2009). The maximum specific interfacial area obtained from the microtomography data is 30 ± 2 cm−1. This value is similar to the maximum specific interfacial area determined for the IPTT data (calculated as Am = Anw/Sn), which is 28 cm−1 ± 5. The maximum specific interfacial area represents the specific interfacial area at a nonwetting fluid saturation of 100% (water saturation of zero). In this case all non-wetting fluid surface area is theoretically in contact with solid surfaces and vice versa, and thus Am is equivalent to the specific solid surface area. Therefore, maximum specific interfacial areas can be compared to specific solid surface areas to evaluate the robustness of the interfacial-area measurement methods. The Am values from both IPTT and microtomography are essentially identical to the volume-normalized specific solid surface area of 29 ± 10 cm−1 calculated for the glass beads using the smooth-sphere assumption. The two values are also are essentially identical to the volume-normalized specific solid surface area (28 ± 2 cm−1) measured using the N2/BET method. The similarity of the smooth-sphere and NBET solid surface areas is consistent with the absence of surface roughness for this medium. The values of specific solid surface area obtained from each of the methods are plotted in Figure 5. The consistency of the results supports the robustness of the microtomography and IPTT methods
SUMMARY
The interfacial partitioning tracer test method and high-resolution microtomography were used to measure interfacial area between an organic immiscible liquid and water for an ideal glass-beads medium that has no measurable surface roughness. The measured interfacial areas obtained with the two methods were essentially identical. This result shows that the two methods provide comparable characterization of fluid-fluid interfacial area in the absence of surface-roughness effects. The results support the hypothesis that the disparities between interfacial areas measured with the two methods observed in prior studies were due to the impact of surface roughness. The similarity of the measured maximum interfacial areas to the specific solid surface areas supports the robustness of the IPTT and microtomography methods.
ACKNOWLEDGEMENT
This research was funded by the NIEHS Superfund Basic Research Program (Grant #E504940). Imaging experiments were performed in part at GeoSoilEnviroCARS (Sector 13), Advanced Photon Source (APS), Argonne National Laboratory. GeoSoilEnviroCARS is supported by the National Science Foundation-Earth Sciences (EAR-0217473), Dept. of Energy-Geosciences (DE-FG01-94ER14466) and the State of Illinois. Use of the APS was supported by the U.S. Department of Energy, Basic Energy Sciences, Office of Energy Research, under Contract No. W-31-109-Eng-38. Imaging experiments were also performed in part at the 8.3.2 beamline at the Advanced Light Source (ALS), Lawrence Berkeley National Laboratory, CA. The Advanced Light Source is supported by the Director, Office of Science, Office of Basic Energy Sciences, of the U.S. Department of Energy under Contract No. DE-AC02-05CH11231. The authors would like to thank Dr. Mark Rivers (APS), Dr. Alastair MacDowell (ALS), Dr. Eric Schaible (ALS), and Dr. Chris Eastoe (UA) for their assistance, and the reviewers for their constructive comments.
REFERENCES
- Al-Raoush RI, Willson CS. A pore-scale investigation of a multiphase porous media system. J. Contam. Hydrol. 2005;77:67–89. doi: 10.1016/j.jconhyd.2004.12.001. [DOI] [PubMed] [Google Scholar]
- Anwar AHMF, Bettahar M, Matsubayashi U. A method for determining air-water interfacial area in variably saturated porous media. J. Contam. Hydrol. 2000;43:129–146. [Google Scholar]
- Brusseau ML, Popovicova J, Silva JAK. Characterizing gas-water interfacial and bulk-water partitioning for gas-phase transport of organic contaminants in unsaturated porous media. Environ. Sci. Technol. 1997;31:645–1649. [Google Scholar]
- Brusseau ML, Peng S, Schnaar G, Costanza-Robinson MS. Relationships among air-water interfacial area, capillary pressure, and water saturation for a sandy porous medium. Water Resour. Res. 2006;42:W03501. [Google Scholar]
- Brusseau ML, Peng S, Schnaar G, Murao A. Measuring air-water interfacial areas with X-ray microtomography and interfacial partitioning tracer tests. Environ. Sci. Technol. 2007;41:1956–1961. doi: 10.1021/es061474m. [DOI] [PubMed] [Google Scholar]
- Brusseau ML, Janousek H, Murao A, Schnaar G. Synchrotron X-ray microtomography and interfacial partitioning tracer test measurements of NAPL-water interfacial areas. Water Resour. Res. 2008;Vol. 44:W01411. doi: 10.1029/2006WR005517. [DOI] [PMC free article] [PubMed] [Google Scholar]
- Brusseau ML, Narter M, Schnaar S, Marble J. Measurement and estimation of organic-liquid/water interfacial areas for several natural porous media. Environ. Sci. Technol. 2009;43(10):3619–3625. doi: 10.1021/es8020827. [DOI] [PMC free article] [PubMed] [Google Scholar]
- Cho J, Annable MD. Characterization of pore scale NAPL morphology in homogeneous sands as a function of grain size and NAPL dissolution. Chemo. 2005;61:899–908. doi: 10.1016/j.chemosphere.2005.04.042. [DOI] [PubMed] [Google Scholar]
- Costanza M, Brusseau ML. Influence of Adsorption at the Air-Water Interface on the Transport of Volatile Contaminants in Unsaturated Porous Media. Environ. Sci. Technol. 2000;34(1):1–11. 2000. [Google Scholar]
- Costanza-Robinson MS, Brusseau ML. Air-water interfacial areas in unsaturated soils: Evaluation of interfacial domains. Water Resour. Res. 2002;38:13-1–13-17. [Google Scholar]
- Costanza-Robinson MS, Harrold KH, Lieb-Lappen RM. X-ray microtomography determination of air--water interfacial area--water saturation relationships in sandy porous media. Environ. Sci. Technol. 2008;42:2949–2956. doi: 10.1021/es072080d. [DOI] [PubMed] [Google Scholar]
- Culligan KS, Wildenschild D, Christensen, Britt SB, Gray WG, Rivers ML, Tompson AFB. Interfacial area measurements for unsaturated flow through a porous medium. Water Resour. Res. 2004;40:W12413. [Google Scholar]
- Culligan KA, Wildenschild D, Christensen BSB, Gray WG, Rivers ML. Pore-scale characteristics of mulitphase flow in porous media: A comparison of air-water and oil-water experiments. Adv. Water Resour. 2006;29:227–238. [Google Scholar]
- Dalla E, Hilpert M, Miller CT. Computation of the interfacial area for two-fluid porous medium systems. J. Contam. Hydrol. 2002;56:25–48. doi: 10.1016/s0169-7722(01)00202-9. [DOI] [PubMed] [Google Scholar]
- Dobson R, Schroth MH, Oostrom M, Zeyer J. Determination of NAPL-water interfacial areas in well-characterized porous media. Environ. Sci. Technol. 2006;40:815–822. doi: 10.1021/es050037p. [DOI] [PubMed] [Google Scholar]
- Israelachvili J. Intermolecular and Surface Forces. London: Academic; 1992. p. 480. [Google Scholar]
- Jain V, Bryant S, Sharma M. Influence of wettability and saturation on liquid-liquid interfacial area in porous media. Envrion. Sci. Technol. 2003;37:584–591. doi: 10.1021/es020550s. [DOI] [PubMed] [Google Scholar]
- Karkare MV, Fort T. Determination of the air-water interfacial area in wet “unsaturated” porous media. Langmuir. 1996;12:2041–4044. [Google Scholar]
- Ketcham RA. Computational methods for quantatative analysis of three-dimensional features in geological specimens. Geosphere. 2005;1(1):32–41. [Google Scholar]
- Kim H, Rao PSC, Annable MD. Determination of effective air-water interfacial area in partially saturated porous media using surfactant adsorption. Water Resour. Res. 1997;33:2705–2711. [Google Scholar]
- Kim H, Rao PSC, Annable MD. Gaseous tracer technique for estimating air-water interfacial areas and interface mobility. Soil Sci. Soc. Am. J. 1999;63:1554–1560. [Google Scholar]
- Kinney JH, Haupt DL, Nichols MC, Breunig TM, Marshall GW, Jr, Marshall SJ. The X-ray Tomographic Microscope : three-dimensional perspectives of evolving microstructures. NIM. 1994;A347:480–486. [Google Scholar]
- Leverett MC. Capillary behavior in porous solids. Trans. A.I.M.E. 1941;142:152–169. [Google Scholar]
- Peng S, Brusseau ML. The impact of soil texture on air-water interfacial areas in unsaturated sandy porous media. Water Resour. Res. 2005;Vol. 41(No. 3):W03021. [Google Scholar]
- Prodanovic M, Lindquist WB, Seright RS. Porous structure and fluid partitioning in polyethylene cores from 3D X-ray microtomographic imaging. J. Coll. Interf. Sci. 2006;298:282–297. doi: 10.1016/j.jcis.2005.11.053. [DOI] [PubMed] [Google Scholar]
- Philip JR. Adsorption and capillary condensation on rough surfaces. J. Phys. Chem. 1978;82:1379–1385. [Google Scholar]
- Rivers M. CARS software developments. 2003 http://cars9.uchicagoedu/software/index.html.
- Saripalli KP, Kim H, Rao PSC, Annable MD. Measurement of specific fluid-fluid interfacial areas of immiscible fluids in porous media. Environ. Sci. Technol. 1997;31:932–936. [Google Scholar]
- Saripalli KP, Rao PSC, Annable MD. Determination of specific NAPL-water interfacial areas of residual NAPLs in porous media using the interfacial tracers technique. J. Contamin. Hydrol. 1998;30:375–391. [Google Scholar]
- Schaefer CE, Dicarlo DA, Blunt MJ. Determination of water-oil interfacial area during 3-phase gravity drainage in porous media. J. Coll. Inter. Sci. 2000;221:308–312. doi: 10.1006/jcis.1999.6604. [DOI] [PubMed] [Google Scholar]
- Schnaar G, Brusseau ML. Pore-scale characterization of organic immiscible-liquid morphology in natural porous media using synchrotron X-ray microtomography. Environ. Sci. Technol. 2005;39:8403–8410. doi: 10.1021/es0508370. [DOI] [PubMed] [Google Scholar]
- Schnaar G, Brusseau ML. Characterizing pore-scale configuration of organic immiscible liquid in multiphase systems with synchrotron X-ray microtomography. Vadose Zone J.l. 2006a;5:641–648. [Google Scholar]
- Schnaar G, Brusseau ML. Characterizing pore-scale dissolution of organic immiscible liquid in natural porous media using synchrotron X-ray microtomography. Environ. Sci. Technol. 2006b;40:6622–6629. doi: 10.1021/es0602851. [DOI] [PubMed] [Google Scholar]
- University of Ghent Center for X-ray Tomography website. http://www.ugct.ugent.be/software.php.
- Wardlaw NC, McKellar M. Oil Blob Populations and Mobilization of Trapped Oil in Unconsolidated Packs. Canad. J. Chem. Engin. 1985;63:525–531. [Google Scholar]


