Abstract
The degradation of ultrasonic image quality is typically attributed to aberration and reverberation. Although the sources and impact of aberration are well understood, very little is known about the source and impact of image degradation caused by reverberation. Reverberation is typically associated with multiple reflections at two interfaces along the same propagation path, as with the arterial wall or a metal sphere. However, the reverberation that results in image degradation includes more complex interaction between the propagating wave and the tissue. Simulations of wave propagation in realistic and simplified models of the abdominal wall are used to illustrate the characteristics of coherent and diffuse clutter generated by reverberation. In the realistic models, diffuse reverberation clutter is divided into that originating from the tissue interfaces and that originating from sub-resolution diffuse scatterers. In the simplified models, the magnitude of the reverberation clutter is observed as angle and density of the connective tissue are altered. The results suggest that multi-path scattering from the connective tissue/fat interfaces is a dominant component of reverberation clutter. Diffuse reverberation clutter is maximal when the connective tissue is near normal to the beam direction and increases with the density of connective tissue layers at these large angles. The presence of a thick fascial or fibrous layer at the distal boundary of the abdominal wall magnifies the amount of reverberation clutter. The simulations also illustrate that compression of the abdominal layer, a technique often used to mitigate clutter in overweight and obese patients, increases the decay of reverberation clutter with depth. In addition, rotation of the transducer or steering of the beam with respect to highly reflecting boundaries can reduce coherent clutter and transform it to diffuse clutter, which can be further reduced using coherence-based beamforming techniques. In vivo images of the human bladder illustrate some of the reverberation effects observed in simulation. (E-mail: jjd@duke.edu) © 2014 World Federation for Ultrasound in Medicine & Biology.
Keywords: Ultrasonic imaging, Clutter, Reverberation, Acoustic noise, Artifact
INTRODUCTION
The degradation of ultrasonic image quality has typically been attributed to two primary sources, aberration and reverberation (Pinton et al. 2011). Aberration occurs when the ultrasonic wavefronts are distorted as a result of local changes in the speed of sound. Aberration can distort the beam shape, which reduces resolution, and alter the steering direction of the beam. In addition, aberration can increase beam side lobes, which increases scattering from off-axis locations, thereby introducing unwanted fill-in or obfuscation of tissue structures and reducing contrast. Reverberation occurs when the acoustical wave is reflected two or more times between tissue interfaces. The unwanted, multiple-reflected signal will then arrive at the transducer at the same time as the desired acoustical echo from deeper within tissue and obscure the targeted structures. The undesired echoes that cause fill-in and loss of contrast, resulting from either aberration or reverberation, are referred to as clutter.
In the case of aberration, the complexities of tissue structure that result in image degradation are often replaced by far simpler models, such as a thin phase screen. Aberration is typically associated with the thickness or local inhomogeneities of the fat in the subcutaneous layer. In the case of reverberation, the tissue layers or structures that cause multiple reflections are not well defined. The identification of the offending layers in reverberation is often unspecified, except in the most basic or obvious cases.
Numerous models of aberration and methods to correct for aberration have been proposed (Fink 1992; Lin and Waag 2002; Liu and Waag 1994; Ng et al. 1994; Varslot et al. 2004). In a more sophisticated method, Salahura et al. (2010) created a tissue model from magnetic resonance scans of breast tissue and used the model to compare simulated distortion of the transmitted beam caused by fat and connective tissue with experimental measurements. Although they did not introduce a specific model of aberration, they found that the aberration predicted by finite-difference time-domain solutions to the wave equation could be used to illustrate accurate modeling of aberration in tissue.
There are few studies regarding the sources of clutter from reverberation. Rau et al. (2013) describe some basic models of reverberation between a limited number of reflections. In an experimental study by Robinson et al. (1994), the effect of the abdominal wall on image quality was observed in an animal model. In this study, the abdominal wall of a pig was reduced, layer by layer, and image quality was found to increase as each layer was removed. The authors concluded that the abdominal wall was largely responsible for the aberrations and reverberation that degraded the image quality. In Pinton et al. (2011), aberration-induced image degradation was isolated from reverberation-induced degradation, and each mechanism’s impact on fundamental and harmonic imaging was observed. It was concluded that the contribution of reverberation clutter to image degradation at the fundamental frequency was, on average, equal to the degradation cause by aberration. In addition, the magnitude of in vivo clutter has been measured in human bladders and found to have magnitudes 10 to 15 dB less than those of the proximal bladder wall (Lediju et al. 2008).
Despite the few studies analyzing reverberation clutter, there are several proposed methods to mitigate clutter, including tissue harmonic imaging (Averkiou et al. 1997; Christopher 1997), second-order ultrasound field imaging (Nåsholm et al. 2009), short-lag spatial coherence (SLSC) imaging (Dahl et al. 2012; Lediju et al. 2011) and filtering techniques (Lediju et al. 2009; Mauldin et al. 2011). Tissue harmonic imaging largely suppresses reverberation clutter originating from tissue layers in close proximity to the transducer because a sufficient propagation distance is required for generation of the harmonic signals. This is useful if harmonics are generated beyond these tissue layers; however, it can be susceptible to the larger subcutaneous tissue layers of overweight and obese individuals and is more susceptible to degradation by aberration than the fundamental frequency (Pinton et al. 2011).
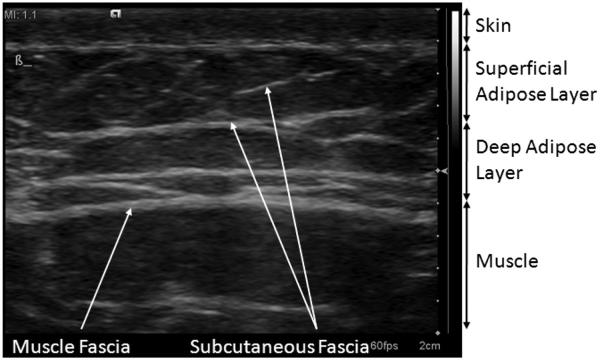
The abdominal wall is structurally divided into several layers. At the top is a layer of skin, followed by the superficial adipose layer, also called Camper’s fascia. This layer contains pockets of adipose tissue (fat) surrounded by connective tissue that provide support to the adipose tissue. Beneath this layer is the deep adipose layer, called Scarpa’s fascia, which is separated from the superficial adipose layer by a thick band of connective tissue. The deep adipose layer contains the same tissue types found in the superficial adipose layer, but tends to have a different density and structure of connective tissue networks (Markman and Barton 1987). The deep adipose layer has connective tissue that is less organized and layered at angles near parallel to the skin surface. Beneath the deep adipose layer are the abdominal muscles, separated from the adipose layer by another thick connective tissue band known as muscle fascia. Figure 1 is a high-frequency ultrasound image of the abdominal layers in a 34-y-old man, illustrating the two adipose layers and the connective tissue networks in them. The visible connective tissue is located at large angles relative to the skin surface and has the criss-cross pattern common in male subcutaneous tissue (Mirrashed et al. 2004; Querleux et al. 2002; Rosenbaum et al. 1998).
Fig. 1.
Subcutaneous tissue layers in the abdomen of a 34-y old male. The subcutaneous tissue is divided into two major layers: the superficial adipose layer and the deep adipose layer. These layers are separated and bounded by large continuous sheets of connective tissue. The image is acquired from a Siemens S2000 system with a 14 L5 transducer in tissue harmonic imaging mode (transmit frequency = 7 MHz) and exhibits 70 dB of dynamic range with the default settings of the system.
We hypothesize that complex geometry or networks of tissues having a high impedance mismatch between the tissue types can trap some of the propagating acoustical waves and return unwanted echoes back to the transducer. For example, the pockets of fat and supporting connective tissue (also called fascial septa) in the two adipose layers have markedly different characteristic impedances and may cause an acoustical wave to be reflected several times within these pockets. These reflections, however, ultimately depend on the organization of the connective tissue network, which depends on its location (superficial vs. deep) and the gender of the individual (Markman and Barton 1987; Mirrashed et al. 2004; Querleux et al. 2002; Rosenbaum et al. 1998). Women, for example, tend to have well-organized connective tissue networks in the superficial adipose layer, where the connective tissue layers are approximately normal to the skin surface. Men tend to have fascial layers that criss-cross at large angles relative to the skin surface (Mirrashed et al. 2004; Querleux et al. 2002; Rosenbaum et al. 1998). These models tend to be simplistic in comparison to actual human anatomy (Querleux et al. 2002), and not all males and females conform to these models. However, they serve to illustrate differences in connective tissue networks and the possible factors affecting clutter and its magnitude. The objective of this study was to determine the factors and characteristics of subcutaneous tissue that contribute to reverberation and the image degradation it generates.
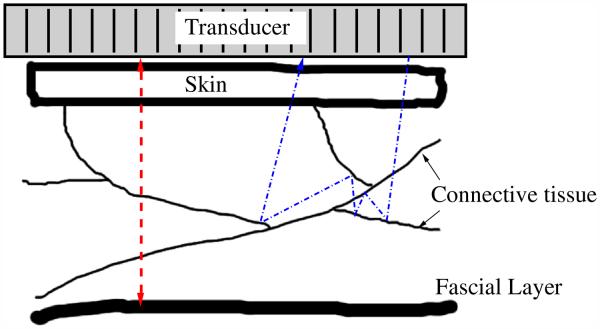
In the following, we define two types of reverberation clutter: coherent and diffuse. Coherent reverberation clutter, or coherent clutter, originates from strong specular reflectors, such as bladder walls, arterial walls and thick fascial layers, where the layer is normal to the beam direction. The acoustic waves in this situation are typically reflected along or close to the same path as the incident wave, as illustrated in Figure 2. The multiply reflected waves can yield a moderate to strong specular-like artifact in the image, or they may form replicas of the anatomy if the intermediate scattering (i.e., scattering from structures between the major reflections) between the two reflecting boundaries is weak. A common example of a coherent reverberation artifact is the so-called ghost vessel artifact (Buttery and Davison 1984; Middleton and Melson 1990). A “ghost” vessel is formed when there is reverberation of the ultrasonic pulse between the proximal and distal walls of an artery. This vessel artifact appears distal to the artery, complete with a Doppler signal. Diffuse reverberation clutter, or diffuse clutter, has a speckle-like appearance in ultrasonic images, and may look no different than tissue. There are currently no models of diffuse clutter; however, we hypothesize that diffuse clutter originates from multi-path or multiple scattering of structures. We hypothesize that this may occur during a round-trip path from a specular surface or from propagation through a network of strong specular reflectors (see Fig. 2).
Fig. 2.
Diagram of the possible paths for reverberation echoes. The dashed line on the left represents the path of a wavefront as it reflects back and forth off a thick fascial layer and the transducer face. If the scattering from the connective tissue is weak, then a replica of the abdominal wall will appear below, with blurring caused by focusing errors. If the scattering from the connective tissues is strong, then a wavefront may reflect many times off the connective tissue layers, either along the same path or along multiple paths, as shown by the dashed-dotted line on the right. A combination of both types of scattering is also possible.
METHODS
In vivo examples of commonly observed image clutter were obtained to illustrate the characteristics of image clutter and to relate them to controlled simulations. The simulations employed a full-wave, non-linear acoustic (FWNA) propagation method, which is a finite-difference time- domain implementation of the Westerveldt equation (Pinton et al. 2009). The FWNA simulator is capable of simulating realistic ultrasound images and includes the effects of scattering, aberration, attenuation and harmonic signal generation. The method is able to simulate wave propagation through complex tissue structure and is capable of illustrating clutter resulting from reverberation, aberration and off-axis scattering. The simulation tool is used to evaluate the impact of subcutaneous tissue structure on ultrasonic image clutter, including the effect of compression of tissue layers, the angle and density of the connective tissue network and the angle of the tissue layers relative to the transducer.
In vivo human bladder
The full bladder is a useful target for observing clutter originating from abdominal layers because the bladder is a large anechoic void in close proximity to the abdominal wall. No signal is expected within the bladder, and therefore, any signal detected by the transducer originating from the bladder cavity should be directly related to reverberation artifact, off-axis scatterers or electronic noise.
Example images of in vivo human bladder demonstrating reverberation clutter were obtained to compare with simulations. All volunteers were recruited under an institutional review board-approved protocol (Registry No. Pro00032003), and informed consent was obtained for each volunteer before imaging. A 4 C1 transducer (Siemens Medical Solutions USA, Issaquah, WA, USA) was placed over the full bladder of the volunteer, and the beamformed radiofrequency (RF) signals were acquired with a Siemens Acuson S2000 ultrasound scanner using the Axius Direct Ultrasound Research Interface (Brunke et al. 2007). The RF signals were converted to baseband, scan converted and compressed using a logarithmic scale. The dynamic range chosen to display the in vivo images were selected so that the reconstructed images were matched closely with the display of the scanner.
Simulations
Six 2-D models of human abdominal wall were obtained courtesy of the Diagnostic Ultrasound Research Laboratory at the University of Rochester (Hinkelman et al. 1996; Mast et al. 1997; Tabei et al. 2003). These models were created from segmentation of histological samples of human cadaveric abdominal walls. The acoustical properties for skin, fat, muscle and connective tissue were assigned to their associated regions in the model, and ideal acoustic properties were assigned to a homogeneous, non-scattering region beneath the abdominal tissue. The acoustic properties used for these tissues are summarized in Table 1. The values for speed of sound, density and attenuation were obtained from the compiled tables in Goss et al. (1978, 1980). The values for the non-linear parameter, B/A, were obtained from the compiled table in Hamilton and Blackstock (2008).
Table 1.
Acoustic parameters used in the subcutaneous tissue models with the FWNA simulations tool
| Tissue | Speed of sound (m/s) |
Density (g/mL) |
Attenuation (dB/cm/MHz) |
Non-linear parameter, B/A |
|---|---|---|---|---|
| Skin | 1498 | 1000 | 2.1 | 8.0 |
| Fat | 1479 | 950 | 0.4 | 9.6 |
| Connective tissue | 1600 | 1070 | 0.5 | 8.0 |
| Muscle | 1566 | 1070 | 0.15 | 9.0 |
| Ideal tissue | 1540 | 1000 | 0.5 | 9.0 |
The imaging medium was described by a 2-D grid with a spatial resolution of 30.8 μm in both dimensions, and encompassed an area 2.75 cm in width and 5.5 cm in depth. Scattering in the subcutaneous tissues was produced using point scatterers having a spatial density of 12 scatterers per resolution cell. The scatterers had a random spatial position and uniform random amplitude. Amplitude was defined by the difference in speed of sound from the surrounding medium. The mean variation in the speed of sound of the scatterers was 77 m/s, corresponding to a ±5% variation about the average tissue velocity of 1540 m/s. No scattering was included in the homogeneous tissue below the subcutaneous layer so that any signal received by the transducer would be a direct result of reverberation artifact.
Ultrasound pulses, with an F/2 focus at 5 cm, were simulated from a 128-element, 2.5-MHz linear array. The RF element signals for 51 image lines were obtained for each of the six abdominal layers. Images containing 51 lines were formed by sampling the pressure field at 41.7 MHz at the transducer surface and beamforming the sampled signals using conventional delay-and-sum beamforming. The RF signals were converted to baseband, and logarithmic compression was applied to generate B-mode images. Clutter magnitude was determined from the average of the uncompressed image lines in the area beneath the subcutaneous tissue and normalized to the magnitude of the distal wall (the bottom muscular fascial layer) of the subcutaneous tissue.
A second and third group of simulations were performed having the same parameters as previously described but using only the abdominal tissue (without the scatterers) and using only the scatterers (without the abdominal tissue). For each of these groups of simulations (complete layer, abdominal tissue only and scatterers only), the abdominal layers were compressed to 80%, 60%, 40% and 20% of their original thicknesses, under the assumption that the abdominal wall is a perfectly incompressible medium. The abdominal layer was assumed to deform as a single entity (meaning the tissue types did not act independently) and was compressed using a non-rigid transform where the decrease in thickness was matched by an equivalent increase in width. In addition, the compression was uniform throughout the abdominal layer. The medium below the abdominal tissues was not deformed during compression. Deformations were interpolated to the discrete grid spacing describing the imaging medium.
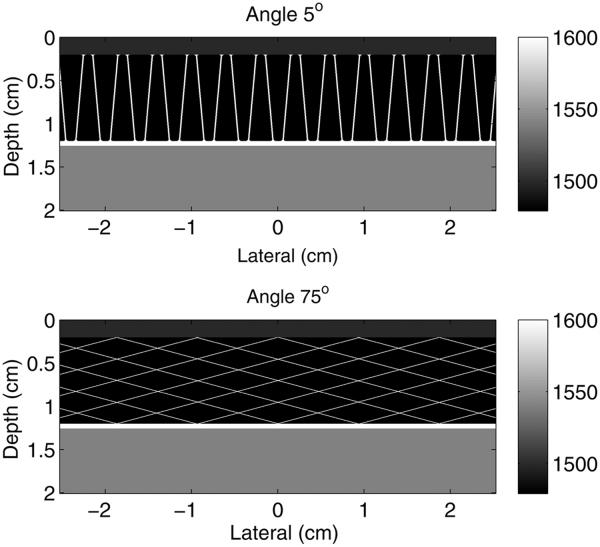
Simplified models of the superficial adipose layer were created to observe the effects of connective tissue angle and density on the magnitude of incoherent clutter. Connective tissue networks with varying angles and densities of connective tissue layers in the network were superimposed on fatty tissue for these simplified models. The angle of the connective tissue was varied from 1° to 85° relative to the transducer normal, and the density of the connective tissue networks was varied from 1 connective tissue layer per square centimeter (ctl/cm2) to 9 ctl/cm2. The connective tissue septa were modeled with a thickness of 0.25λ. A layer of skin, 2 mm thick, was added to the surface boundary. Models were simulated with and without a larger connective tissue layer placed at the distal boundary. The acoustical properties in Table 1 were used for the corresponding tissue types. A homogeneous region of ideal tissue was placed beneath the simplified connective tissue network. No scatterers were used with the simplified models, and all simulation parameters and signal processing methods were identical to those used with the histologic model, with the exception that only 31 image lines were obtained. Examples of the simplified models with connective tissue angles of 5° and 75° are provided in Figure 3.
Fig. 3.
Example models of the simplified subcutaneous tissue models used in the non-linear, full-wave simulation method illustrating (top) shallow (5°) and (bottom) steep (75°) angles relative to the direction of beam propagation. The full simulation field has been cropped to better illustrate the models of the subcutaneous anatomy.
Simulations were performed in two experiments to determine the impact of connective tissue angle on reverberation clutter. In the first experiment, one of the abdominal wall samples was rotated by 5°, 10° and 15° relative to its initial position. In the other experiment, the aperture was divided into four distinct apertures (left, center left, center right and right), as is done is spatial compounding. Images of the abdominal wall sample and its reverberation clutter were generated from each of the four subapertures and compared with the image generated from the full aperture.
RESULTS
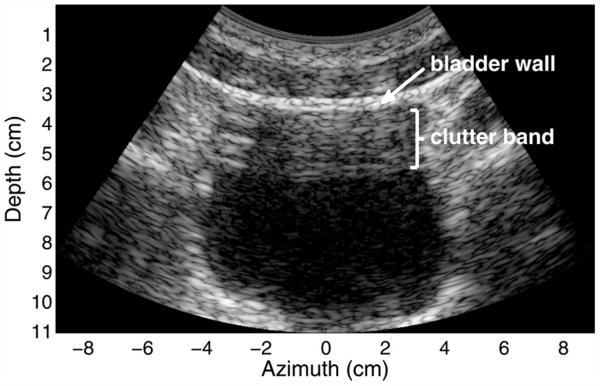
A B-mode image of an in vivo healthy human bladder of a 37-y-old man with a body mass index of 25.9 is provided in Figure 4. The image shows 50-dB of dynamic range with logarithmic compression. There are few scatterers within the urine, and therefore, the bladder cavity should normally appear black. In this image, a well-defined band of clutter is present in the top portion of the bladder. The thickness of this band is approximately equal to the distance between the transducer and the fascial/bladder interface, indicating that the thicker fascial or fibrous layers, which are often perpendicular to the direction of the beam, have a significant impact on the reverberation clutter. In addition, this band of clutter exhibits a combination of both coherent and diffuse reverberation clutter. Coherent clutter is easily visible in the upper left portion of the bladder cavity as several discrete, bright lines. More subtle, coherent clutter is visible at the bottom center of the clutter band, where it appears as long lines of lower magnitude. Diffuse clutter is observed by the appearance of speckle in the majority of the clutter band. This speckle texture is much like the texture observed from tissue containing sub-resolution, diffuse scatterers and is an indication that the diffuse reverberation clutter has no or partial spatial coherence in its sampled wavefronts.
Fig. 4.
In vivo image of a human bladder demonstrating a band of clutter in the proximal region of the bladder. The image exhibits 50 dB of dynamic range. Coherent clutter is visible in the upper left of the bladder cavity and more subtly at the bottom of the clutter band. Diffuse clutter is present throughout the band.
Figure 5 is a B-mode image from a FWNA simulation with abdominal wall sample 1 and an anechoic region below the abdominal layer. The B-mode image has logarithmic compression of the gray-scale values and exhibits 60 dB of dynamic range. The dynamic range of the FWNA simulation is slightly larger than that of a clinical scanner (by approximately 15–20 dB) and, therefore, requires a slightly larger display range than the clinical image in Figure 4. This abdominal wall’s thickness was approximately 2 cm, with the last fascial layer of the abdominal model appearing at a depth of 2 cm. The connective tissue is visible as the bright bands in the upper portion of the image. Because no scatterers are present in the region beneath the abdominal wall, there should be no reflections from that region, and the observed texture appearing from 2 to 4 cm in the image in Figure 5 is therefore a product of reverberation. This clutter band consists largely of diffuse clutter, with subtle coherent clutter appearing near the bottom of the band like that observed in the in vivo example.
Fig. 5.
Simulated ultrasound image of an abdominal wall with an anechoic region beneath it, exhibiting 60 dB of dynamic range. The abdominal wall generates diffuse and coherent acoustic noise in the region beneath it. The acoustic noise here is similar in composition to that observed in the in vivo bladder.
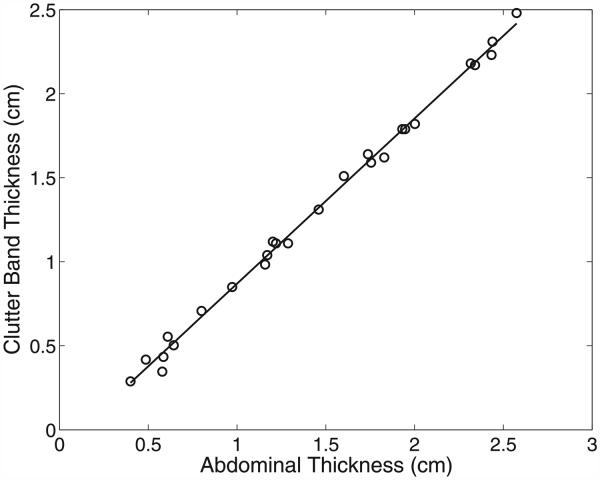
In Figure 6, the size of this clutter band for all of the abdominal wall simulations is plotted as a function of the abdominal thickness. The size of the clutter band was measured manually from the average magnitude of the lines in each image. Size was measured as the distance from the known location of the distal boundary of the abdominal wall (plus or minus a wavelength because of the slight variations in thickness across the wall) to the point where the magnitude of the band dropped precipitously. The known thicknesses of the uncompressed abdominal walls are listed in Table 2. Additional wall thicknesses were obtained by compressing the models to 80%, 60%, 40% and 20% of their initial thickness. The thickness of the clutter band is highly correlated (r = 0.999) with the thickness of the abdominal layer, where the slope of the regression line in Figure 6 is 0.98. This is consistent with the observations of the size of the clutter bands seen in the in vivo bladder and simulated images.
Fig. 6.
The thickness of the clutter band is highly correlated with the thickness of the abdominal wall. The equation of the regression line is y = 0.98x − 0.11, indicating that the thickness of the clutter band is nearly equal to the thickness of the abdominal wall.
Table 2.
Thickness of the abdominal wall models
| Wall sample | Thickness (cm) |
|---|---|
| 1 | 2.00 |
| 2 | 2.93 |
| 3 | 2.90 |
| 4 | 2.43 |
| 5 | 3.05 |
| 6 | 3.22 |
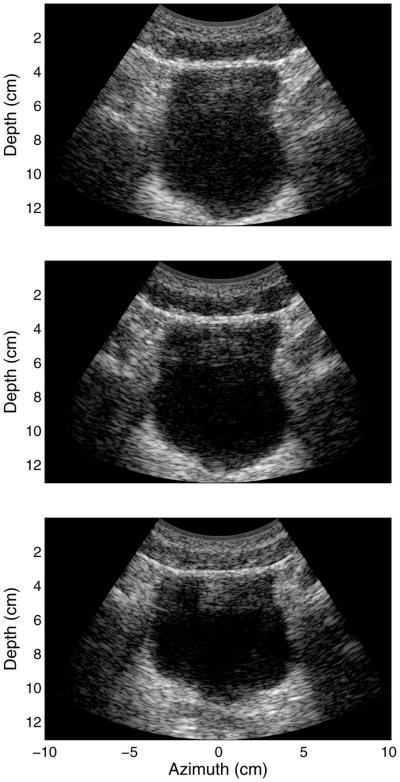
In Figure 7 are three images of the same bladder seen in Figure 4, where increasing amounts of compression are applied to the abdominal wall above the bladder, from top to bottom, respectively. All three images exhibit 50 dB of dynamic range. The top image displays diffuse reverberation artifact over the entire bladder cavity. As increasing compression is applied to the abdominal layers, clutter within the bladder cavity decreases, with only the aforementioned band of clutter still present in the upper portion of the bladder. The sizes of the clutter bands present in the middle and bottom images of Figure 7 are 2.50 and 2.04 cm, respectively.
Fig. 7.
In vivo images illustrating the compression of the abdominal wall above the bladder. The images exhibit 50 dB of dynamic range and illustrate increasing compression from top to bottom. Diffuse clutter within the bladder cavity decreases with increasing compression. The sizes of the visible clutter bands in the middle and bottom images are 2.50 and 2.04 cm, respectively.
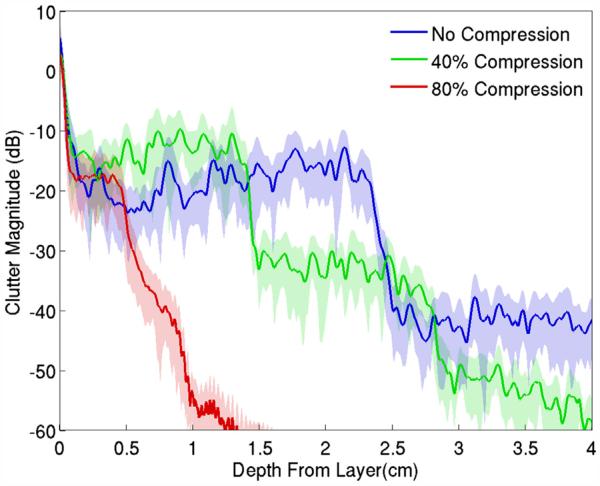
In Figure 8, the image clutter beneath the simulated abdominal wall for sample 1 is averaged over all image lines and plotted as a function of depth from the distal boundary of the abdominal wall (labeled “No Compression”). The 0-dB point on the y-axis of the graph is associated with the average magnitude of the signal within the abdominal wall. The clutter shows the distinct step observed previously, and as the wall is compressed, additional steps can be observed. These additional steps appear to have the same size and are related to the abdominal wall thickness. As the steps become shorter, the effective decay rate of the clutter increases.
Fig. 8.
Average magnitude of acoustical noise observed beneath the abdominal wall in Figure 5. The clutter exhibits a distinct staircase pattern associated with the thickness of the abdominal wall, with the step width decreasing as the wall is compressed. The standard deviation from the mean is represented by the shaded error bars.
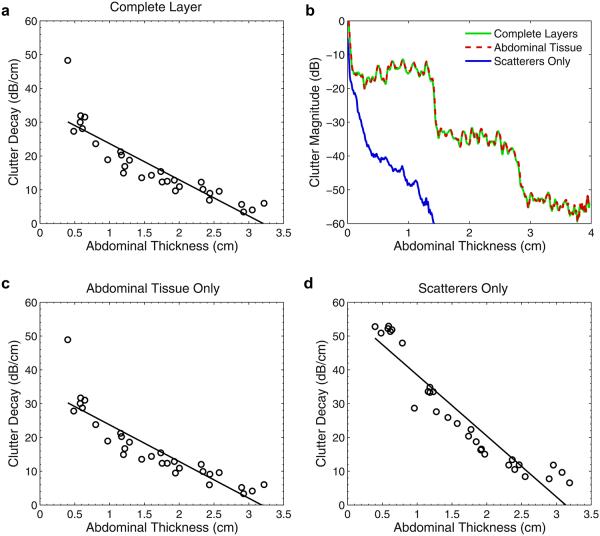
The decay of image clutter with depth for each of the six abdominal walls is summarized concisely in Figure 9(a). The magnitude of the image clutter was computed as a function of depth, as in Figure 8, and its decay is described by the slope, m, of the regression line y = mx + b fit to the logarithm of the clutter magnitude. The regression line was computed in the range from 0.2 cm beyond the abdominal wall (or scatter region in the case of only scatterers) to the last data sample, or where the magnitude reached the limit of the dynamic range of the FWNA simulator. In Figure 9, the decay values are plotted as a function of abdominal wall thickness for the complete layer, abdominal tissue only and scatterers only, and include the different thicknesses obtained by compression of the walls. Although the decay of the clutter resembles a staircase pattern (see Fig. 8) and is not necessarily linear on a logarithmic scale, this measure serves as a general and simple description of the clutter decay.
Fig. 9.
(a) Average decay in the magnitude of the clutter as a function of the thickness of the complete (tissue plus scatterers) abdominal wall. (b) By separating the sources of scattering into constituent parts, it is apparent that multi-path scattering between connective and other tissue is the dominant source of the clutter. (c) Average decay for tissue layers only. (d) Average decay for diffuse sub-resolution scatterers only.
Figure 9(b) is an example of the average clutter from one of the abdominal layers, where the magnitude of the clutter is separated into its constitutive scattering components. The clutter resulting from the tissue layers is nearly identical to the clutter generated by the complete layer. The scatterers exhibit a significantly different reverberation pattern that decays much more quickly than the tissue layers, indicating that the dominant source of the reverberation originated from multiple or multi-path scattering from the tissue interfaces. The same behavior is observed in all abdominal wall samples, where the decay values from the abdominal tissue without scatterers are virtually identical to those for the complete layers (Fig. 9c). The decay rates from the scatterers (Fig. 9d) exhibit much greater decay than both the complete layers and the abdominal tissue without scatterers. In addition, Figure 9 (c, d) illustrates that the clutter decay values are approximately linear with abdominal thickness, regardless of the constituent scattering component. The coefficients of determination for the regression lines in Figure 9(a, c and d) are 0.80, 0.79 and 0.89, respectively.
The attenuation of the fat was modified for sample 1 to determine the effects of fat attenuation on reverberation clutter. The attenuation values of the fat in these simulations were 0.2 and 0.6 dB/cm·MHz. The clutter decay values and magnitude at 1.5-cm depth were computed and are listed in Table 3, where they are compared with the nominal attenuation value of 0.4 dB/cm MHz. The impact of attenuation on the decay and magnitude of clutter is minimal, even for relatively large changes in attenuation. The difference in clutter decay from a change in attenuation from 0.2 to 0.6 dB/cm MHz is approximately 1 dB/cm.
Table 3.
Clutter decay and magnitude as a function of fat attenuation
| Attenuation (dB/cm MHz) | Decay (dB/cm) | Magnitude (dB) |
|---|---|---|
| 0.2 | −10.2 | −18.5 |
| 0.4 | −10.7 | −19.9 |
| 0.6 | −11.5 | −21.3 |
To estimate the potential impact of the connective tissue network on the diffuse clutter observed in vivo, the angle and density of connective tissue in an idealized abdominal wall model were varied. Figure 10 illustrates the changes in diffuse clutter magnitude as connective tissue angle and density are increased. Graphs are provided for these ideal models both with and without a thick fascial layer at the distal boundary of the abdominal wall. In human anatomy, thick fascial layers separate the deep from the superficial adipose layer, and the muscle from the deep adipose layer. Removal of the layer in simulation illustrates the impact of the layer on diffuse clutter. In Figure 10(a), clutter magnitude increases with the angle of the connective tissue relative to the direction of the beam propagation. There is a local maximum at approximately 45°, although this local maximum is attributed to the regularized structure of the connective tissue. There is a second local maximum at approximately 80°. This maximum occurs because the echoes tend toward discrete coherent reverberations as the angles approach beam normal, and the diffuse clutter between these coherent reverberations decreases significantly.
Fig. 10.

(a) Magnitude of diffuse clutter beneath the abdominal wall as a function of connective tissue angle with a connective tissue density of 2 connective tissue layers (ctl)/cm2. (b) Magnitude of diffuse clutter as a function of connective tissue density at an angle of 5°. (c) Magnitude as a function of connective tissue density at an angle of 75°.
In Figure 10(b, c), the magnitude of the image clutter as a function of density is seen to be dependent on the angle of the connective tissue layers. At a 5° angle, the density of layers does not affect the magnitude of the image clutter. At larger angles, such as 75° (Fig. 10c), increasing density generates significantly more clutter. The presence of a thick fascial layer normal to the direction of beam propagation has a large impact on the amount of diffuse clutter. This fascial layer can increase the overall amount of diffuse clutter by as much as 20 dB, regardless of connective tissue angle or density.
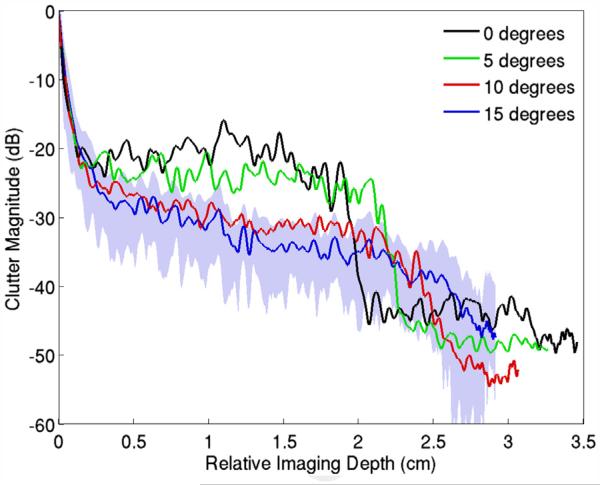
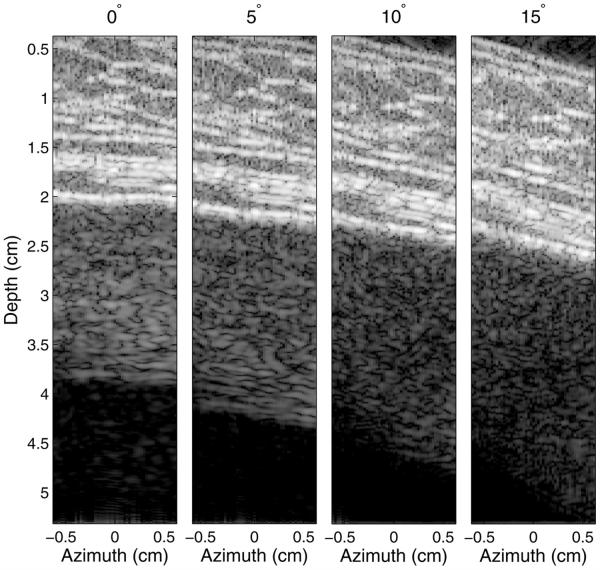
The impact of the angle between the abdominal wall and the transducer is illustrated in Figures 11 and 12. Here, the transducer was placed flat on abdominal wall sample 1 (as is done in conventional imaging) and then increasingly angled in 5° increments. Figure 11 illustrates that the average clutter magnitude below the abdominal layer changes from a step-like function to a relatively smooth decay over depth as the angle increases. The B-mode images, exhibiting 60 dB of dynamic range, corresponding to these plots are provided in Figure 12. The image generated at 0° is identical to that in Figure 5 and is displayed here for reference. There is clutter associated with coherent reverberation shown by the echoes with little variance in brightness across the azimuthal dimension, particularly at a depth of 4 cm. As the angle between the transducer and abdominal wall is increased, the coherent reverberation echoes disappear, and the clutter changes to a more diffuse form that has the appearance of speckle. The thickness of the clutter band broadens with increasing angle, but its magnitude decreases as the overall angle between the connective tissue layers and the direction of beam propagation decreases.
Fig. 11.
Average magnitude of reverberation clutter observed beneath an abdominal wall as the angle between the transducer and the wall is increased. The stepping pattern of the clutter gradually disappears with increasing angle. The composition of the clutter exhibits a greater amount of coherent clutter at low angles and changes to more diffuse clutter at the larger angles. The standard deviation from the mean is represented by the shaded error bars in the 15° plot. The standard deviations of the other plots are omitted for clarity.
Fig. 12.
Images illustrating the change in reverberation clutter as the angle between the transducer and abdominal wall is increased. The images exhibit 60 dB of dynamic range. The coherent clutter visible at 0° rotation becomes increasingly diffuse with increasing angle, while the diffuse clutter decreases in magnitude.
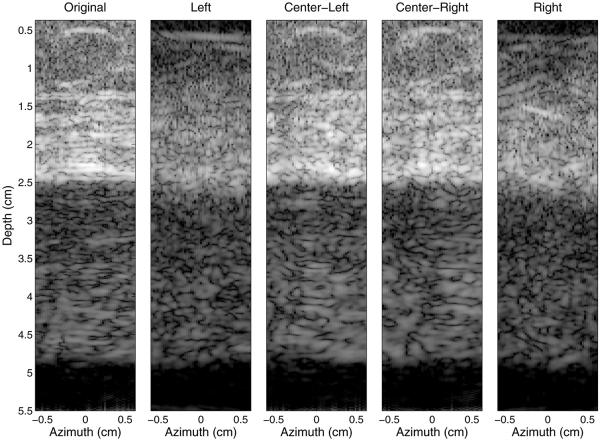
On the left of Figure 13 is an image of abdominal sample 4 and the reverberation clutter generated beneath it created with the full aperture (labeled “Original”). In the four sub-aperture images, the beams interrogate the same tissue at different angles, where the outer apertures interrogate the tissue at larger angles relative to the skin surface than the center apertures. In the images from the center sub-apertures (“Center-Left” and “Center-Right”), both coherent and diffuse reverberation clutter is visible, much like that observed in the original image. In the images of the outer apertures (“Left” and “Right”), the clutter is mostly diffuse reverberation artifact. There are differences between the sub-aperture and original images caused by the loss in resolution from the division of the aperture.
Fig. 13.
Simulated images illustrating the impact of the angle between the transmit beam and the connective tissue layers. From left to right are the original image of the abdominal layer and the resulting clutter using the full aperture, followed by images from each of the four sub-apertures. All images exhibit 60 dB of dynamic range. Coherent clutter is more visible from the two center sub-apertures than from the two outer apertures, which have smaller beam angles relative to the connective tissue.
DISCUSSION
The reverberation clutter illustrated in Figure 4 commonly occurs in bladder images, but can appear in other areas such as the heart, amniotic fluid and fetal structures, or large vasculature. This band of clutter is a combination of both coherent and diffuse reverberation clutter and yields characteristics similar to those of the simulations, as illustrated in Figure 5.
One potential mechanism that generates strong reverberation clutter is the presence of a planar fascial or fibrous layer, such as a thick connective tissue band or bladder wall, that is normal to the direction of beam propagation. The planar layer can reflect a significant amount of the wavefront’s energy back to the transducer, which also acts as a reflector of acoustic energy. The wave reflected from the transducer is large enough in amplitude to generate scattering from tissue as it propagates back into the medium. This results in a second “abdominal layer” appearing below the true layer, much like the ghost vessel artifact, although the structure of this second “abdominal layer” does not bear any resemblance to the original abdominal wall, with exception to a few coherent parts of the artifact. The simulated images exhibit high correlation between the thickness of this abdominal wall artifact and the thickness of the true abdominal wall (Fig. 6), much like the observed thickness of the in vivo artifact. These observations suggest that strong scattering from both the distal fascial layer and the connective tissue interfaces is the major source of reverberation.
The bladder in the top image of Figure 7 exhibits considerable diffuse clutter within its cavity. The clinical practice to avoid or reduce image clutter is to apply compression to the abdominal wall, as is illustrated by the middle and bottom images in Figure 7. The compression reduces the thickness of the abdominal wall and thereby decreases the path lengths of the reverberating waves. The compression also flattens the connective tissue planes, forces their angles toward 90° to the beam direction and increases the density of the connective tissue network, all of which can increase the magnitude of diffuse clutter. The effect is observed in Figure 6, where although compression at 40% has reduced the thickness of the primary band of image clutter, the magnitude has slightly increased. In addition, as the abdominal wall is compressed, additional steps of the same thickness at increasingly lower magnitude are observed, and illustrate the slight increase in magnitude compared with their corresponding steps in the uncompressed abdominal wall. The linear relationship between the decay of the clutter and the thickness of the abdominal wall is a result of the staircase pattern, where the step width is dependent on the thickness of the abdominal wall (Fig. 6). The step height does not change as rapidly as the thickness, resulting in a linear or near-linear change in decay with thickness of the abdominal layer. The changes in clutter in the in vivo experiments do not exactly match that observed in the FWNA simulations, but this is probably the result of differences in tissue compression between the in vivo experiments and simulations.
At 80% compression, the step thickness is very small and the clutter decays rapidly. The magnitude of the step has not increased relative to the 40% compressed wall, but it is not clear whether this is a result of the connective tissue organization approaching 90°, which was illustrated in Figure 10 to moderately diminish the magnitude of the diffuse clutter, or is due to limitations in our ability to accurately model compression of real tissue. The increase in brightness of the image clutter band and rapidly decreasing clutter decay in the bladder cavity, however, are observed in the clinical images (Fig. 7).
The most interesting result of the simulation analysis is observed in Figure 9. Here, it is observed that the dominant mechanism contributing to the coherent and diffuse clutter is the scattering from the tissue interfaces, rather than scattering from the diffuse, sub-resolution particles. This is an important observation, because multiple or multi-path scattering would be required to generate diffuse clutter, although this may not be surprising because of the relatively weak scattering of diffuse, sub-resolution particles in tissue. If reverberation between the distal fascial layer and the transducer occurs once (i.e., reflection from layer, transducer, then layer again) and the other connective tissue interfaces cause weak scattering, then a replica of the connective tissue network would be expected. This is not the case in the in vivo or simulated images.
Our simulations indicate that attenuation does not affect clutter significantly, whereas the angle and density of the connective tissue have a moderate impact on the magnitude of the diffuse clutter, with magnitude increasing as much as 10–15 dB from low angles and densities to large angles and densities (Fig. 10). Querleux et al. (2002) describe the distribution of the angle of connective tissue layers in men and women in three bins: 0–15°, 15–75° and 75–90°. The majority of connective tissue is angled in the range of 75°–90° relative to the skin, with the proportion of connective tissue at these angles being 45% for women and 75% for men. In comparison, the proportions of connective tissue angled in the range 0–15° relative to the skin surface were 20% in women and 5% in men. Given that a large percentage of connective tissue in human subcutaneous tissue is angled >75° to beam normal, the occurrence of large clutter magnitude is probably significant, particularly in those with thicker subcutaneous layers. The density at low angles has very little, if any, impact on the magnitude of diffuse clutter largely, because the connective tissue at these angles acts as perfectly reflecting surfaces that direct the acoustic wave further into the medium. Although these reflections at low angles may not affect clutter resulting from reverberation directed back to the transducer, they will result in a distortion of the imaging beam and will degrade images from reverberation directed into the imaging medium, which is known as trailing clutter (Pinton et al. 2011).
The thicker fascial layer that typically defines the distal border of the abdominal wall amplifies diffuse clutter by the same mechanism described previously for layers normal to the beam direction. The diffuse clutter is approximately 20 dB lower without this fascial layer than with it. The absence of the fascial layer is not observed in human anatomy, but the experiment serves to quantify the impact of this layer on image clutter. The roll-off in clutter magnitude at the larger angles in Figure 10(a) may seem to conflict with this observation, but consider that in the idealized connective tissue network at 90°, there are no diffuse scatterers and all of the connective tissue septa are at 90° and are equally spaced apart. This structure generates discrete coherent clutter and regularly spaced intervals and drives the diffuse clutter between these intervals very low. There is neither scattering from diffuse targets on the round-trip path nor multi-path scattering within the connective tissue in this configuration.
As illustrated in Figures 11, 12 and 13, the impact of the distal fascial layer can be mitigated by rotating the transducer about the x- or y-axis or by changing the angle of the transmit beam. Rotating the transducer or electronically steering the beam decreases the angle between the beam and the fascial layers and connective tissue, and mitigates the image clutter in two ways. First, coherent reverberation is reduced, because the incident acoustic waves are no longer perpendicular to the thicker fascial layers and are therefore reflected away from the incident path. This transforms the clutter signal from coherent to diffuse reverberation. This is observed in Figure 12, where the coherent clutter, more evident near a depth of 4 cm, is diminished as the rotation angle increases. Clutter is still present as the angle increases; however, diffuse reverberation is the only apparent clutter at 15°. It is also observed in Figure 13, where the outer sub-apertures yield images with more diffuse clutter than the inner sub-apertures. An interesting effect, however, is observed in the image created by the right sub-aperture of Figure 13. In this image, a specular reflector is observed in the abdominal layer at a 1.5-cm depth. Because of the natural orientation and configuration of the fascial septa, this connective tissue branch becomes more perpendicular to the propagation direction and is therefore brighter in the right image. This could lead to coherent reverberation artifacts, although given the lower percentages of connective tissue in the 0°–15° and 15°–75° bins (Querleux et al. 2002), these potential coherent artifacts are expected to be minimal.
Second, the magnitude of the clutter decreases as the transducer is rotated or beam angle is increased, although this is more apparent in Figure 12 than in Figure 13. The reduction in clutter magnitude can be inferred from Figure 10(a) because the angle of the beam with respect to the connective tissue and the distal fascial layers decreases. The axial thickness of the clutter band increases because the thickness of the abdominal wall along the propagation axis increases during rotation or steering; however, the decrease in clutter magnitude caused by the angling of the layer or beam mitigates the detrimental effects caused by the increase in thickness.
The significance of this result is that beamforming methods that rely on the coherence of the ultrasonic wavefronts, such as SLSC imaging, will yield improved suppression of clutter. The coherence imaging methods are superior to conventional delay-and-sum beamforming in reducing diffuse clutter because they specifically target the similarity (or dissimilarity) of an echo’s wavefront. However, coherence imaging methods cannot eliminate coherent clutter. By slight rotation of the transducer, SLSC or other coherence imaging techniques may yield improved results.
These simulations and experimental methods did not analyze the impact of transducer geometry on clutter. The flat geometry of the array used in the simulations may contribute more to reverberation clutter than the convex shape of the 4 C1 transducer used in the in vivo experiments because of the more acute angles of reflection introduced by the flat geometry. There are also some limitations to the FWNA simulation method. First, the acoustical properties used in the simulations are an estimate of the actual acoustical properties, which may vary on a person-to-person basis and alter the potential magnitude of clutter. Second, many of the exercises performed with the FWNA simulation cannot be replicated in vivo. Although these exercises provide useful examination of the aspects of clutter, some of these simulations have no means of verification by a physical or in vivo experiment, such as the separation of scatterers from tissue layers experiment. Lastly, although the simulation method is performed on a discrete 2-D grid, ultrasonic wave propagation is 3-D in nature. Therefore, these simulations lack the potential interaction of out-of-plane structures that contribute to reverberation artifact. The FWNA simulation method can be performed in three dimensions, but currently there are a lack of 3-D models of human abdominal wall anatomy with the resolution required by the simulations.
CONCLUSIONS
The major source of reverberation in abdominal imaging has been reported here to be a product of the connective tissue and fat structure of the subcutaneous layer in the abdominal wall. The potential of poor-quality ultrasound images is thus increased for obese and overweight patients because of the large layers of fat that accompany these individuals. A thick layer of fat produces aberrations in the wavefront and can refract the beam, which causes the beam’s focal location to shift from the desired position. In addition, an obese individual requires more connective tissue to support the additional adipose tissue, thereby increasing the potential of ultrasonic clutter. However, not all obese patients make bad images, and not all thin individuals make good images. This would seem to indicate that there are further determinants of abdominal image degradation than simply the thickness of the abdominal fat. We have found that the structure of the connective tissue is a significant factor in the generation of image clutter, and that a favorable configuration of the connective tissue may mitigate the impact of a larger abdominal wall.
Our results suggest that there are two major mechanisms to reverberation clutter. First, the presence of a large reflecting boundary, such as a thick fascial layer or a fibrous band from an organ, will cause reverberation with the transducer surface and amplify any diffuse clutter. Second, multi-path scattering from the fat/connective tissue interfaces creates diffuse clutter, with the diffuse sub-resolution scatterers of tissue playing a minimal role in acoustic reverberation. The organization of the connective tissue, however, affects the amount of diffuse clutter. Coherent clutter, largely a result of the first mechanism, can be transformed into diffuse clutter by altering the orientation of the transducer with respect to the large reflecting boundary or by beam steering. Converting coherent clutter to diffuse clutter can vastly improve the performance of coherence-based beamforming techniques.
Acknowledgment
This work is supported by NIH Grants R01-EB013661 and R01-EB015561. The authors thank the Ultrasound Division at Siemens Medical Solutions USA for their in-kind and technical support.
References
- Averkiou MA, Roundhill DN, Powers JE. Proceedings, IEEE Ultrasonics Symposium, 1997. Vol. 2. IEEE; New York: 1997. A new imaging technique based on the nonlinear properties of tissues; pp. 1561–1566. [Google Scholar]
- Brunke SS, Insana MF, Dahl JJ, Hansen C, Ashfaq M, Ermert H. An ultrasound research interface for a clinical system. IEEE Trans Ultrason Ferroelectr Freq Control. 2007;54:198–210. doi: 10.1109/tuffc.2007.226. [DOI] [PubMed] [Google Scholar]
- Buttery B, Davison G. The ghost artifact. J Ultrasound Med. 1984;3:49–52. doi: 10.7863/jum.1984.3.2.49. [DOI] [PubMed] [Google Scholar]
- Christopher T. Finite amplitude distortion-based inhomogeneous pulse echo ultrasonic imaging. IEEE Trans Ultrason Ferroelect Freq Control. 1997;44:125–139. doi: 10.1109/58.585208. [DOI] [PubMed] [Google Scholar]
- Dahl JJ, Jakovljevic M, Pinton GF, Trahey GE. Harmonic spatial coherence imaging: An ultrasonic imaging method based on backscatter coherence. IEEE Trans Ultrason Ferroelectr Freq Control. 2012;59:648–659. doi: 10.1109/TUFFC.2012.2243. [DOI] [PMC free article] [PubMed] [Google Scholar]
- Fink M. Time reversal of ultrasonic fields: Part I. Basic principles. IEEE Trans Ultrason Ferroelectr Freq Control. 1992;39:555–566. doi: 10.1109/58.156174. [DOI] [PubMed] [Google Scholar]
- Goss SA, Johnston RL, Dunn F. Compilation of empirical ultrasonic properties of mammalian tissues. J Acoust Soc Am. 1978;64:423–457. doi: 10.1121/1.382016. [DOI] [PubMed] [Google Scholar]
- Goss SA, Johnston RL, Dunn F. Compilation of empirical ultrasonic properties of mammalian tissues. II. J Acoust Soc Am. 1980;68:93–108. doi: 10.1121/1.384509. [DOI] [PubMed] [Google Scholar]
- Hamilton MF, Blackstock DT. Nonlinear acoustics. Acoustical Society of America; Melville, NY: 2008. [Google Scholar]
- Hinkelman LM, Metlay LA, Churukian CJ, Waag RC. Modified Gomori trichrome stain technique for macroscopic tissue slices. J Histotech. 1996;19:321–323. [Google Scholar]
- Lediju M, Pihl MJ, Dahl JJ, Trahey GE. Quantitative assessment of the magnitude, impact, and spatial extent of ultrasonic clutter. Ultrason Imaging. 2008;30:151–168. doi: 10.1177/016173460803000302. [DOI] [PMC free article] [PubMed] [Google Scholar]
- Lediju M, Pihl MJ, Hsu SJ, Dahl JJ, Gallippi CM, Trahey GE. A motionbased approach to abdominal clutter rejection. IEEE Trans Ultrason Ferroelect Freq Control. 2009;56:2437–2449. doi: 10.1109/TUFFc.2009.1331. [DOI] [PMC free article] [PubMed] [Google Scholar]
- Lediju M, Trahey GE, Byram BC, Dahl JJ. Short-lag spatial coherence of backscattered echoes: Imaging characteristics. IEEE Trans Ultrason Ferroelect Freq Control. 2011;58:1377–1388. doi: 10.1109/TUFFC.2011.1957. [DOI] [PMC free article] [PubMed] [Google Scholar]
- Lin F, Waag RC. Estimation and compensation of ultrasonic wavefront distortion using a blind system identification method. IEEE Trans Ultrason Ferroelect Freq Control. 2002;49:739–755. doi: 10.1109/tuffc.2002.1009332. [DOI] [PubMed] [Google Scholar]
- Liu DL, Waag RC. Correction of ultrasonic wavefront distortion using backpropagation and a reference waveform method for time-shift compensation. J Acoust Soc Am. 1994;96:649–660. doi: 10.1121/1.410304. [DOI] [PubMed] [Google Scholar]
- Markman B, Barton FE., Jr Anatomy of the subcutaneous tissue of the trunk and lower extremity. Plast Reconstr Surg. 1987;80:248–254. doi: 10.1097/00006534-198708000-00015. [DOI] [PubMed] [Google Scholar]
- Mast TD, Hinkelman LM, Orr MJ, Sparrow VW, Waag RC. Simulation of ultrasonic pulse propagation through the abdominal wall. J Acoust Soc Am. 1997;102:1177–1190. doi: 10.1121/1.421015. [DOI] [PubMed] [Google Scholar]; J Acoust Soc Am. 1998;104:1124–1128. Erratum: [Google Scholar]
- Mauldin FW, Jr, Lin D, Hossack JA. The singular value filter: A general filter design strategy for PCA-based signal separation in medical ultrasound imaging. IEEE Trans Med Imaging. 2011;30:1951–1964. doi: 10.1109/TMI.2011.2160075. [DOI] [PMC free article] [PubMed] [Google Scholar]
- Middleton WD, Melson GL. The carotid ghost: A color Doppler ultrasound duplication artifact. J Ultrasound Med. 1990;9:487–493. doi: 10.7863/jum.1990.9.9.487. [DOI] [PubMed] [Google Scholar]
- Mirrashed F, Sharp JC, Krause V, Morgan J, Tomanek B. Pilot study of dermal and subcutaneous fat structures by MRI in individuals who differ in gender, BMI, and cellulite grading. Skin Res Technol. 2004;10:161–168. doi: 10.1111/j.1600-0846.2004.00072.x. [DOI] [PubMed] [Google Scholar]
- Nåsholm SP, Hansen R, Måsøy SE, Johansen TF, Angelsen BAJ. Transmit beams adapted to reverberation noise suppression using dual-frequency SURF imaging. IEEE Trans Ultrason Ferroelectr Freq Control. 2009;56:2124–2133. doi: 10.1109/TUFFC.2009.1295. [DOI] [PubMed] [Google Scholar]
- Ng GC, Worrell SS, Freiburger PD, Trahey GE. A comparative evaluation of several algorithms for phase aberration correction. IEEE Trans Ultrason Ferroelect Freq Control. 1994;41:631–643. [Google Scholar]
- Pinton GF, Dahl JJ, Rosenzweig S, Trahey GE. A heterogeneous nonlinear attenuating full-wave model of ultrasound. IEEE Trans Ultrason Ferroelectr Freq Control. 2009;56:474–488. doi: 10.1109/TUFFC.2009.1066. [DOI] [PMC free article] [PubMed] [Google Scholar]
- Pinton GF, Trahey GE, Dahl JJ. Sources of image degradation in fundamental and harmonic ultrasound imaging: A nonlinear fullwave simulation study. IEEE Trans Ultrason Ferroelect Freq Control. 2011;58:1272–1283. doi: 10.1109/TUFFC.2011.1938. [DOI] [PMC free article] [PubMed] [Google Scholar]
- Querleux B, Cornillown C, Jolivet O, Bittoun J. Anatomy and physiology of subcutaneous adipose tissue by in vivo magnetic resonance imaging and spectroscopy: Relationships with sex and presence of cellulite. Skin Res Technol. 2002;8:118–124. doi: 10.1034/j.1600-0846.2002.00331.x. [DOI] [PubMed] [Google Scholar]
- Rau JM, Måsøy SE, Hansen R, Angelsen BA, Tangen TA. Methods for reverberation suppression utilizing dual frequency band imaging. J Acoust Soc Am. 2013;134:2313–2325. doi: 10.1121/1.4817900. [DOI] [PubMed] [Google Scholar]
- Robinson BS, Shmulewitz A, Burke TM. Proceedings, IEEE Ultrasonics Symposium, 1994. Vol. 3. IEEE; New York: 1994. Waveform aberrations in an animal model; pp. 1619–1624. [Google Scholar]
- Rosenbaum M, Prieto V, Hellmer J, Boschmann M, Krueger J, Leibel RL, Ship AG. An exploratory investigation of the morphology and biochemistry of cellulite. Plast Reconstr Surg. 1998;101:1934–1939. doi: 10.1097/00006534-199806000-00025. [DOI] [PubMed] [Google Scholar]
- Salahura G, Tillet JC, Metlay LA, Waag RC. Large-scale propagation of ultrasound in a 3-D breast model based on high-resolution MRI data. IEEE Trans Ultrason Ferroelect Freq Control. 2010;57:1273–1284. doi: 10.1109/TBME.2009.2040022. [DOI] [PMC free article] [PubMed] [Google Scholar]
- Tabei M, Mast TD, Waag RC. Simulation of ultrasonic focus aberration and correction through human tissue. J Acoust Soc Am. 2003;113:1166–1176. doi: 10.1121/1.1531986. [DOI] [PubMed] [Google Scholar]
- Varslot T, Angelsen BA, Waag RC. Spectral estimation for characterization of acoustic aberration. J Acoust Soc Am. 2004;116:97–108. doi: 10.1121/1.1760799. [DOI] [PubMed] [Google Scholar]


