

Abstract
Purpose
Our goal was to use Positron Emission Tomography (PET) to analyze the movement of radiolabeled agents in tissue to enable direct measurement of drug delivery to the brain.
Procedures
A variety of 11C- and 18F-labeled compounds were delivered directly to an agarose phantom or rat striatum. Concentration profiles were extracted for analysis and fitted to diffusion models.
Results
Diffusion coefficients ranged from 0.075±0.0026 mm2/min ([18F]Fluoride, 18 Da) to 0.0016±0.0018 mm2/min ([18F]NPB4-avidin, 68 kDa) and matched well with predictions based on molecular weight (R2=0.965). The tortuosity of the brain extracellular space was estimated to be 1.56, with the tissue clearance halftime of each tracer in the brain varying from 19 to 41 minutes.
Conclusions
PET is an effective modality to directly quantify the movement of locally delivered drugs or drug-carriers. This continuous, non-invasive assessment of delivery will aid the design of better drug delivery methods.
Keywords: PET, diffusion, drug delivery to the brain, mathematical modeling, radiolabeling, polymer
INTRODUCTION
The failure of pharmaceutical agents to treat disease in the central nervous system (CNS) is often due to the problem of achieving therapeutic concentrations of the drug in the target tissue site. Few systemically delivered drugs will cross the blood-brain barrier (BBB), and drugs that have been directly delivered to the brain are subject to a variety of transport forces that serve to restrict tissue treatment volume, including binding to extracellular molecules and cell surface receptors, enzymatic degradation, peripheral clearance, and reduced rates of diffusion [1–2]. Various delivery strategies have been developed to enhance the distribution of drugs, such as the use of multiple infusion catheters, or the infusion of large volumes of fluid at a high flow rate, or the use of carriers, such as polymeric nanoparticles, to help overcome barriers to transport [3–7].
Local drug delivery strategies are an avenue of research with tremendous potential to improve human health. Some technologies have reached clinical application, yet challenges remain [2, 8]. In part, the optimization of the delivery of novel therapeutics to the brain of humans is limited by the lack of suitable technology to characterize their distribution after delivery. In one well-known example, the direct infusion of glial cell line-derived neurotrophic factor (GDNF) with Convenction Enhanced Delivery (CED) was highly successful in treating Parkinson’s disease in nonhuman primates, but the same compound was unsuccessful in large-scale clinical trials. The poor clinical outcomes were eventually attributed to the failure of the active agent to fully reach the larger target tissue site in the human brain [9–11]. This limited distribution was only identified in post-mortem tissue samples, where it was estimated that GDNF reached only 2–9% of the target tissue volume. If the poor delivery of GDNF had been recognized sooner, costly trials could have been avoided.
Probing the behavior of active agents in intact brain thus remains a critical problem in biology and medicine. Fluorescence and autoradiography require the extraction of tissue to obtain data. Large numbers of animals are needed, and it is not possible to monitor the kinetics of drug distribution within a single animal. Magnetic Resonance Imaging (MRI) and Computed Tomography (CT) permit noninvasive imaging of labeled agents in intact tissue [12–15]. However, image contrast is typically achieved via chelation of heavy metal or other specialized labeling strategies that may impact key properties of the molecule of interest, such as its molecular weight, charge, or binding affinity. These existing imaging methods also suffer from quantification issues, since only relative concentration values can be determined within a single experiment, as opposed to absolute concentrations across multiple experiments.
Here, we address the need for non-invasive, direct-delivery imaging technology by developing a positron emission tomography (PET) method to measure the movement of a variety of 11C- and 18F-labeled molecules in intact tissue. One long-term goal of our research is to develop methods capable of measuring the delivery and distribution of nanoparticles; to this end, we used a newly developed 18F-labeled biotinylated compound, designed to bond to avidin exposed on avidin-palmitate modified polymer nanoparticles.
PET concentration profiles were analyzed with numerical models of drug transport for quantitative assessment of compound distribution after direct delivery to brain phantom or intact brain. We hypothesized that PET imaging would enable quantification of radiolabeled compound distributions across a range of compound types using clinically relevant delivery paradigms. This new direct-delivery PET method, i.e., dPET, produced accurate and reproducible measurement of the transport of radiolabeled agents in the brain. We observed that dPET was useful to measure the concentration of agents delivered directly to intact, living tissue, and also to obtain quantitative information about agent diffusion and elimination, as well as the tortuosity of the brain extracellular matrix. Importantly, the methods described here can be applied to measure the distribution of any PET-traceable compound.
MATERIALS AND METHODS
Agarose Phantom
Agarose powder (American Bioanalytical, Natick, MA) was dissolved in boiling distilled water to obtain a concentration of 0.2% w/v. The mixture was poured into 20mL glass scintillation vials, and the vials were allowed to cool at room temperature for at least 2 hours prior to each imaging experiment. All diffusion measurements were made at room temperature (20°C).
Stereotactic Surgery
All animal procedures were carried out under a protocol approved by the Institutional Animal Care and Use Committee. Male Sprague-Dawley rats (250–350 g) were anesthetized for surgery with an intraperitoneal injection of ketamine/xylazine (10/90 mg/kg) and placed in a stereotaxic frame designed for rodent surgery (David Kopf Instruments, Tujunga, CA). A burr hole was drilled to target the right striatum (AP = −3.8 mm, ML = +2.1 mm), and a 26G guide cannula (2mm projection, Plastics One, Roanoke, VA) was lowered onto the top of the skull (to target DV = −4.0 mm). The guide cannula was secured with fast curing resin (Perm Reline, Henry Schein). Three stainless steel cranial screws were placed near (~1 cm) the guide cannula, so that the resin formed a cap that was completely stationary relative to the skull. Imaging sessions began approximately 1–2 hours after the induction of ketamine/xylazine anesthesia. Rats were maintained on isoflurane anesthesia (2%) for the duration of each 2–4 hour experiment.
Radiotracers
A variety of 11C- and 18F-labeled radiopharmaceuticals were used in these experiments, including fluoride ion ([18F]Fluoride, 18 Da), fluorodeoxyglucose ([18F]FDG, 181 Da), 3-fluoro-5-(2-pyridinylethynyl)benzonitrile ([18F]FPEB, 222 Da), (+)-propyl-hexahydro-naptho-oxazin ([11C]PHNO, 247 Da), 3-amino-4-[2-[(di(methyl)amino)methyl]phenyl]sulfanylbenzonitrile ([11C]DASB, 283 Da), 2-[2-(dimethylaminomethyl)phenylthio]-5-fluoromethylphenylamin ([11C]AFM, 290 Da), (2-(6-chloro-2-(4-(3-fluoropropoxy)phenyl)imidazo[1,2-a]pyridin-3-yl)-N,N-diethylacetamide) ([18F]PBR111, 416 Da), (R-1-[4-(2-methoxy-isopropyl)-phenyl]-3-[2-(4-methyl-piperazin-1-yl)benzyl]-pyrrolidin-2-1) ([11C]P943, 422 Da), and fluorobenzylamine-poly(ethylene glycol)4-biotin ([18F]NPB4, 590 Da). The synthesis and characterization of [18F]NPB4. a biotinylated tracer designed to bond to avidin, is described elsewhere [16]. The solution medium for all tracers contained up to 0.9% saline with 9.1% ethanol, with pH ranging from 4.5 to 8.5. Specific activities were 0.5–5 mCi/nmol for [18F]NPB4, and at least 1 mCi/nmol for all other compounds.
Imaging
For all experiments, injections were performed with an automated syringe pump (Harvard Apparatus, Holliston, MA). 1–10mg/ml Rhodamine dye was added to the infusate to aid in visualization of fluid movement through the tubing. Data were acquired with a FOCUS 220 small animal PET scanner (Siemens Medical Solutions, Knoxville, TN). A transmission scan (57Co source, 9 minutes) was acquired to correct for attenuation.
For brain phantom experiments, a 24G or 26G needle was attached to a stereotaxic frame and lowered into the agarose vial, and the infusion was performed prior to transmission and emission scans. After completion of the infusion, the needle was left in place for 20 minutes. For in vivo experiments, a 26G internal injector was threaded through the 24G guide cannula, a transmission scan was acquired, and the infusion and emission scan were started simultaneously. Unless otherwise specified, the infusion rate was held constant at 0.5 μl/min. A range of infusion volumes (5–20 μl) and total activities (0.04–8.5 MBq) were used. The total infusion time was between 2.5 and 40 minutes Unless otherwise specified, the injector was removed 20 minutes after the end of the infusion for all experiments, and this first “injector-free” frame was used to calculate the initial concentration profile for data fitting purposes.
List mode data were collected for 2–4 hours and binned into 0.5 to 20-minute frames, which were reconstructed with the ordered subset expectation maximization (OSEM, 4 iterations, 16 subsets) and filtered backprojection (FBP, ramp filter) algorithms with corrections for decay, attenuation, randoms, and scatter. Pixel size was 0.949 × 0.949 × 0.796 mm and image resolution was ~1.5 mm. For attenuation correction, the raw transmission images were scaled to account for the difference in attenuation between 57Co and PET isotopes.
In certain cases where the injected activity was low, the isotope was 11C, and/or acquisitions were long, the late data were noisy. These noisy data were excluded when background variation was high, i.e., when the fitting algorithm (see below) failed to locate the center of the concentration profile. For in vivo experiments, the shape of the injector tip and skull were identified in the first emission frame and transmission image to verify that the internal injector reached the target brain depth of −6 mm DV.
Mathematical Models
Assessment of diffusion was initiated after the infusion was complete. The location of the center of the infusion was estimated by least squares curve fitting of the 3D data (‘lsqcurvefit’, Matlab v2008) to a symmetric, 3D Gaussian profile,
| Eq. 1 |
where C is the concentration of tracer measured by PET. The magnitude of the Gaussian kernel is defined as Cmax, and its standard deviation is σ, which is assumed to have an equal value in each of the three directions of measurement. The location of the center of the kernel (xo, yo, and zo) was allowed to vary to obtain a center location for individual time frames to account for inter-frame noise and count variation in the image reconstruction. The fitted center location was never observed to vary more than 0.6mm (less than one pixel) between reconstructed time frames. Each pixel was assigned a radial position by calculating its distance from the fitted center location, thus converting the three-dimensional image data into a one-dimensional concentration profile, C. Data sets were scaled to the maximum value in the first frame of each time series, C0. Diffusion processes were modeled by Fick’s law:
| Eq. 2 |
where C is a function of r, the radial distance from the center of the infusion, t is time, and D is the diffusion coefficient. The initial condition was taken from C0. The boundary conditions assumed symmetric diffusion at r=0 and a barrier to diffusion at r=R, the edge of the glass vial, 14 mm, or skull, 7 mm, Thus, the boundary and initial conditions were:
| Eq. 3 |
PET data were cropped to exclude the medium’s boundary and to contain the majority of the data without biasing the data fits to the low signal points at the edge of the vial (from the center of the infusion, 10 pixels for agarose and 5 pixels for rat). The predicted concentration profile at a given time was calculated from equations 2 and 3 (‘pdepe’, Matlab v2008) and fitted to PET data by unweighted least squares (‘lsqcurvefit’). Two parameters were estimated: the effective diffusion coefficient and a frame-dependent profile scale factor. The Stokes-Einstein relationship was used to estimate the diffusion coefficient as a function of molecular weight:
| Eq. 4 |
where k is Boltzmann’s constant (J/K), T is the temperature (K), η is the viscosity (Pa-s), and a is the hydrodynamic radius of the diffusing molecule (m). Because the radius of a spherical particle scales approximately with the molecular weight and all other parameters in the equation are constants, Equation 4 may be rewritten as follows [17]:
| Eq. 5 |
where Mw is in Daltons, and A is in cm2/s-Da1/3.
The diffusional path length is increased in the rat brain compared to agarose, and so measurements of diffusion in vivo reflect an effective diffusion coefficient, described by the following relationship:
| Eq. 6 |
where D* and D are measured in brain and solution, respectively, and λ is the tortuosity (for discussion of the effect of tortuosity on the diffusion of small molecules in the brain, see [18]).
RESULTS
Agarose
We first examined direct delivery of radiolabeled compounds in an agarose brain mimic to determine the methods for obtaining high quality data for analysis. The positive pressure gradient used to infuse fluid will dissipate rapidly once the injector is removed, after which agents will distribute in agarose according to diffusion processes. Therefore, we expect that different infusion protocols will affect the initial distribution of tracer but should not affect measurement of the diffusion coefficient once the injector has been removed. Infusing large volumes (e.g., >10 μL) at a high rate (typically >1 μL/min, depending on the infusion volume) produced backflow (Figure 1), i.e., a strong pressure gradient that forces fluid back along the infusion track. Backflow was identified visually by obvious asymmetry in the two-dimensional cross sections (in a direction parallel to the infusion tract) of the images. Infusing a volume of 5–20 μL at a rate of 0.5 μL/min produced spherical, symmetric radial distribution with no identifiable backflow, providing direct evidence that convective pressure was dissipated upon removal of the injector; This was the protocol used to obtain all of the data presented here. Data quality was also improved by the inclusion of a waiting period, where the infusion apparatus was left in place before moving the gel to the scanner. In these experiments, 2 minutes of waiting per microliter of infused fluid was sufficient to prevent backflow. Concentration profiles were spherical and symmetric, with noise increasing in each frame as the tracer decayed (Figure 1d).
FIGURE 1.

Sample images (in the plane parallel to the injection tract) show radiotracer distributions approximately 40 minutes after the start of the radiotracer infusion, scaled to the maximum intensity at the center of the infusion. (a–b) Images show a cross section of radiotracer distribution in agarose gel (10 μL of [18F]FDG infused over 20 minutes). In (a), the injector was left in place for only 5 minutes after the end of the infusion, a protocol that produced backflow and an asymmetric diffusion profile. In (b), the injector was left in place for 20 minutes, which prevented the occurrence of backflow. (c) Image shows a coronal section of radiotracer distribution in the rat striatum (10 μL of [18F]Fluoride infused over 2 minutes). The in vivo distribution of tracer was not perfectly symmetric, presumably due to anatomical features of the rat brain, such as white matter tracts, that altered fluid flow. (d) Panel shows cross-sectional images of [18F]FDG diffusing in agarose over 2 hours. Times are given as the mid-time of each frame, with respect to start of the infusion. The corresponding radial concentration profile for this data is given in Figure 2a. Scale bar is 5mm. Abbreviations: fluorodeoxyglucose (FDG).
We measured the distribution of charged and uncharged radiolabeled compounds with molecular weights ranging from 18–68,000 Da. Faster rates of diffusion were identifiable by a more rapid broadening of the Gaussian-shaped concentration profile. As expected, low molecular weight tracers such as [18F]Fluoride diffused more quickly than higher molecular weight tracers such as [11C]PHNO and [18F]FPEB (Figure 2a). The predicted and measured concentrations, as well as the initial concentration profile, were plotted as a function of radial distance from the infusion center (Figure 2b). This enabled visualization of the residuals (difference between data and fit), which were distributed randomly about 0 (Figure 2c).
FIGURE 2.
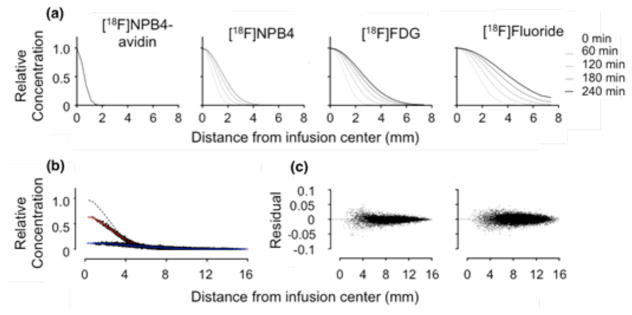
Concentration profiles show the time-dependent distribution of various radiolabeled compounds infused into agarose gel. (a) Compounds diffused according to their molecular weight, with heavier compounds diffusing more slowly. Pictured from left to right: [18F]NPB4-avidin, [18F]NPB4, [18F]FDG, and [18F]Fluoride (molecular weights of 68,000, 592, 181, and 18 Daltons, respectively) over time (20 minute frame, start times of 0, 60, 120, 180, and 240 minutes). Profiles were each normalized to a maximum of 1.0 for display purposes. (b) Concentration profiles were fit to a model of Fickian diffusion (Eq. 2), to obtain estimates of the diffusion coefficient from each frame. Dashed line shows the initial concentration profile, at time zero, and solid lines show the best fit to the data after 20 and 180 minutes, respectively (fitted data were scaled to a common maximum for ease of visualization). (c) The corresponding residual plots for these data fits are shown for the 20 -and 180-minute fits (left and right, respectively). Abbreviations: fluorobenzylamine-poly(ethylene glycol)4-biotin (NPB4), fluorodeoxyglucose (FDG).
Individual diffusion coefficients (Equation 2) estimated from each 5- or 20-minute frame of a single scan were averaged to produce an estimate of the measured diffusion coefficient for that given experiment; these data are presented in Figure 3a, where each point represents a single experiment and the error bars signify the standard deviation calculated from different frames. The diffusion coefficient ranged from 0.075±0.0026 mm2/min for [18F]Fluoride to 0.0016±0.0018 mm2/min for [18F]NPB4-avidin. In experiments where the total activity was low, the diffusion coefficient estimates were less precise; however, the error in diffusion coefficient estimates was not a function of molecular weight (Figure 3b). The full set of data (with molecular weights ranging from 18–68,000 Da) was fit to Equation 5, yielding a value for A of 3.5×10⁻⁵ cm2/s, which compares favorably with literature values of 2.3–4.37×10⁻⁵ cm2/s across a similar range of molecular weights (Table 1).
FIGURE 3.
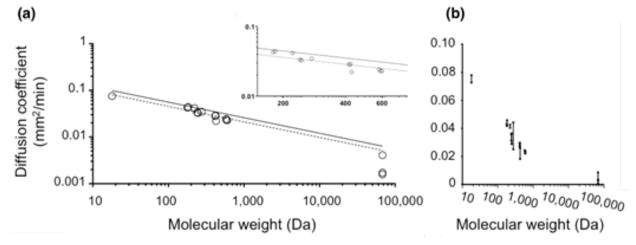
Diffusion coefficients of various radiolabeled compounds were measured in agarose gel. Each graph shows the same data plotted on different scales. (a) The diffusion coefficient estimated by dPET matched well with predictions based on molecular weight for a wide range of molecular weights. Each point represents a single experiment. Dashed lines indicate the best fit of Equation 5 to this data and solid lines indicate best fit of Equation 5 to published data [24]. Inset plot shows magnification of the data in the midrange. (b) The same data are plotted on a linear scale with error bars signifying the standard deviation of different time frames within a single experiment. Abbreviations: Direct Delivery Positron Emission Tomography (dPET)
TABLE 1.
Literature values for the fit of Equation 5 to the measured diffusion coefficient and molecular weight
| Citation | Molecular Weight (kDa) | A (cm2/sec × 105) | r2 |
|---|---|---|---|
| Thorne, et al. (2004) [25] | 1.2–150 | 2.28 | 0.866 |
| Saltzman, et al. (1994) [24] | 0.3–970 | 2.6 | |
| Sober (1970) [26] | 1.6–1000 | 3.0 | |
| Current Study | 0.018–68 | 3.5 | 0.956 |
| Polson (1950) [27] | 0.02–294 | 2.8–5.43 |
Rat Striatum
Methods were developed to apply PET imaging of direct delivery in vivo. Dental cement was used to build a cranial “cap” that adhered three cranial screws and the guide cannula to the surface of the skull. This procedure resulted in stable insertion of the internal injector after the animal was placed in the scanner, which dramatically improved the quality of the data and permitted infusion rates of 5 μL/min with no detectable evidence of backflow.
[18F]Fluoride, [18F]FDG, and [18F]NPB4 were infused into the rat striatum at flow rates of 0.5–5 μL/min for a total infusion volume of 5–20 μL. The striatum was chosen as the infusion site specifically because it is one of the more anatomically homogenous regions of the brain. Although tracer distributions were not perfectly symmetric, they were generally spherical, without obvious evidence of anatomical features that might have altered flow (Figure 4). [18F]FDG and [18F]NPB4 showed limited movement (Figures 5a,b). During the infusion period, compounds will distribute according to the competing effects of convection, diffusion, binding/immobilization, and elimination. Once the infusion is complete and the pressure gradient has dissipated, compounds will distribute according to diffusion, binding/immobilization, and elimination. Diffusion after the infusion period would be evident by a broadening of the concentration profile with time. We attempted to fit our diffusion model to the data, however, the value of the fitted diffusion coefficient (which in this case would reflect the combined effects of binding and diffusion) was too low to measure reliably, i.e., on the order of 10−4 to 10−2 mm2/min in vivo, compared to 0.043±0.0012 mm2/min for [18F]FDG, n=2, and 0.023±0.00049 mm2/min for [18F]NPB4, n=3, in agarose. We also tested the serotonin transporter tracer [11C]DASB and the dopamine receptor tracer [11C]PHNO and observed a similarly restricted distribution in the striatum (data not shown). By comparison, [18F]Fluoride distributed readily in vivo (Figure 5c). [18F]Fluoride traveled further than any other compound during the convective phase, and enhanced distribution was observed at higher convective flow rates (Figure 6a). All compounds were observed to be cleared from brain tissue, as measured by a decrease in the total decay-corrected activity in the brain over time (Figure 6b). The tissue clearance halftime of each tracer in the brain was calculated by fitting the tracer concentration to a model of exponential clearance, which yielded t1/2 = 41, 27, and 19 minutes for [18F]Fluoride, [18F]FDG, and [18F]NPB4, respectively (n=2 each, corresponding to elimination constants of 0.017 min−1, 0.026 min−1, and 0.037 min−1, respectively). Tracer was not eliminated when delivered to a recently deceased rat (data not shown), suggesting that elimination of these agents occurs via vascular routes. Lastly, we measured the effective diffusion coefficient of [18F]Fluoride in the brain (D*=0.033±0.00036 mm2/min), which was smaller than the diffusion coefficient of [18F]Fluoride in agarose (D=0.075±0.0027 mm2/min). After correcting D to body temperature with Equation 4, Equation 6 yields a value for the tortuosity, λ, of 1.56, which matches well with the typically reported value of 1.6 [19]. We attempted more complex data fitting algorithms, including a reaction-diffusion model, as well as a compartmental model with reversible or irreversible binding and elimination. Although these more complex models were capable of fitting the data well, the fitted parameters were highly correlated. The development of more sophisticated models for extraction of additional parameters (e.g., binding constants for immobilization of drug in tissue) remains the subject of future work.
FIGURE 4.

Sample images (in the plane parallel to the injection tract) show radiotracer distributions in the rat striatum. (a–c), [18F]FDG, (d–f), [18F]NPB4, and, (g–i), [18F]Fluoride were infused at 0.5 uL/min (20uL total volume). In vivo profiles were not perfectly symmetric, but they were generally spherical in shape. The first image (a,d,g) shows tracer distribution after the infusion was complete, i.e., the point at which the convective gradient has dissipated. Subsequent frames show tracer concentrations 20 and 40 minutes later (b, e, and h, and c, f, and i, respectively). [18F]FDG and [18F]NPB4 achieved only a very small infusion volume and did not appear to move in the striatum. [18F]Fluoride reached a larger tissue volume for the same infusion parameters as [18F]FDG and [18F]NPB4, although its movement was more restricted in the striatum than in agarose (for comparison, see Figure 1d). Each image series is scaled to the maximum intensity at the center of the infusion in the first image image (a,d,g) to highlight loss of total activity with time, i.e., tracer elimination. Scale bar is 2mm. Abbreviations: fluorobenzylamine-poly(ethylene glycol)4- biotin (NPB4), fluorodeoxyglucose (FDG).
FIGURE 5.
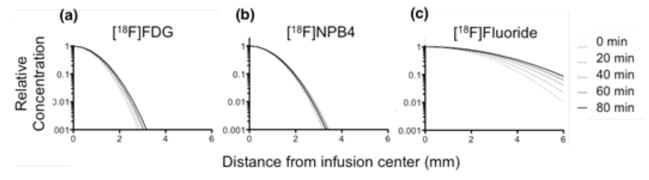
Concentration profiles show the time-dependent distribution of various radiolabeled compounds infused into the rat striatum at 0, 20, 40, 60, and 80 minutes after the infusion. Profiles were each normalized to a maximum of 1.0 for display purposes. (a–b) The distribution of [18F]FDG and [18F]NPB4 was highly restricted in vivo (c) By contrast, [18F]Fluoride was observed to move readily through the rat striatum. (a–c) are plotted on a log-linear scale for ease of visualization. Abbreviations: fluorobenzylaminepoly(ethylene glycol)4-biotin (NPB4), fluorodeoxyglucose (FDG).
FIGURE 6.

Radiolabeled compounds delivered to the rat striatum were subject to multiple transport processes that influenced the concentration profile, including diffusion, binding/immobilization, and clearance. (a) Tracer distributions in the brain established by the convective infusion of the radiolabeled compound depended on the properties of the tracer and the infusion protocol. (b) Radiotracer was eliminated from the rat striatum over time. After completion of the infusion, total activity decreased, with an estimated first-order half-life of 41, 27, and 19 minutes for [18F]Fluoride, [18F]FDG, and [18F]NPB4 (two replicates per tracer). Abbreviations: fluorobenzylamine-poly(ethylene glycol)4-biotin (NPB4), fluorodeoxyglucose (FDG).
DISCUSSION
This paper presents a new PET imaging and analysis methodology to measure the distribution of radiolabeled agents that have been delivered directly to the brain, i.e., dPET. The dPET method was validated by examining direct delivery of radiolabeled agents to an agarose brain mimic, where the dominant force governing compound distribution is diffusion. Dilute agarose gel has been chosen as a tissue mimic in a variety of applications, including measurement of the diffusion coefficient [6, 20–21]. Agarose gel is physically stable and will present radiolabeled agents with an unhindered, aqueous environment for diffusion. In these experiments, the average pore size of the agarose gel is expected to be on the order 500 nm, which is larger than the porosity of the brain ECM, and also much larger than the hydrated radius of the radiotracers that were studied [22]. The estimated diffusion coefficients of these radiotracers are therefore expected to be similar to measurements of free diffusion in water. The Stokes-Einstein relationship (Equation 4) relates the diffusion coefficient to the hydrated radius of the diffusing molecule, and it is applicable for low Reynolds numbers (as is the case here, where spherical molecules are moving at the velocities produced by thermal events). The dPET method resulted in diffusion coefficient estimates that fit this relationship as with other methods (Figure 3). We estimated the scaling coefficient in Equation 5, A, to be 3.5 × 10⁻⁵ cm2/s. Values for A reported in literature range from 2.3–4.37 × 10⁻⁵ cm2/s (Table 1). It is possible that the behavior of certain molecules could deviate from what would be predicted by the Stokes-Einstein relationship. For example, the molecular weight of [18F]Fluoride is expected to be 18 Da, however, fluoride may be ionized and/or hydrated in solution, which would increase its effective molecular weight, producing a lower than expected diffusion coefficient. If fluoride ion were behaving as a higher molecular weight agent, we would expect to see that the diffusion coefficient measured by dPET would deviate from the Stokes-Einstein model. We tested this hypothesis by fitting the higher molecular weight data set with and without inclusion of fluoride ion. In fact, inclusion of the fluoride ion data did not reduce the quality of the model fit (R-squared of 0.9560 versus 0.9327 with and without fluoride ion data, respectively), suggesting that the diffusion behavior of fluoride ion does not deviate substantially from what would be predicted based on its assumed molecular weight. These experiments demonstrate that dPET produces accurate concentration measurements, judging by diffusion coefficient estimates that are as good as conventional techniques.
There were a many possible approaches for analyzing the dPET images. The data presented here were analyzed by FBP reconstruction; OSEM reconstructions were also performed to reduce noise and potentially improve our diffusion coefficient estimates. There were no consistent differences between diffusion coefficients measured from OSEM and FBP images. However, since FBP reconstruction permits negative values and OSEM reconstruction does not, OSEM data have the potential to produce a positive bias to the data when the total activity is low. For this reason, FBP reconstruction was chosen for the quantitative analysis of all data sets. We also performed data fits on several 18F-labeled tracers binned in 5- versus 20- minute frames; no bias in the estimated diffusion coefficients was observed, and so 5- and 20-minute frames were chosen for 11C- and 18F-labeled compounds, respectively, to reduce the computation required to process each data set. This method enabled us to estimate the diffusion coefficient from 6–20 reconstructed frames. The data were not weighted during the least squares fitting procedure, and so fits were better (smaller residuals) for distances farther from the center, where more data points were available for fitting (Figure 2). There were no consistent trends in the residuals as a function of distance or in the diffusion coefficient calculated for different time frames, suggesting that the data were well described by the diffusion model. The theoretical uncertainty in the parameter estimates was obtained from the diagonal elements of the covariance matrix. In all cases, the standard deviation of the parameter estimate exceeded the theoretical uncertainty by a factor of 1.5–10. Since the data are not independent (neighboring pixels are correlated due to the partial volume effect), this result is expected.
Although it would have been possible to fit the data as a single four-dimensional data set, fitting individual frames enabled us to directly assess the uncertainty in the parameter estimate, which ranged from 1–11% for molecules other than [18F]NPB4-avidin (see following discussion). In addition to providing information about the experimental uncertainty (i.e., the inter-frame variability), this approach enabled us to make judgments regarding the time-dependent behavior of radiolabeled agents in solution. [18F]NPB4-avidin experienced the highest variability of any of the compounds tested. In three separate experiments, D was measured to be 0.0017±0.0013, 0.0016±0.0018, and 0.00041±0.0046 mm2/min. The high inter-frame variability was due to a measured diffusion coefficient that consistently decreased with time. The measurement of the diffusion coefficient was steady or varied stochastically over time for all other compounds tested. Since avidin – a positively charged protein – is known to experience significant aggregation in solution, it is likely that the downward drift in the value of the diffusion coefficient over time reflects aggregation, which would result in an increase in the effective molecular weight, a slowing of diffusion, and reduction in the estimated value of D over time. It is possible that other phenomena (e.g., crowding or charge shielding) could alter the expected diffusion of a compound, either by directly influencing the effective molecular weight, or by enhancing or diminishing aggregation. Thus, alternative explanations for the time-dependent diffusion coefficient of NPB4-avidin exist. Here, we are focused on measuring the concentration gradients that result from direct delivery of active agents to the parenchyma. The time-dependent behavior we observed from NPB4-avidin was measured in situ, in intact tissue, and could not have been as easily obtained from traditional techniques that result in inherent loss of kinetic information (i.e., fluorescence and autoradiography). dPET may be a useful method to conduct detailed study of the response of proteins to changes in environmental conditions such as pH or osmolality.
In the process of optimizing the fitting algorithms, we observed that data fitting was particularly sensitive to the initial concentration profile, C0(r). C0 is obtained from the first injector-free image (with a 20 minute infusion and 20 minute waiting period, this would be 40 minutes after the start of the infusion) and therefore influences every frame’s estimate of the diffusion coefficient. Since only a few points are available near the center of the infusion, and many points are available near the edge of the image, small variations in the fitted center location produce larger variation in the radial distribution of points near the vial or skull boundary that produce a significant effect on the final concentration profiles. When the resolution of the center location was reduced (i.e., when the center location was selected from available whole pixels, as opposed to taking on a fractional value), the subsequent data fits were poor, with obvious non-random patterns identified in the residuals. When the center location was allowed to vary continuously, the data fits improved dramatically. It is therefore critical that a fitting algorithm such as Equation 1 be used to locate the center of the diffusing profile exactly.
We next tested the ability of dPET to measure the movement of radiolabeled agents that were delivered directly to the brain via clinically relevant delivery paradigms. Convection enhanced delivery (CED) involves the delivery of fluid via a positive pressure gradient to enhance the movement of active agents through the brain extracellular matrix [23]. Once delivered, agents are expected to distribute according to a variety of competing forces, including convection, diffusion, binding, and clearance. Most tracers that were locally delivered to the brain were rapidly immobilized in tissue (Figure 5). This result was expected, since binding/metabolism/immobilization sites for each compound are known to be abundant (as would be the case for many drugs of interest): [18F]FDG is converted to [18F]FDG-6-P and immobilized within cells, [18F]NPB4 binds to biotin binding proteins, [11C]PHNO binds to D2/D3 receptors, and [11C]DASB binds to serotonin transporters. The in vivo data was fit to Equation 2 to obtain estimates of the in vivo, “lumped” diffusion coefficient, a fitted parameter that that does not discern between diffusion and binding. For agents that are known to have abundant binding sites in the brain, the value for this parameter was too low to be measured reliably.
CED is designed to improve the distribution of locally delivered agents, and dPET was useful in discerning differences between compound distributions on a scale that would be useful for making clinically relevant decisions. The distribution of agents that experience binding in the brain (e.g., FDG, NPB4) was highly limited, which mimics the possible clinical scenario of delivering a drug that ultimately fails to reach its target. For comparison, [18F]Fluoride, a compound that is not expected to bind to tissue, traveled farther during the infusion than other compounds; enhanced distribution was also observed with higher convective flow rates (Figure 5a). These experiments show examples of differences in delivery measured by dPET that would be expected to produce differences in treatment efficacy. Our analysis yielded information about drug delivery that would be unattainable by conventional techniques: in addition to obtaining direct measurement of concentration profiles, we also measured effective diffusion, tortuosity, and clearance in intact brain. The dPET method could therefore streamline development of new therapies by improving our understanding of barriers to drug transport, obtaining kinetic information within a single animal (reducing the number of animals utilized), and having the potential for direct clinical application to measure the distribution of radiolabeled drugs in human trials.
CONCLUSION
To the best of our knowledge, this is the first series of experiments to report the direct, quantitative, and completely non-invasive imaging and modeling of the transport of a compound delivered to deep brain regions. There are several advantages to using PET imaging to measuring the spatial distribution of locally delivered compounds. PET is a quantitative imaging method and yields absolute concentration values that are comparable between different experiments. This could become particularly useful in the context of drug treatment studies, where the ability to measure absolute drug concentrations measured by different experimenters would be an advantage. Furthermore, the imaging itself is non-invasive, such that multiple imaging experiments can be performed in a single animal or in an animal that is also used for other experiments. Because the imaging method is used commonly in the clinic, this method could be applied to humans, enabling quantification of drug distributions in subjects that are also receiving experimental therapies.
Acknowledgments
The authors gratefully acknowledge the contributions of the staff of the Yale PET Center, including Maria Corsi, Krista Fowles, Jim Ropchan, Patrick Ouellette, and Nancy Nishimura for their technical assistance. This work was supported by National Institutes of Health grant, T32DA022975, “Neuroimaging Sciences Training Program” and was also made possible by CTSA Grant Number UL1RR024139 from the National Center for Research Resources (NCRR) and the National Center for Advancing Translational Science (NCATS), components of the National Institutes of Health (NIH), and NIH roadmap for Medical Research.
Footnotes
CONFLICT OF INTEREST STATEMENT
The authors declare no conflicts of interest.
Its contents are solely the responsibility of the authors and do not necessarily represent the official view of NIH
References
- 1.Krewson CE, Klarman ML, Saltzman WM. Distribution of nerve growth factor following direct delivery to brain interstitium. Brain Res. 1995;680:196–206. doi: 10.1016/0006-8993(95)00261-n. [DOI] [PubMed] [Google Scholar]
- 2.Pardridge WM. The blood-brain barrier: bottleneck in brain drug development. NeuroRx. 2005;2:3–14. doi: 10.1602/neurorx.2.1.3. [DOI] [PMC free article] [PubMed] [Google Scholar]
- 3.Kreuter J. Nanoparticulate systems for brain delivery of drugs. Adv Drug Deliv Rev. 2001;47:65–81. doi: 10.1016/s0169-409x(00)00122-8. [DOI] [PubMed] [Google Scholar]
- 4.Neeves KB, Sawyer AJ, Foley CP, Saltzman WM, Olbricht WL. Dilation and degradation of the brain extracellular matrix enhances penetration of infused polymer nanoparticles. Brain Res. 2007;1180:121–132. doi: 10.1016/j.brainres.2007.08.050. [DOI] [PMC free article] [PubMed] [Google Scholar]
- 5.Tiwari SB, Amiji MM. A review of nanocarrier-based CNS delivery systems. Curr Drug Deliv. 2006;3:219–232. doi: 10.2174/156720106776359230. [DOI] [PubMed] [Google Scholar]
- 6.Chen MY, Lonser RR, Morrison PF, Governale LS, Oldfield EH. Variables affecting convection-enhanced delivery to the striatum: a systematic examination of rate of infusion, cannula size, infusate concentration, and tissue-cannula sealing time. J Neurosurg. 1999;90:315–320. doi: 10.3171/jns.1999.90.2.0315. [DOI] [PubMed] [Google Scholar]
- 7.Neeves KB, Lo CT, Foley CP, Saltzman WM, Olbricht WL. Fabrication and characterization of microfluidic probes for convection enhanced drug delivery. J Control Release. 2006;111:252–262. doi: 10.1016/j.jconrel.2005.11.018. [DOI] [PubMed] [Google Scholar]
- 8.Langer R. Drug delivery. Drugs on target. Science. 2001;293:58–59. doi: 10.1126/science.1063273. [DOI] [PubMed] [Google Scholar]
- 9.Gash DM, Zhang Z, Ai Y, Grondin R, Coffey R, Gerhardt GA. Trophic factor distribution predicts functional recovery in parkinsonian monkeys. Ann Neurol. 2005;58:224–233. doi: 10.1002/ana.20549. [DOI] [PubMed] [Google Scholar]
- 10.Peterson AL, Nutt JG. Treatment of Parkinson’s disease with trophic factors. Neurotherapeutics. 2008;5:270–280. doi: 10.1016/j.nurt.2008.02.003. [DOI] [PMC free article] [PubMed] [Google Scholar]
- 11.Salvatore MF, Ai Y, Fischer B, et al. Point source concentration of GDNF may explain failure of phase II clinical trial. Exp Neurol. 2006;202:497–505. doi: 10.1016/j.expneurol.2006.07.015. [DOI] [PubMed] [Google Scholar]
- 12.Chen W, Cao Y, Liu M, et al. Rotavirus capsid surface protein VP4-coated Fe(3)O(4) nanoparticles as a theranostic platform for cellular imaging and drug delivery. Biomaterials. 2012;33:7895–7902. doi: 10.1016/j.biomaterials.2012.07.016. [DOI] [PubMed] [Google Scholar]
- 13.Chertok B, Moffat BA, David AE, et al. Iron oxide nanoparticles as a drug delivery vehicle for MRI monitored magnetic targeting of brain tumors. Biomaterials. 2008;29:487–496. doi: 10.1016/j.biomaterials.2007.08.050. [DOI] [PMC free article] [PubMed] [Google Scholar]
- 14.Janib SM, Moses AS, MacKay JA. Imaging and drug delivery using theranostic nanoparticles. Adv Drug Deliv Rev. 2010;62:1052–1063. doi: 10.1016/j.addr.2010.08.004. [DOI] [PMC free article] [PubMed] [Google Scholar]
- 15.Kim JH, Astary GW, Nobrega TL, et al. Dynamic contrast-enhanced MRI of Gd-albumin delivery to the rat hippocampus in vivo by convection-enhanced delivery. J Neurosci Methods. 2012;209:62–73. doi: 10.1016/j.jneumeth.2012.05.024. [DOI] [PMC free article] [PubMed] [Google Scholar]
- 16.Zheng M, Sirianni R, Patel T, et al. [18F]PEG-Biotin labeled nanoparticles for tracking drug delivery and tumor therapy. Journal of Nuclear Medicine. 2010;52:417. [Google Scholar]
- 17.Polson A, van der RD. Relationship between diffusion constants and molecular weight. Biochim Biophys Acta. 1950;5:358–360. doi: 10.1016/0006-3002(50)90182-x. [DOI] [PubMed] [Google Scholar]
- 18.Nicholson C, Phillips JM. Ion diffusion modified by tortuosity and volume fraction in the extracellular microenvironment of the rat cerebellum. J Physiol. 1981;321:225–257. doi: 10.1113/jphysiol.1981.sp013981. [DOI] [PMC free article] [PubMed] [Google Scholar]
- 19.Sykova E, Nicholson C. Diffusion in brain extracellular space. Physiol Rev. 2008;88:1277–1340. doi: 10.1152/physrev.00027.2007. [DOI] [PMC free article] [PubMed] [Google Scholar]
- 20.Chen ZJ, Gillies GT, Broaddus WC, et al. A realistic brain tissue phantom for intraparenchymal infusion studies. J Neurosurg. 2004;101:314–322. doi: 10.3171/jns.2004.101.2.0314. [DOI] [PubMed] [Google Scholar]
- 21.Nicholson C, Tao L. Hindered diffusion of high molecular weight compounds in brain extracellular microenvironment measured with integrative optical imaging. Biophys J. 1993;65:2277–2290. doi: 10.1016/S0006-3495(93)81324-9. [DOI] [PMC free article] [PubMed] [Google Scholar]
- 22.Maaloum M, Pernodet N, Tinland B. Agarose gel structure using atomic force microscopy: gel concentration and ionic strength effects. Electrophoresis. 1998;19:1606–1610. doi: 10.1002/elps.1150191015. [DOI] [PubMed] [Google Scholar]
- 23.Laske DW, Morrison PF, Lieberman DM, et al. Chronic interstitial infusion of protein to primate brain: determination of drug distribution and clearance with single-photon emission computerized tomography imaging. J Neurosurg. 1997;87:586–594. doi: 10.3171/jns.1997.87.4.0586. [DOI] [PubMed] [Google Scholar]