

Abstract
We report here a novel combination of time-resolved imaging methods for probing mitochondrial metabolism multiple time scales at the level of single cells. By exploiting a mitochondrial membrane potential reporter fluorescence we demonstrate the single cell metabolic dynamics in time scales ranging from milliseconds to seconds to minutes in response to glucose metabolism and mitochondrial perturbations in real time. Our results show that in comparison with normal human mammary epithelial cells, the breast cancer cells display significant alterations in metabolic responses at all measured time scales by single cell kinetics, fluorescence recovery after photobleaching and by scaling analysis of time-series data obtained from mitochondrial fluorescence fluctuations. Furthermore scaling analysis of time-series data in living cells with distinct mitochondrial dysfunction also revealed significant metabolic differences thereby suggesting the broader applicability (e.g. in mitochondrial myopathies and other metabolic disorders) of the proposed strategies beyond the scope of cancer metabolism. We discuss the scope of these findings in the context of developing portable, real-time metabolic measurement systems that can find applications in preclinical and clinical diagnostics.
Keywords: Microscopy, Mitochondria, Breast Cancer, Metabolic Imaging, Scaling Behavior, NDUFS3
1. Introduction
The holy grail of biomedical research is an ability to exert precise control on biological systems so as to obtain predictable responses that could eventually be translated to medical technologies beneficial to improving human health. A plethora of innovative technologies have made this possible over the last few decades. Along with this good news, we also encounter multiple technological limitations, instrumental caveats, subjective human errors which ultimately limit the scope of diagnostic accuracy in disease detection. Traditional clinical diagnosis depends on pathology approaches. Histopathology and cytopathology have been the center pieces of this diagnostic edifice and there have been continual improvements in these methods with the advent of novel technologies such as hyperspectral slide scanning etc., Diagnostic accuracy at this stage can vary between 70–95% depending on multiple factors such as inadequate sampling, pathologist’s experience and competence as well as poor sensitivity/specificity.[1–7] In recent times, digital pathology is making its impact in high through-put analysis and in overcoming some of the subjective human errors mentioned above. Despite these advances, the current technological platforms are only able to report morphometric and/or anatomical alterations in various disease phenotypes in fixed tissue specimens. It is imperative to develop strategies to probe physiological status in fresh biopsy specimens and if possible, disease tissue states in the patient in vivo – so that clinicians can make informed decision during surgical procedures. A number of recent studies and other clinical findings point out that metabolic disorders lie at the root of many disease phenotypes.[8–11] Understanding metabolism at the single cell level can be the basis of developing novel therapeutics as well as technological platforms for interrogating tissue metabolism in preclinical and clinical settings. Our lab has been involved in developing single cell metabolic imaging strategies for high-content discrimination of normal and transformed cells (cancer, aging and other metabolic diseases) based on their metabolic profiles. In our earlier studies, we have exploited a variety of novel fluorogenic reporters and high resolution imaging systems to address critical biological questions.[12–17] Spatially resolved metabolic information is necessary for understanding metabolic responses in the context of functional intracellular dynamics in intact cells. An equally important but often ignored aspect of metabolic imaging is the temporal dynamics that the multiple players display in cellular response. By design there is a significantly large dynamic range of timescales (~ nanoseconds to microseconds to seconds to even minutes) in which one can encounter while measuring cellular responses to metabolic stimuli. In this manuscript, we propose a novel, comprehensive time-layered approach for monitoring single cell metabolism at different time scales. Monitoring temporal dynamics of the mitochondrial status can be a valuable tool in assessing cell metabolism in health and disease conditions. We focus on three methods of revealing distinct temporal information in cellular metabolism namely (a) single-cell kinetics, (b) fluorescence recovery after photobleaching (FRAP) and (c) fluorescence fluctuation analysis and scaling behavior in single cells. The goal of this paper is to highlight the importance of time-resolved imaging in single cell metabolism and to demonstrate a functional combination of a few strategies as a proof-of-principle evaluation of this concept. We discuss their potential in studying cancer cell metabolism and mitochondrial dysfunction in living cells.
2. Materials & Methods
2.1 Cells and Reagents
MCF10A and MCF7 were originally purchased from American Type Culture Collection (ATCC) and were cultured in Dulbecco’s Modified Eagle Medium (DMEM) with high glucose (4.5g/l) and 10% fetal bovine serum (FBS) and antibiotics. MCF10A is a non-transformed (normal) human mammary epithelial cell line while MCF7 is a human breast cancer cell line. Human embryonic kidney (HEK-293T) cells were maintained in DMEM medium (1g/l glucose) supplemented with 10% fetal bovine serum and antibiotics. Flow cytometry analysis of live cells was done in FACScan flow cytometer (BD Biosciences) with appropriate labeling mix in the cell population: fluorescent-analog of glucose : 2-[N-(7-nitrobenz-2-oxa-1,3-diazol-4-yl) amino]-2-deoxy-d-glucose (100 µM 2NBDG; Invitrogen, CA, USA) or mitochondrial membrane potential marker : tetramethyl rhodamine methyl ester ( 200nM TMRM; Invitrogen, CA, USA). The experimental protocol involved labeling the live cells with the probes for 20 minutes at 37 °C and measuring the single cell fluorescence in a flow cytometer as described in our earlier publication.[18]
2.2 Live Cell Kinetics Imaging
For assaying real-time metabolic response kinetics in live cells, the cells were plated in poly-L-Lysine coated Delta T chambers (Bioptechs, Butler, PA, USA). Cells were labeled with 200nM TMRM probe (37 °C; 1 hour) before imaging with a laser scanning confocal microscope (Leica SP5) equipped with a white light laser (excitation at 567nm; emission bandwidth = 585–625nm; objective lens 63X ; NA 1.3). All imaging experiments were carried out at room temperature. For FRAP measurements, the raster scanning mode (80 MHz) was employed for data acquisition. Measurements were carried out in three distinct time-scales : (a) Time scale 1: For monitoring steady state kinetics of TMRM response, time-lapse images of two-dimensional fields of view – were obtained (1024×1024 pixels; time interval : 2.6 s; n= 100 images per stack); A typical size for every field of view was (75 µm × 75 µm). (b) Time scale 2: For monitoring the FRAP dynamics, the cells were excited with the same laser wavelength as before. A typical FRAP cycle involved collecting 10 pre-bleach images (256×256 pixels; laser power 10%) and bleaching for 50 cycles (laser power 100%) and finally collecting 120 post-bleach images (laser power 10%) for fluorescence recovery. Time interval between two consecutive images during FRAP experiments was set at 78 ms. (c) Time scale 3: Time-series data acquisition was carried out as described in our earlier publications.[19, 20] Briefly, a field of view with ~ 4–6 cells was chosen before measurements. For achieving high time resolution, a line scan was performed so that the chosen line spanned all the cells. Typically, time-series data were acquired for N=32,598 time points (~2 ms/line). Every line scan sampled the cell yielding typically 100–300 individual time-series depending on the region of interest. By averaging these sets of time-series data, one obtains a good statistical score of probing the spatio-temporal dynamics in single cells.
2.3 Image analysis
Lipophilic cations such as TMRM accumulate in mitochondrial in proportion to the membrane potential, ΔΨ, which can be calculated on the basis of Nernst equilibrium conditions.[21, 22] Nernst equation computes the equilibrium potential for an ion based on the charge on the ion and its concentration gradient across the membrane and is given by the generalized equation : ΔΨeqm = [RT/zF] * ln{[Fin]/[Fout]} where R is the universal gas constant [8.314 Joules per Kelvin per mole], T is the temperature in Kelvin, z is the valence of the ionic species, F is the Faraday’s constant [96485 Coulombs per mole], [Fin] and [Fout] represent ionic concentrations inside and outside the cellular compartment respectively. The above equation can be simplified for a monovalent ionic species such as TMRM as : ΔΨeqm = −60 * log{[Fin]/[Fout]} where [Fin] and [Fout] can represent the measured TMRM fluorescence intensities within and outside mitochondrial compartment respectively. For computing the steady state mitochondrial membrane potential in live cell images, small regions of interest (typically 3µm × 3µm) were marked around individual mitochondrial spots to measure the fluorescence intensities. Identical regions of interest marked around the mitochondria and/or the extracellular areas served as the background fluorescence [Fout] used in the computation of Nernst potential. Steady state kinetics image stacks were analyzed in ImageJ (rsbweb.nih.gov/ij/). Multiple regions of interest (size ~ 3µm × 3µm) were positioned on the image stacks without any bias and fluorescence signals were grouped together for the various time points in the image stack. Kinetic profiles were plotted and fluorescence recovery rates calculated using the graphics software Origin 8.0. FRAP recovery profiles were analyzed using Leica ACS software. Besides the steady-state kinetics and FRAP analysis, scaling analysis is an elegant way to probe real-time regulatory dynamics is by analyzing subtle signal fluctuations (TMRM fluorescence fluctuations in the present case) that attempts to look for time-correlations between the signal (or process) at any instant and the same signal (or process) at some other instant. If there are no apparent correlations between various time-windows, then the underlying process can be assumed to be a “random” process. Brownian diffusion is a classical example of a random process (white or brownian noise) with no apparent long-range time-correlations. On the other hand, a non-random scaling behavior may indicate positive regulatory correlations that control the cellular process. Towards this end, we applied an analytical method namely Detrended Fluctuation Analysis (DFA) originally developed by C.-K.Peng et al. to quantify statistical correlations in time-series signal. More details about this algorithm can be obtained from the webpage of National Research source, www.physionet.org. [23, 24] Time-series data were analyzed by detrended fluctuation analysis as described in our earlier publications.[19, 25] Briefly, the original time-series (of length N) is first integrated and then divided into boxes of equal size (n). In each box, a polynomial equation was fit to the integrated which gives a local trend in that box. Next this local trend is subtracted from the integrated profile in each box (i.e., scaling window) which is termed „detrending’. Finally, root mean squared (rms) fluctuations F(n) is calculated from the integrated and detrended signals in each box. These steps are repeated for different values of box size (n) to generate F(n) for broad range of scale sizes n. Intuitively F(n) will increase as n increases and for scale-invariant signals with power-law correlations, there is a scaling relationship F(n) = nα. The scaling exponent, α, is thus a robust measure of complexity in the experimental data set and as described above, α, signifies the time-correlated dynamics in the normal and cancer cells during metabolic perturbations. In the present case, small regions of interest (typical width 1µm) were marked in the time-series images and fluorescence fluctuations of these data series (xt) were used for extracting scaling exponent as described above.
2.4 Statistics
Data presented are Mean ± S.E from at least three independent experiments unless otherwise mentioned. Statistical significance was estimated based on Student’s t-test (p < 0.05).
3. Results
3.1. Probing steady state mitochondrial status in living cells
A number of earlier studies have demonstrated that mitochondrial status in living cells is a critical determinant of the cell viability as well the cellular bioenergetics profile.[9, 11, 26–28] Experimentally, mitochondrial status can be monitored by measuring electron transport chain activity and oxygen consumption measurements that demonstrate the integrity of electron transport chain within the inner mitochondrial membrane. Besides the conventional biochemical enzymatic assays that involve isolated mitochondria and/or sub-mitochondrial particles, there has been a tremendous interest in spatially resolved mitochondrial imaging in single living cells.[20, 27] In this context, fluorescent lipophilic cationic dyes that accumulate inside the mitochondrial matrix have been successful as reporters of mitochondrial membrane potential (ΔΨ) in living cells as described in Section 2.3. [21, 22] Despite some ambiguities about the labeling and binding artifacts, these probes have proved valuable in reporting mitochondrial status in a variety of cell biological applications.[22] In the present study, we employed one of these commercially available probes, tetramethyl rhodamine methyl ester (TMRM) for demonstrating the time-layered approach described here. Figures 1a &b show representative images of human mammary epithelial cell line MCF10A and human breast cancer cell line MCF7 labeled with mitochondrial membrane potential marker, TMRM. Among many cancer cell lines investigated in our laboratory, MCF7 cells showed near-identical TMRM uptake kinetics (Figure 1c) to that of the normal MCF10A cells. Since our goal is to demonstrate the relative advantages of time-resolved imaging strategies over conventional fluorescence imaging, we choose to present all our results only from this pair of cell lines (MCF10A & MCF7). Clear mitochondrial localization in both the cell lines indicated intact mitochondrial network as well as mitochondrial membrane polarization status in both the cell lines. Steady state localization of the probe further illustrated a Nernst equilibrium between the mitochondrial matrix and the extracellular environment.[21, 22] Regardless of slight differences in TMRM uptake rate, the steady-state mitochondrial membrane potential (Nernst equilibrium) computed in these cell lines were nearly the same at the single mitochondrial level (Figure 1d). In order to mitigate artifacts due to imbalance in Nernst equilibrium, the extracellular bath contained phosphate buffered-saline (PBS) with 200nM TMRM probe during all the measurements reported in this manuscript. In contrast to the steady-state imaging data shown in Figure 1d, flow cytometry analysis of whole cell fluorescence (sampled events ~ 30,000 per cell line for each measurement) revealed basal differences in metabolic status in the two cell lines studied. Figure 1e shows the mean metabolic signals (glucose uptake, mitochondrial mass and mitochondrial membrane potential) obtained from MCF10A and MCF7 cell lines. An estimate of mitochondrial mass was obtained by labeling the cells with Mitotracker Green whose accumulation within mitochondria is not dependent on the membrane potential status unlike TMRM. As can be seen clearly, MCF7 cells showed a clear reduction in TMRM signals (membrane potential) as compared to MCF10A cells. This TMRM reduction was in direct proportion to the reduction in Mitotracker Green signals (mitochondrial mass) thereby confirming that both these cell lines displayed near identical mitochondrial membrane potential normalized to mitochondrial mass in each cell line.
Figure 1. Steady state mitochondrial status in normal and cancer cells.
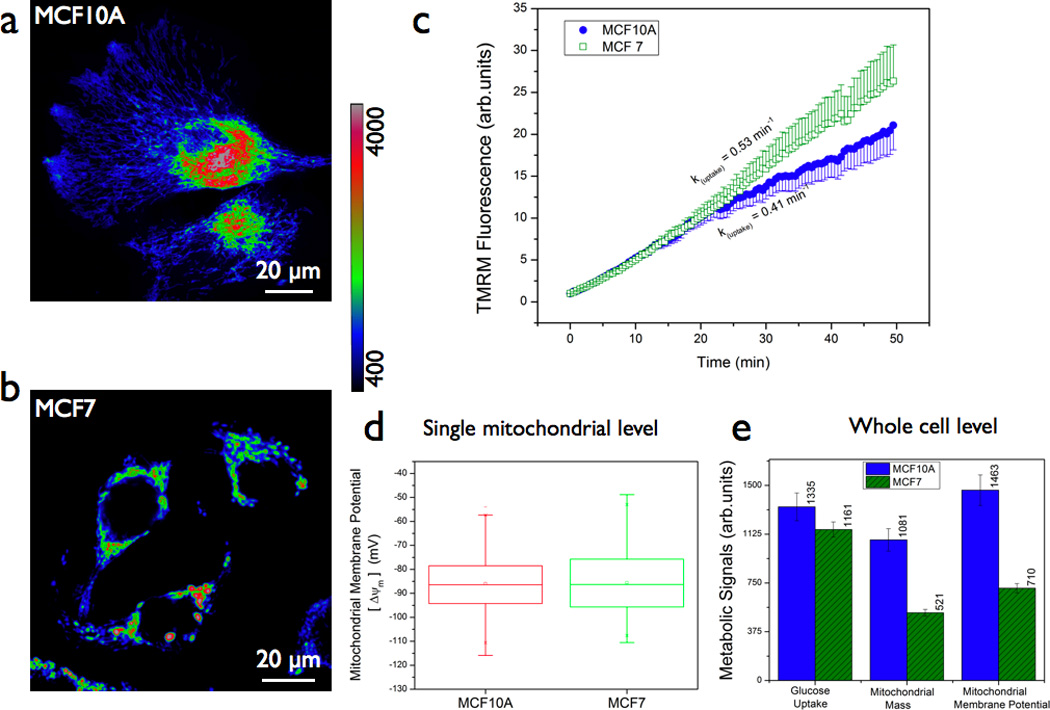
(a & b) Representative fluorescence images of normal (MCF10A) and breast cancer (MCF7) cells labeled with 200nM tetramethyl rhodamine methyl ester (TMRM) probe (1h, 37 °C). Mitochondrial localization and hence the concentration/fluorescence intensity of the probe is dependent on mitochondrial membrane potential. Scale bars = 20 µm. (c) Real-time probe uptake kinetics in MCF10A and MCF7 cells at room temperature as measured in a confocal microscope. Live cells in delta-T chambers were placed on the microscope stage and 200nM TMRM was added and time-lapse imaging was initiated immediately. (d) Statistical analyses of mitochondrial regions of interest (typical size 3µm × 3µm) from multiple images of both normal and cancer cells revealed no significant difference in steady state localization of the TMRM probe and hence in the mitochondrial membrane potential (ΔΨ) calculated on the basis of Nernst equilibrium [ΔΨ(mV) = −60 log [Fin/Fout] where Fin is the TMRM fluorescence intensity inside the mitochondrial matrix and Fout is the TMRM fluorescence intensity outside the cell (or cytoplasm). (e) Flow cytometry analysis of metabolic signals in normal and cancer cells : ean mitochondrial membrane potential (as measured by TMRM), mean mitochondrial mass (as measured by Mitotracker Green) and glucose uptake potential (as measured by 2NBDG). Note that reduction in mitochondrial membrane potential in cancer cells corresponded linearly with that of the reduction in mitochondrial mass thereby confirming that both these cell lines have near-identical mitochondrial membrane potential normalized to the mitochondrial mass.
3.2. Time scale 1: Probing steady state kinetics of TMRM redistribution in living cells
In normal cellular bioenergetics, complete oxidation of glucose involves a robust link between glycolytic pathway and mitochondrial pathway. Preclinical and clinical observations have revealed significant alterations in glucose metabolism in many cancer types. Our laboratory and other groups have shown that these altered metabolic profile (“metabolic switch” or “aerobic glycolysis”) in cancer cells can be exploited for early detection.[9, 11, 18, 25, 26, 29] In order to test if the normal and cancer cells display differential mitochondrial response to glucose stimulus, we monitored steady state kinetics of mitochondrial membrane potential in MCF10A and MCF7 cells (Figure 2a & 2b). Despite the near-equal mean TMRM fluorescence in both these cell lines (Figures 1d & 1e), glucose stimulus elicited significantly different TMRM response in these two cell lines. Estimates of maximal cellular respiration rate are usually obtained by uncoupling the electron transport chain activity of mitochondria from ATP synthesis. We used a similar strategy by giving a stimulus of a pharmacological uncoupler, Carbonyl cyanide 4-(trifluoromethoxy)phenylhydrazone (5 µM, FCCP) and as can be seen from Figure 2c, mitochondrial depolarization due to uncoupling was also significantly different between the normal and cancer cell lines further indicating intrinsic differences in mitochondrial status in these two cell lines. These results indicate a clear advantage of time-resolved mitochondrial membrane potential imaging. Figure 2d summarizes the quantitative estimates of fluorescence decay rates in these two cell lines under the metabolic perturbations discussed above.
Figure 2. Steady state mitochondrial membrane potential kinetics during glucose metabolism.
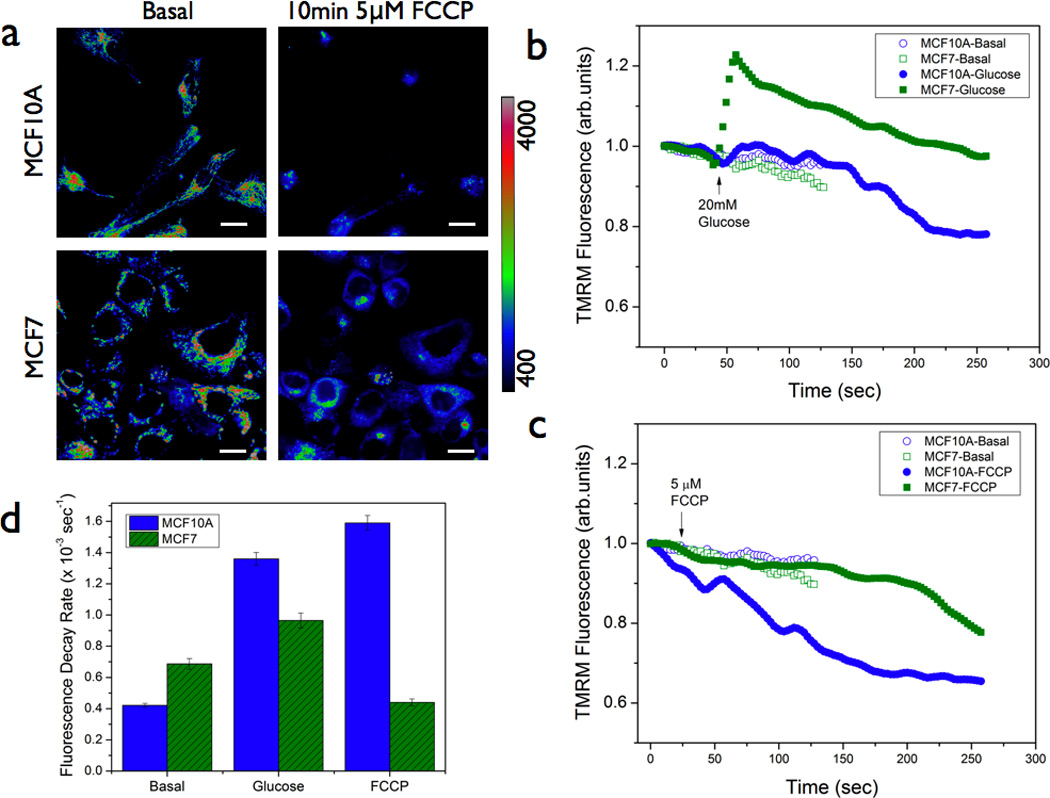
(a & b) Representative fluorescence images of normal (MCF10A) and breast cancer (MCF7) cells pre-labeled with 200nM TMRM, with and without acute treatment with mitochondrial uncoupler FCCP. Scale bars = 20 µm. (b) & (c) Mean TMRM fluorescence decay kinetics in normal and cancer cells in response to 20mM glucose and 5µm FCCP stimuli respectively. As can be seen, the normal and cancer cells displayed significant differences in the kinetic rate constants as summarized in (d) [n = 3]. Statistical significance : p < 0.05
3.3 Time scale 2: Probing metabolic responsiveness in living cells
The observation of differential TMRM response in normal and cancer cells could be rationalized in two ways : (a) there exists a difference in the probe binding/kinetics in these two cell lines (ii) there exists a difference in metabolic response originating from a difference in mitochondrial function in these two cell lines. Since both these cell lines had similar uptake as well as the retention of the TMRM dye (Figures 1b & 1c), the former possibility is less likely as evidenced by near equal fluorescence intensity (a measure of probe concentration). An earlier study further confirmed that the binding partition coefficient of TMRM is very weak as compared to other lipophilic cationic reporters of mitochondrial membrane potential.[22] In order to test the latter possibility, we chose to adopt a well-known dynamic fluorescence imaging approach namely, fluorescence recovery after photobleaching (FRAP). Historically this method has been employed to monitor the dynamics of fluorescent proteins.[30–36] Since TMRM dye was found to obey Nernst equilibrium, we hypothesized that FRAP measurements can illustrate TMRM response dynamics in living cells. In contrast to Figure 2 where the measurements were done at relatively slower sampling rate (~2.8 s per image), FRAP measurements were performed to probe TMRM response dynamics at faster time scales (~80 ms). Figure 3a shows representative images (Pre & Post-FRAP) of MCF10A and MCF7 cells. As it is evident from Figure 3b & 3d, MCF7 cells displayed a significantly different slower fluorescence recovery (4.5 ± 0.3 s vs 3.2 ± 0.3 s for MCF10A cells). Even though we can not completely exclude the possibility of subtle differences in dye binding, the observed differences in fluorescence recovery time between these two cells suggest that there is an apparent reduction in TMRM diffusion and therefore a concomitant reduction in establishing the Nernst equilibrium in the cancer cells as compared to the normal cells. It is important to note that we did not observe any effect due to relative mitochondrial mobility within the time scales of TMRM probe recovery as could be seen from Figure 3c. Fluorescence signal variations within unbleached regions were minimal ruling out any ambiguity due to mitochondrial movements or other signal perturbations. Furthermore, the observed recovery rates were significantly different over a similar range of initial mitochondrial membrane potential (−60 to −100mV) values in both the cell lines (Figure 3e) further ruling out potential artifacts due to significant differences in probe binding. These results also confirm the earlier observation of slower mitochondrial depolarization rate in the cancer cells (Figure 2) at slower time scales also. A more quantitative modeling of this data is beyond the scope of this paper and the main goal of this result is to illustrate that the observed reduction in metabolic responsiveness in cancer cells may arise from functional differences in intrinsic mitochondrial status between the normal and the cancer cells.
Figure 3. Fluorescence recovery after photobleaching (FRAP) imaging reveals metabolic rigidity in mitochondrial membrane potential reporter diffusion.
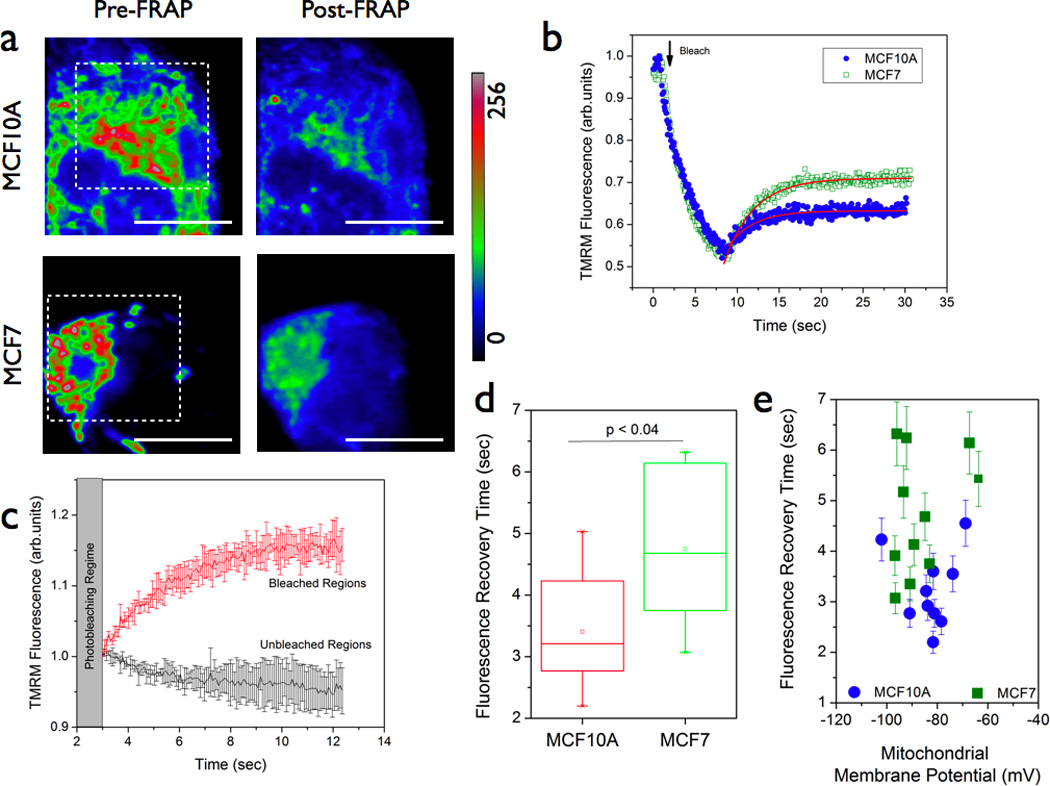
(a & b) Representative images of MCF10A and MC7 cells pre-labeled with 200nM TMRM. Fluorescence recovery profiles (b) were monitored after photobleaching the indicated areas in the images. (c) Representative mean fluorescence recovery profiles (error bars indicate the standard deviation from multiple recovery profiles) of TMRM probe obtained from bleached and unbleached regions. Fluorescence variations in unbleached regions were negligible thereby indicating that no artifacts arising from apparent mitochondrial mobility and/or probe binding were observed during the fluorescence recovery measurements. Statistical analysis (d) of multiple regions (typical size 3µm × 3µm) clearly indicated that fluorescence recovery time was significantly higher in MCF7 cells as compared with the normal MCF10A cells. Since steady-state mitochondrial localization of the TMRM was found to be equal in both these cell lines (Figure 1), the difference in recovery times found in these cell lines are most likely due to functional differences in mitochondrial redistribution of the TMRM probe. (e) The recovery times were not found to have any significant dependence on the initial mitochondrial membrane potential value thereby ruling out any apparent artifacts due to differences in probe binding.
3.4. Time scale 3: Probing nonlinear dynamics and scaling behavior in living cells
In order to further investigate this aspect of reduced metabolic responsiveness in cancer cells, we carried out detailed time-series analysis of TMRM fluorescence fluctuations in MCF10A and MCF7 cells. In our earlier studies, this strategy had revealed novel scaling behaviors in mitochondrial function pertinent to nonlinear dynamics at the level of single cells.[19, 20, 25] In the present study, we wanted to determine if the observed reduction in metabolic responsivenss in cancer cells is also accompanied by altered scaling behavior. Towards this direction, we obtained multiple time-series profiles ( n = 32,598 points, time interval = 2ms) from live cells labeled with TMRM as described above. As described in section 2.4, the time-series data were analyzed by detrended fluctuation analysis (DFA) approach. The scaling exponent, α, is a measure of deviation from randomness (α =0.5) and hence a measure of temporal correlations in the time-series data. Non-random, positive long-range correlations can be observed in the range { 0.5 < α <1.5}. Figure 4a shows representative time-series profiles of TMRM fluctuations in MCF10A cells. As can be seen from the TMRM response, the dye response is much faster than the sampling time (2 ms). As explained in the earlier section and in other published reports, the log-log plot of fluctuations and the window size will yield a linear slope as demonstrated in Figure 4b.[19, 20, 25] Figures 4c & 4d summarize the scaling exponents in both MCF10A and MCF7 cells under various metabolic perturbation conditions. As can been seen from Figure 4c, TMRM fluctuations in MCF10A cells showed robust time-correlated, scaling behavior during basal metabolism (α = 0.75). However an acute glucose stimulus (20mM Glucose) rapidly causes a mitochondrial depolarization in these cells indicating a stronger coupling between glycolytic pathway and mitochondrial pathway in these cells. On the other hand, scaling exponent α has a distinct positive value (α =0.67) in the cancer cells (Figure 4d) during basal metabolism as well as with the glucose stimulus. These results are again consistent with the earlier observations that MCF7 cells displayed a significantly reduced metabolic responsiveness in terms of TMRM redistribution (Figures 2 & 3). It is worth mentioning that the DFA algorithm is better suited to situations with non-stationary signals (e.g., photobleaching and/or drifts). However recent studies have further pointed out certain limiting conditions of its applicability such as fitting range (N/3) where N is the length of the signal.[37–39] In accordance with these theoretical treatments, all the scaling exponents reported in this paper were obtained within the fitting range [0.5 < n < 2.5] to avoid artifacts in long-range non-stationarities. It is intriguing to find that this aspect of reduced metabolic responsiveness is maintained in all the time scales (~ milliseconds to minutes) in MCF7 cells. We further asked if it is possible to modulate this scaling behavior in the normal and the cancer cells by specifically altering the mitochondrial dynamics. To achieve this, we treated both MCF10A and MCF7 cells with a pharmacological inhibitor of mitochondrial complex I function (40 minutes; 37 °C; 1 µM rotenone). Interestingly the normal cells displayed a more acute response than the cancer cells in reduction of scaling behaviors (Figure 4c & 4d). Overall, these data point out that TMRM response dynamics is significantly different between normal and the cancer cells further substantiating our earlier findings. It is important to note that the above observations were found to be true in another breast cancer cell line (MDA-MB-231) (data not shown). At this point, it is valid to ask the question if the observed alterations in TMRM response dynamics is specific to cancer cell metabolism or it is a measure of a more fundamental mitochondrial metabolism. In order to answer this, we resorted to non-cancerous, human embryonic kidney cells (HEK) with mitochondrial complex I specific gene silencing. These cells were recently reported to have distinct mitochondrial dysfunction.[26] When we carried out the TMRM fluctuation analysis in the HEK-parental and HEK-shRNA NDUFS3 cell lines, the scaling exponents were found to be significantly different in the cell lines with mitochondrial dysfunction (Figure 5) thereby indicating that the observed alterations in TMRM response dynamics stem from fundamental mitochondrial defects. Since cancer cells have been known to harbor mitochondrial dysfunctions, we speculate that the observed TMRM response dynamics in MCF7 cells could originate from underlying mitochondrial dysfunction in these cells.
Figure 4. Nonlinear scaling analysis of TMRM fluorescence fluctuations in normal and cancer cells.
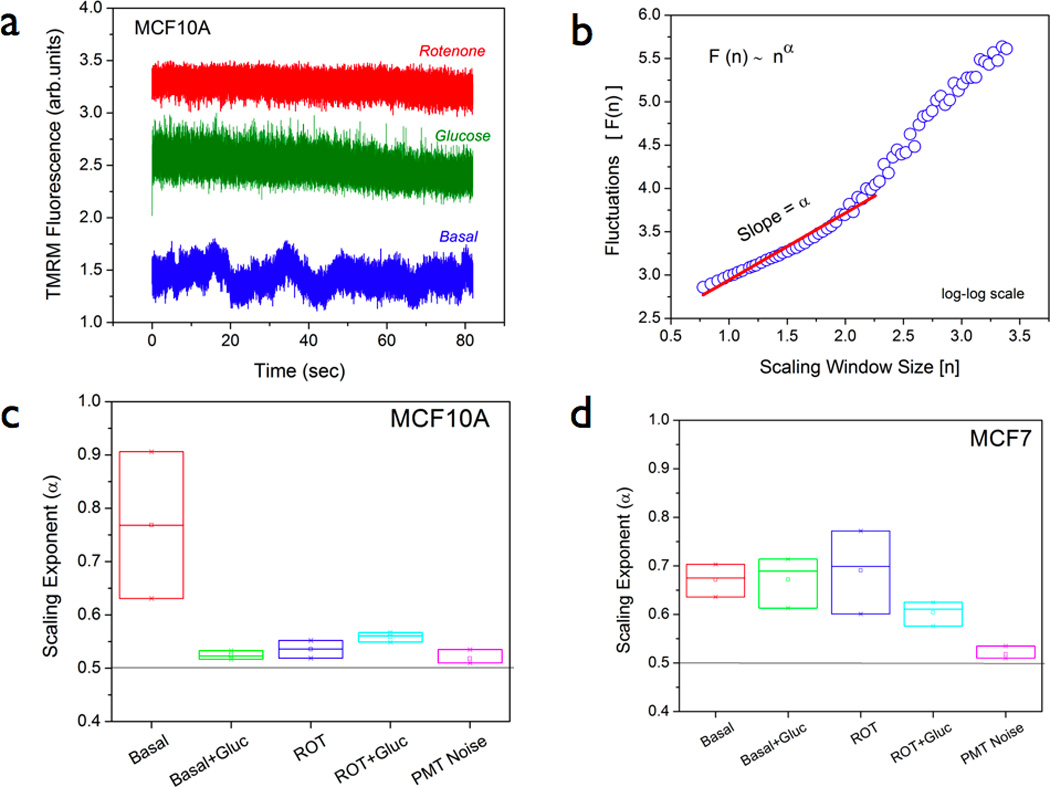
(a) Representative time-series profiles of TMRM fluorescence fluctuations in MCF10A cells. Basal metabolism shows a dynamic picture of TMRM diffusion within a narrow measurement volume (typical size ~ 1µm) which changes drastically during glucose metabolism (20mM glucose stimulus) and mitochondrial complex I inhibition (40 minutes of 1µM rotenone treatment) conditions. (b) Detrended fluctuation analysis (DFA) of time-series data from multiple cells was performed to yield a log-log plot of fluctuations, F(n) and the window size (n) – as illustrated in (b). Scaling exponent (α) was computed as the slope of this scaling function F(n) ~ nα within the fitting range 0.5 < n < 2.5. (c) & (d) Summary of mean scaling exponents obtained from multiple (N ~20) time-series profiles in both normal and cancer cells pre-labeled with 200nM TMRM. For more details, see the main text.
Figure 5. Nonlinear scaling analysis of TMRM fluorescence fluctuations in isogenic HEK cells with mitochondrial dysfunction.
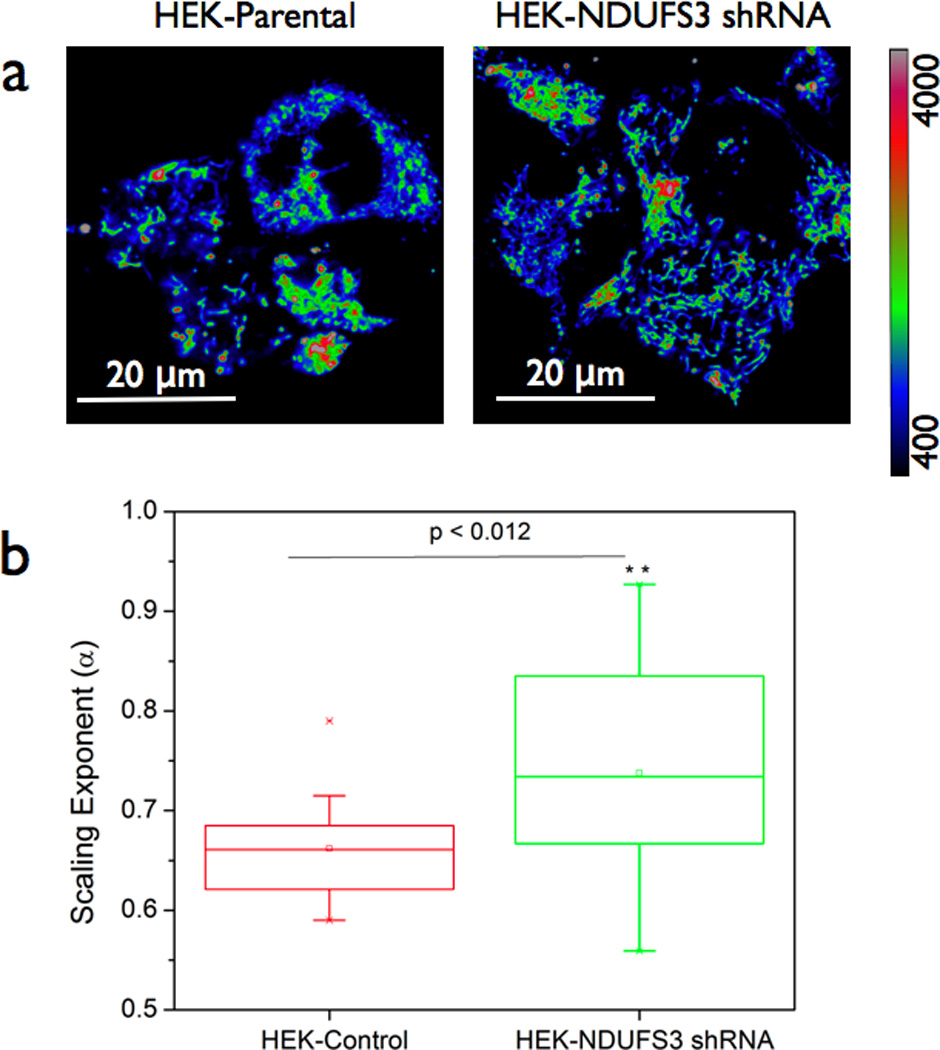
(a) Human embryonic kidney (HEK) parental cells and isogenic HEK cells with genetically altered NDUFS3 (a catalytic subunit of mitochondrial complex I) expression. Scale bars = 20 µm. The latter cells were previously shown to display significant mitochondrial dysfunction and altered metabolic characteristics as described in Reference [26]. Flow cytometry measurements of steady state mitochondrial membrane potential (TMRM fluorescence) in these cells did not show significant difference (data not shown). However scaling exponent α as calculated from the time-series data was significantly different (p < 0.012) in these two cell lines (b) suggesting that the observed differences in metabolic response dynamics has a more fundamental origin in mitochondrial metabolism.
4. Discussion
Metabolic disorders lie at the root of many disease phenotypes such as diabetes, cancer as well as age-related physiological decline. Strategies for real-time monitoring of metabolic dysfunction are valuable in early detection as well as in accurate assessment of therapeutic response of disease tissues. Towards this direction, we have described here a comprehensive strategy for monitoring metabolic responsiveness in single living cells. More specifically, we have demonstrated the usefulness of a mitochondrial membrane potential reporter (TMRM) beyond the traditional steady-state fluorescence imaging in rendering high content information on the various time-dynamics maps (milliseconds to seconds to minutes) of cellular metabolism. Comparison of steady-state kinetics of TMRM fluorescence in normal and breast cancer cell lines revealed that cancer cells displayed a statistically significant reduction in metabolic responsiveness as compared to the normal cells – despite the fact these two cell lines had nearly identical probe uptake and retention. We would like to point out the apparent differences in mitochondrial mass in these cell lines do not affect our interpretation since all the imaging results are analyzed at the single mitochondrial level and not at the single cell level. Cancer cells are known to display altered glucose metabolism and mitochondrial dysfunction. Real-time imaging of differential metabolism as shown in this study will be a valuable tool that can find applications in discriminating cancer cells and/or other cell types with mitochondrial defects in a population of multiple cell types. It is interesting to note that the altered metabolic responsiveness observed in cancer cells was retained at all time scales of our measurements namely, the steady state kinetics regime (~ seconds), FRAP regime (~ milliseconds) and nonlinear scaling regime (~ microseconds to milliseconds). Cancer cells investigated in this study showed significant reduction in fluorescence recovery time as well as in responsiveness under metabolic perturbations as shown by the scaling exponent analysis. Sensitivity to mitochondrial perturbations (e.g., rotenone in our case) is a measure of intact electron transport chain and hence integrity of mitochondrial function.[40] Scaling exponent (α) is a robust measure of time-correlated dynamics in cellular metabolic networks as demonstrated in our earlier studies. This is the first time we have applied this scaling analysis to mitochondrial membrane potential dynamics in living cells. The fact that the normal cells showed acute sensitivity to rotenone by reduction in scaling exponent as compared to the cancer cells is indicative of mitochondrial dysfunction in the latter. We also observed similar pattern in other breast cancer cell lines with mitochondrial defects (data not shown) thereby suggesting that these results are representative of a more fundamental mitochondrial origin than the type of cancer cell lines. This was further confirmed in cell lines with genetically defined mitochondrial dysfunction (NDUFS3 gene silencing, Figure 5). This observation opens an interesting avenue for the approaches described in this paper to find applicability in a variety of mitochondrial disorders as well as in metabolic diseases (such as diabetes, obesity) where mitochondrial dysfunction plays a critical role. Conventional high-through put screening methods may require large samples which may be difficult to obtain in surgical biopsies and primary cell isolates. Since our imaging approach requires only a small sample space without compromising the metabolic information, the combination of the three strategies could offer a potential solution to situations with small number of cells. Traditional time-resolved imaging/spectroscopy such as Fluorescence Lifetime imaging (FLIM) have been very successful in providing valuable molecular information.[17, 29, 41, 42] However these systems are expensive and require intensive hardware/software integration. In this context, we envision that the approaches described in this paper offer a quick, cost-effective and portable solutions for analyzing metabolic signatures in fresh tissue specimens.
Acknowledgements
The author gratefully acknowledges financial support from American Cancer Society (RSG-12-144-01-CCE), National Cancer Institute / National Institutes of Health (R21-CA124843), Komen for the Cure foundation (KG090239) and Donna & Jesse Garber Foundation. The author thanks Dr Bruce Gewertz and Dr Leon Fine for their intramural support and encouragement.
Footnotes
Publisher's Disclaimer: This is a PDF file of an unedited manuscript that has been accepted for publication. As a service to our customers we are providing this early version of the manuscript. The manuscript will undergo copyediting, typesetting, and review of the resulting proof before it is published in its final citable form. Please note that during the production process errors may be discovered which could affect the content, and all legal disclaimers that apply to the journal pertain.
References
- 1.Mahe E, Ara S, Bishara M, Kurian A, Tauqir S, Ursani N, Vasudev P, Aziz T, Ross C, Lytwyn A. Can J Surg. 2013;56:E13–E18. doi: 10.1503/cjs.011112. [DOI] [PMC free article] [PubMed] [Google Scholar]
- 2.Lichtman MA. Oncologist. 2012;17:586. doi: 10.1634/theoncologist.2012-0116. [DOI] [PMC free article] [PubMed] [Google Scholar]
- 3.Berney DM, Montironi R, Egevad L. Acta Oncol. 2011;50(Suppl 1):49–52. doi: 10.3109/0284186X.2010.525223. [DOI] [PubMed] [Google Scholar]
- 4.Nakhleh RE. Arch Pathol Lab Med. 2006;130:630–632. doi: 10.5858/2006-130-630-ERISP. [DOI] [PubMed] [Google Scholar]
- 5.Raab SS, Grzybicki DM, Zarbo RJ, Meier FA, Geyer SJ, Jensen C. Arch Pathol Lab Med. 2005;129:1246–1251. doi: 10.5858/2005-129-1246-APDAPS. [DOI] [PubMed] [Google Scholar]
- 6.Foucar E. Am J Clin Pathol. 2001;116(Suppl):S21–S33. doi: 10.1309/YUCA-HMEE-BKQ5-BH5B. [DOI] [PubMed] [Google Scholar]
- 7.Goldstein NS. Clin Lab Med. 1999;19:743–756. v. [PubMed] [Google Scholar]
- 8.Smallbone K, Gatenby RA, Maini PK. J Theor Biol. 2008;255:106–112. doi: 10.1016/j.jtbi.2008.08.002. [DOI] [PubMed] [Google Scholar]
- 9.Tennant DA, Duran RV, Boulahbel H, Gottlieb E. Carcinogenesis. 2009;30:1269–1280. doi: 10.1093/carcin/bgp070. [DOI] [PubMed] [Google Scholar]
- 10.Wallace DC. Science (New York, N.Y. 1999;283:1482–1488. doi: 10.1126/science.283.5407.1482. [DOI] [PubMed] [Google Scholar]
- 11.Wei AC, Aon MA, O'Rourke B, Winslow RL, Cortassa S. Biophys J. 2011;100:2894–2903. doi: 10.1016/j.bpj.2011.05.027. [DOI] [PMC free article] [PubMed] [Google Scholar]
- 12.Ramanujan VK, Biener-Ramanujan E, Armmer K, Centonze VE, Herman BA. Cytometry A. 2006;69:912–919. doi: 10.1002/cyto.a.20297. [DOI] [PubMed] [Google Scholar]
- 13.Ramanujan VK, Ren S, Park S, Farkas DL. J Cell Sci Therapy. 2010;1:102. doi: 10.4172/2157-7013.1000102. [DOI] [PMC free article] [PubMed] [Google Scholar]
- 14.Ramanujan VK, Zhang JH, Biener E, Herman B. Journal of biomedical optics. 2005;10:051407. doi: 10.1117/1.2098753. [DOI] [PubMed] [Google Scholar]
- 15.Eisenberg A, Biener E, Charlier M, Krishnan RV, Djiane J, Herman B, Gertler A. FEBS Lett. 2004;565:139–142. doi: 10.1016/j.febslet.2004.03.089. [DOI] [PubMed] [Google Scholar]
- 16.Herman B, Krishnan RV, Centonze VE. Methods Mol Biol. 2004;261:351–370. doi: 10.1385/1-59259-762-9:351. [DOI] [PubMed] [Google Scholar]
- 17.Krishnan RV, Masuda A, Centonze VE, Herman B. Journal of biomedical optics. 2003;8:362–367. doi: 10.1117/1.1577574. [DOI] [PubMed] [Google Scholar]
- 18.Suhane S, Ramanujan VK. Biochem Biophys Res Commun. 2011;414:73–78. doi: 10.1016/j.bbrc.2011.09.024. [DOI] [PMC free article] [PubMed] [Google Scholar]
- 19.Ramanujan VK, Biener G, Herman BA. Biophys J. 2006;90:L70–L72. doi: 10.1529/biophysj.106.083501. [DOI] [PMC free article] [PubMed] [Google Scholar]
- 20.Ramanujan VK, Herman BA. The Journal of biological chemistry. 2007;282:19217–19226. doi: 10.1074/jbc.M700572200. [DOI] [PubMed] [Google Scholar]
- 21.Perry SW, Norman JP, Barbieri J, Brown EB, Gelbard HA. Biotechniques. 2011;50:98–115. doi: 10.2144/000113610. [DOI] [PMC free article] [PubMed] [Google Scholar]
- 22.Scaduto RC, Jr, Grotyohann LW. Biophys J. 1999;76:469–477. doi: 10.1016/S0006-3495(99)77214-0. [DOI] [PMC free article] [PubMed] [Google Scholar]
- 23.Peng CK, Buldyrev SV, Goldberger AL, Havlin S, Mantegna RN, Simons M, Stanley HE. Physica A. 1995;221:180–192. doi: 10.1016/0378-4371(95)00247-5. [DOI] [PubMed] [Google Scholar]
- 24.Peng CK, Havlin S, Hausdorff JM, Mietus JE, Stanley HE, Goldberger AL. J Electrocardiol. 1995;28(Suppl):59–65. doi: 10.1016/s0022-0736(95)80017-4. [DOI] [PubMed] [Google Scholar]
- 25.Ramanujan VK, Herman BA. Journal of biomedical optics. 2008;13:031219. doi: 10.1117/1.2928154. [DOI] [PubMed] [Google Scholar]
- 26.Suhane S, Kanzaki H, Arumugaswami V, Murali R, Ramanujan VK. Biol Open. 2013;2:295–305. doi: 10.1242/bio.20133244. [DOI] [PMC free article] [PubMed] [Google Scholar]
- 27.Chance B. Biochem Soc Trans. 1994;22:983–987. doi: 10.1042/bst0220983. [DOI] [PubMed] [Google Scholar]
- 28.Warburg O. Science (New York, N.Y. 1956;123:309–314. doi: 10.1126/science.123.3191.309. [DOI] [PubMed] [Google Scholar]
- 29.Ramanujan VK, Jo JA, Cantu G, Herman BA. J Microsc. 2008;230:329–338. doi: 10.1111/j.1365-2818.2008.01991.x. [DOI] [PubMed] [Google Scholar]
- 30.Ishikawa-Ankerhold HC, Ankerhold R, Drummen GP. Molecules. 2012;17:4047–4132. doi: 10.3390/molecules17044047. [DOI] [PMC free article] [PubMed] [Google Scholar]
- 31.Hardingham T, Gribbon P. Methods Mol Biol. 2000;139:83–93. doi: 10.1385/1-59259-063-2:83. [DOI] [PubMed] [Google Scholar]
- 32.Sprague BL, McNally JG. Trends Cell Biol. 2005;15:84–91. doi: 10.1016/j.tcb.2004.12.001. [DOI] [PubMed] [Google Scholar]
- 33.Reits EA, Neefjes JJ. Nat Cell Biol. 2001;3:E145–E147. doi: 10.1038/35078615. [DOI] [PubMed] [Google Scholar]
- 34.Coscoy S, Waharte F, Gautreau A, Martin M, Louvard D, Mangeat P, Arpin M, Amblard F. Proc Natl Acad Sci U S A. 2002;99:12813–12818. doi: 10.1073/pnas.192084599. [DOI] [PMC free article] [PubMed] [Google Scholar]
- 35.James NG, Digman MA, Gratton E, Barylko B, Ding X, Albanesi JP, Goldberg MS, Jameson DM. Biophys J. 2012;102:L41–L43. doi: 10.1016/j.bpj.2012.04.046. [DOI] [PMC free article] [PubMed] [Google Scholar]
- 36.Kang M, Day CA, Kenworthy AK, DiBenedetto E. Traffic. 2012;13:1589–1600. doi: 10.1111/tra.12008. [DOI] [PMC free article] [PubMed] [Google Scholar]
- 37.Chen Z, Ivanov P, Hu K, Stanley HE. Phys Rev E Stat Nonlin Soft Matter Phys. 2002;65:041107. doi: 10.1103/PhysRevE.65.041107. [DOI] [PubMed] [Google Scholar]
- 38.Hu K, Ivanov PC, Chen Z, Carpena P, Stanley HE. Phys Rev E Stat Nonlin Soft Matter Phys. 2001;64:011114. doi: 10.1103/PhysRevE.64.011114. [DOI] [PubMed] [Google Scholar]
- 39.Xu L, Ivanov P, Hu K, Chen Z, Carbone A, Stanley HE. Phys Rev E Stat Nonlin Soft Matter Phys. 2005;71:051101. doi: 10.1103/PhysRevE.71.051101. [DOI] [PubMed] [Google Scholar]
- 40.Genova ML, Bovina C, Marchetti M, Pallotti F, Tietz C, Biagini G, Pugnaloni A, Viticchi C, Gorini A, Villa RF, Lenaz G. FEBS Lett. 1997;410:467–469. doi: 10.1016/s0014-5793(97)00638-8. [DOI] [PubMed] [Google Scholar]
- 41.Pande P, Trivedi CA, Jo JA. Methods Inf Med. 2010;49:531–536. doi: 10.3414/ME09-02-0046. [DOI] [PubMed] [Google Scholar]
- 42.Chen Y, Mills JD, Periasamy A. Differentiation. 2003;71:528–541. doi: 10.1111/j.1432-0436.2003.07109007.x. [DOI] [PubMed] [Google Scholar]