Abstract
Purpose
To develop and assess a 3D refocused TSE (rTSE) sequence for generating peripheral angiograms. This sequence combines the rapid T2-weighting of TSE and the better flow performance of the fully-refocused gradients of balanced SSFP, along with bSSFP-style phase alternation of refocusing RF pulses.
Materials and Methods
The signal behavior generated by such a sequence was explored through Bloch equation simulations. The rTSE and TSE sequences were both used to generate peripheral angiograms in nine normal volunteers. The SNR, contrast resolution, and vessel sharpness of the resulting images were used as bases for comparison. Additionally, the rTSE sequence was applied in four patients with PAD to preliminarily assess its efficacy in a clinical setting through quality scoring by 2 experienced radiologists.
Results
The rTSE’s RF phase alternation approach out-performs a simple balanced-gradient CPMG-style TSE sequence in the presence of B0 and B1 inhomogeneities. In volunteers, the rTSE sequence yielded better arterial-venous contrast (0.378 ± 0.145 vs. 0.155 ± 0.202 – p < 0.01) and increased vessel sharpness (0.340 ± 0.034 vs. 0.263 ± 0.034 – p < 0.005) over TSE images. Stenoses visible in conventional angiographic images in patients were successfully imaged with the rTSE sequence; however, image quality scores in patients were lower than in volunteers (1.2 ± 0.38 vs 3.0 ± 1.0 – p < 0.05).
Conclusion
The rTSE sequence generates non-subtractive, flow-independent, peripheral MR angiograms with better arterial-venous contrast and vessel sharpness in normal volunteers than a conventional TSE sequence.
Keywords: Non-contrast angiography, peripheral angiography, flow-independent angiography, MR angiography, vascular disease
Introduction
Peripheral arterial disease (PAD) is defined as atherosclerosis in the arteries of the pelvis and legs and is associated with symptoms ranging from cramping and pain during exercise to rest pain and tissue loss (1). PAD affects approximately 8 million Americans (2) and, if left untreated, can lead to gangrene and amputation (1). For diagnosis of luminal obstruction, MR angiography (MRA) has been used, which does not expose the patient to ionizing radiation, is noninvasive, and thus has been considered safe.
Contrast-enhanced MRA is currently the preferred MRA technique in this setting (3, 4); however, the recently established link between the gadolinium-based contrast agents and nephrogenic systemic fibrosis (NSF) (5, 6) in patients with Stage IV/V chronic kidney disease has led to tighter contrast dose limits and interest in developing MR methods by which accurate, high-resolution images of the arteries may be obtained without the use of contrast agents.
Several types of non-contrast MRA methods have been investigated for the peripheral arterial system. Time-of-flight (7) and phase contrast angiography (8) rely on the fact that blood is moving relative to surrounding, stationary background signal in order to generate contrast; however, these methods may fail in the lower extremities where a wide range of blood velocities and vessel geometries exist (9). The recent QISS technique is a promising new method that utilizes an inversion pulse in order to improve background suppression and obtain good arterial contrast (10). However, because it also relies on arterial inflow, it may be susceptible to signal loss in the presence of complex flow and vessel orientation. Flow-spoiled techniques utilize systolic- and diastolic-phase acquisitions and a subsequent image subtraction operation to generate contrast between arteries and surrounding tissues (11, 12). These methods must be tailored to each patient and each station, as the amount of flow-spoiling must be adjusted depending on arterial flow rate.
Flow-independent angiography (FIA) was first investigated as a method by which the intrinsic tissue properties of blood could be used to generate contrast, rather than its flow properties (13–16). As such, regions of slow, in-plane, and retrograde flow often found in patients may be imaged. Blood has a long T1 and a variable T2, depending on its oxygenation status (17); blood-muscle and arterial-venous contrast is therefore obtained primarily via T2-weighting of the images.
By sorting later echoes into the center of k-space, TSE sequences are capable of rapid T2-weighted imaging without the need for complex preparatory pulses; however, conventional TSE sequences have a non-zero first gradient moment at the RF pulses and at odd echoes in order to satisfy the CPMG conditions, and are therefore susceptible to flow-related artifacts and signal loss (18). This sensitivity to motion makes these sequences unsuitable for applications involving flowing spins. Conversely, bSSFP sequences have been shown to have good motion insensitivity (19) and have been used for FIA. Conceptually, a bSSFP sequence run with 180° RF pulses is identical to a TSE sequence with balanced inter-pulse gradients and phase alternation of the RF pulses. We hypothesize that such a hybrid sequence will be capable of rapidly acquiring angiographic data. A similar version of this hybrid sequence has been applied for T2-weighted imaging of edema, but not for MRA (20).
The purpose of this work, therefore, was to develop a novel 3D refocused TSE (rTSE) sequence for generating peripheral angiograms, to explore the signal behavior generated by such a sequence, and to assess the efficacy of such a sequence in normal volunteers and in patients with PAD.
Methods
Sequence
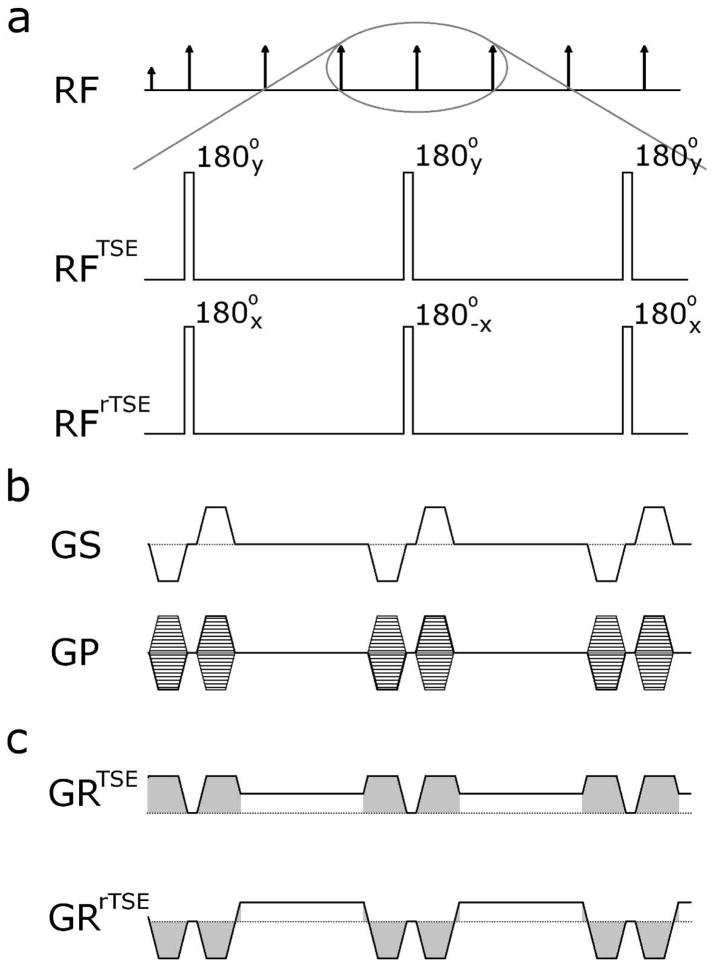
The proposed sequence is a single-slab, large field-of-view 3D TSE sequence. In Figure 1, the traditional implementation of such a sequence is compared to the proposed rTSE sequence. The standard TSE sequence’s RF pulses follow a 90°x-(180°y-180°y-) phase condition while the rTSE sequence utilizes phase cycled pulses: 90°x-(180°−x-180°x-). All RF pulses used in this work are non-selective; however, slab-selectivity may be obtained by using a slab-selective excitation pulse, if so desired. Within each inter-pulse period (here out called echo spacing), the readout gradient of the rTSE sequence is modified such that the first gradient moment returns to zero prior to the application of the next RF pulse. This is in contrast to the TSE sequence, in which crusher gradients are applied on the readout axis. While further moment nulling techniques are available to ensure the first gradient moment is also zero at the center of the echo, prior studies have shown good flow insensitivity using only zeroth-order moment nulling (21).
Figure 1.
Pulse sequence diagrams. (a) The traditional TSE pulse sequence utilizes a CPMG phase condition for all RF pulses in the echo train, whereas the rTSE sequence uses a phase-alternating approach in the same manner as bSSFP sequences. In this single-slab sequence, all RF pulses are non-selective. (b) The two phase encoding dimensions are encoded identically between the two sequences. (c) The readout gradient of the TSE sequence incorporates crusher gradients (shaded in gray), ensuring FID and stimulated echo signals are suppressed. In contrast, the readout gradient is fully rewound within each echo spacing in the rTSE sequence using pre-phasing and re-phasing lobes (shaded in gray).
Rationale for RF Phase Alternation
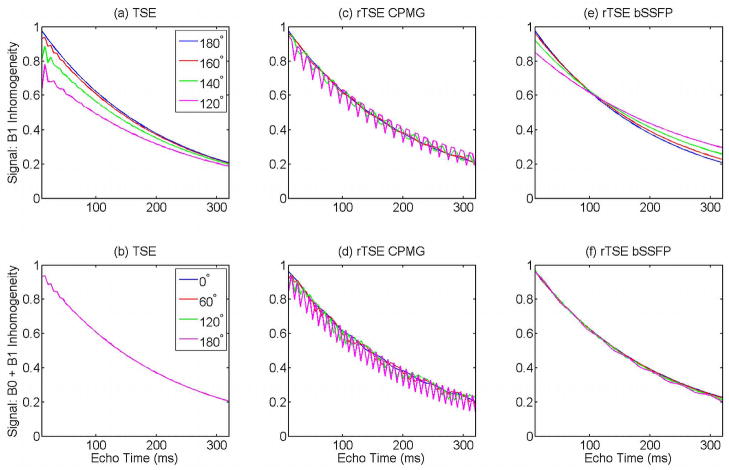
Because the rTSE sequence is conceptually equivalent to a 180°-α-pulse-bSSFP sequence, we hypothesized that a phase-alternated RF approach would perform better in the presence of inhomogeneity than the CPMG phase condition. To assess this, Bloch equation simulations were performed to explore three TSE sequence variants’ performance in the presence of B1 and B0 non-idealities. Simulations were performed with a traditional TSE sequence with CPMG RF phases, an rTSE sequence with CPMG RF phases, and an rTSE sequence with bSSFP-style RF phases. B1 inhomogeneity was simulated by a 64-echo spin-echo train with 120°, 140°, 160°, and 180° refocusing RF pulses (with no off-resonance). B0 inhomogeneity was simulated with a 64-echo spin-echo train with 0°, 60°, 120°, and 180° phase accrual during each echo-spacing with RF flip angle 160° (without B1 inhomogeneity, B0 inhomogeneity has no effect on the signal). For all simulations, echo spacing = 5 ms, T1 = 2000 ms, T2 = 200 ms; a rough approximation of blood signal and a reasonable value for echo spacing.
Background Tissue Description and Suppression
In angiography, positive contrast is required between arterial blood and all other tissues, which, in the leg, can broadly be classified as either muscle or fat. (Extravascular fluid may be ignored in some cases, or may be easily suppressed by a long-TI inversion pulse.) In FIA, we must also be concerned with generating contrast between arterial and venous blood, since there is no spatiotemporal dependence on blood contrast as in contrast-enhanced angiography or time-of-flight methods.
To identify optimal echo times and explore the impact that different echo spacings have for background suppression, Bloch equation simulations were performed to assess signal evolutions for arterial blood, venous blood, muscle, and fat during an rTSE echo train. For these simulations, arterial and venous effective T2 was estimated using the Luz-Meiboom model, which describes T2 relaxation in the presence of rapid refocusing (as occurs during a TSE echo train) for a two-compartment model (13, 22). In short, this model states that as the percent oxygenation decreases or the echo spacing of the refocusing pulses increases, the apparent T2 of blood becomes shorter. This phenomenon is the source of artery-vein contrast in FIA. For these simulations, the T1 of blood was 2000 ms while the T2 varied depending on echo spacing and simulated blood oxygenation level. Muscle was simulated with T1/T2 values of 1400/30 ms, and fat was simulated with T1/T2 values of 300/120 ms. Echo spacings of 3, 4, and 5 ms were simulated, as echo spacings of this order are common with typical gradient requirements and readout bandwidths used.
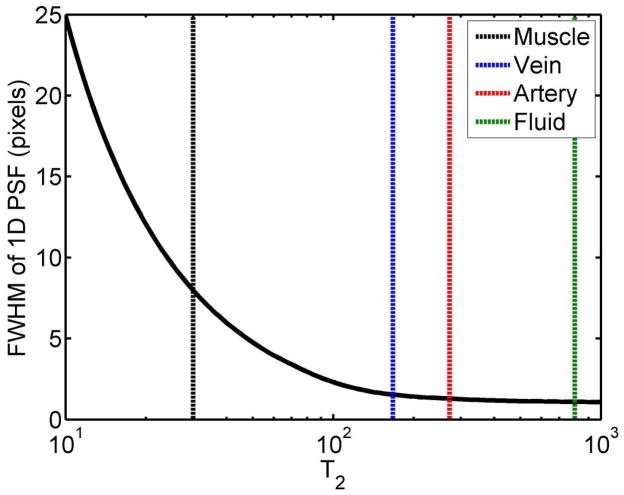
One of the potential downsides of this technique is that, by utilizing long echo trains with late echo times in order to provide T2-weighted contrast for bright-blood imaging, T2-decay-induced signal modulation may result in blurring of vessel signal in the phase-encoding direction. To assess this effect, a 1D point-spread-function simulation was performed with T2 decay values ranging from 10 to 1000 ms. The FWHMs of the resulting PSFs were compared as a measure of anticipated blur due to T2 decay during the echo train. (Implicit in this simulation was the assumption that k-space is phase-encoded linearly, with the center of k-space acquired at the center of the echo train.) In order to assess each tissue’s anticipated blur, the simulated curve was sampled at T2 = 30 ms for muscle signal, 167 ms for venous signal (corresponding to an oxygenation level of 70% with an echo spacing of 4 ms), 272 ms for arterial signal (95% oxygenation; 4 ms echo spacing), and 800 ms for synovial fluid.
In vivo experiments
In order to compare the rTSE and TSE sequences, nine healthy volunteers (5 male, mean age 24.0 +/− 1.7) with no symptoms of cardiovascular disease were examined. Additionally, four patients (2 male, age 65.5 +/− 9.0) who were scheduled for peripheral runoff examinations were scanned to assess the viability of the sequence in a clinical setting (2 patients received contrast-enhanced MRA; 2 received 2D time-of-flight imaging). The protocol was approved by the Institutional Review Board at our institution and all participants gave written informed consent.
For volunteers, the scan protocol consisted of the acquisition of a 3D dataset with a standard TSE sequence, followed immediately by a dataset using the rTSE sequence. In 2 volunteers, a three-station protocol was implemented covering the arterial tree from the pelvis to the ankle. In 1 volunteer, only the thigh and calf stations were obtained, and in all other volunteers, only the thigh station was acquired. Scans were conducted on a Siemens 3.0-T Trio scanner (Siemens Medical Solutions) with a TR = 3000 ms and TE = 230 ms. Echo spacing = 3.44 ms, resolution 1.4 × 1.4 × 1.5 mm3, refocusing flip-angle 180°, acquisition time 5.38 +/− 0.5 minutes per station and a chemical fat saturation pulse was applied prior to each excitation pulse. Peripheral MRA coils placed anteriorly and laterally and a spine coil placed posteriorly were used for imaging. In one volunteer, four datasets were acquired with echo times of 150, 200, 230, and 275 ms for comparison with the vessel contrast simulation discussed previously. Three regions of interest (ROIs) per echo time were drawn in the upper, middle, and lower portions of the imaging volume, as will be discussed shortly.
In patient scans, prior to a standard ceMRA or 2D TOF scan, three stations were acquired in each patient using the rTSE pulse sequence in the same manner described above, covering the vasculature from the aortic bifurcation to the ankle, except in one patient who was unable to tolerate the procedure and was excluded from analysis. The conventional TSE sequence was not included in the patient protocol due to time constraints.
Image quality was compared based on signal-to-noise ratio (SNR), vessel contrast resolution, and arterial vessel sharpness of transverse images across the 3D volume in the thigh station of all subjects. All analyses were performed using axial images from the 3D volumetric data. Contrast resolution was calculated as the difference in signal intensity values between the femoral artery and vein divided by the sum of these intensity values. Arterial sharpness was quantified by calculating the two-dimensional magnitude of the image gradient and recording the maximum gradient across the femoral artery at 3 locations and orientations. The average maximum gradient value from these measurements was taken as an overall measure of vessel sharpness in the image. Differences between groups were assessed with a two-tailed paired (for TSE versus rTSE data from volunteers) or unpaired (for patient versus volunteer rTSE data) t-test with a p-value of 0.05 considered to be significant.
Two board-certified radiologists (K.D.H. 20 years experience; P.T.N. 7 years experience) consensus-scored all rTSE stations (volunteers and patients) to evaluate the diagnostic utility of the sequence for visualization of vessel occlusion, with particular attention paid to artifacts impeding artery visualization arising from venous, fat, or fluid contamination as well as residual ghosting artifacts. Consensus-scoring involved the radiologists assigning a single score to each station after viewing and discussing the images together. Both MIP images as well as coronal and axial slices through the imaging volume were used for assessment. A scale of 1–4 was used with the following code: 1 – No artifact, 2 – Artifact present, but not limiting diagnostic quality, 3 – Severe artifact preventing quantification of stenosis but enabling occlusion detection, 4 – Non-diagnostic. The proximal 3 cm of each image volume was excluded from analysis due to low signal. Differences in mean ratings of diagnostic quality for each station, and overall, between volunteers and patients were assessed with a two-tailed unpaired t-test with a p-value of 0.05 considered to be significant.
Results
Figure 2 demonstrates the improved performance of the rTSE sequence when bSSFP-style phase alternation of the RF pulses is used. The standard TSE sequence displays the expected resistance to B1 and B0 inhomogeneities due largely to the presence of crusher gradients, which select the spin-echo and remove Free Induction Decay (FID) and stimulated echo components from the acquired signal. Without these crusher gradients, the sequence strongly resembles a bSSFP sequence, and bSSFP-style phase alternation of the RF pulses results in better resistance to inhomogeneities than traditional CPMG-style phases, demonstrated by the smoother signal decay curves in Fig. 2.
Figure 2.
Bloch equation simulations for the standard TSE sequence (a,b), a refocused-gradient TSE sequence with CPMG-style RF phase prescription (c,d), and a refocused-gradient TSE sequence with bSSFP-style RF phase prescription (e,f). Top row shows the sequence variants’ response to B1 inhomogeneity; Bottom row shows response to combined B0 and B1 inhomogeneity.
Muscle has a short T2 (around 30 ms at 3.0 T), so any choice of TE longer than about 80 ms yields good muscle suppression (Fig. 3). Venous T2 is dependent on oxygen status and echo spacing (16); Figure 3 also shows artery-vein contrast for venous blood across a range of oxygenation states. As venous oxygenation increases, the difference between arterial and venous oxygenation becomes smaller, and less contrast is observable between the two; however, choosing a long TE (180–230 ms) with typical echo spacings of 3–5 ms generally results in discernible contrast between arteries and veins.
Figure 3.

Artery-muscle and artery-vein contrast as a function of echo spacing and echo time in a multi spin-echo sequence. Echo spacings simulated were a) 3 ms, b) 4 ms, c) 5 ms. Artery signal was simulated using an oxygenation value of 95%; venous oxygenation is indicated in the figure legend (e.g. Vein70 indicates 70% venous oxygenation). As venous oxygenation increases, maximum contrast decreases and moves to later echo times; likewise, as echo spacing decreases, maximum contrast decreases for a given venous oxygenation level.
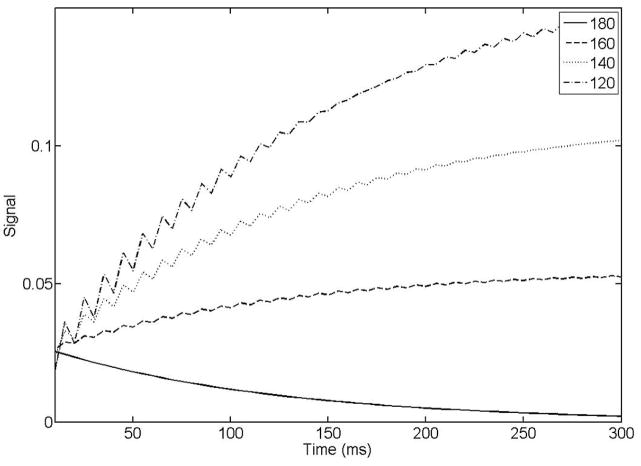
As has been mentioned previously, the rTSE sequence is conceptually identical to a bSSFP sequence run with 180° α pulses. A consequence of this is that any spins that experience a less-than-perfect refocusing pulse due to B1 inhomogeneity will behave as if they were in the transition period of a high-flip-angle bSSFP sequence. Fat, in particular is susceptible to this effect due to its short T1, as imperfect refocusing pulses will have a relatively large amount of regrown longitudinal magnetization to act upon. Figure 4 shows Bloch simulations for fat that has been nearly completely suppressed prior to the 90° excitation pulse with a chemically selective saturation pulse. As B1 inhomogeneity increases, fat signal rises to higher values as it approaches a steady state.
Figure 4.
Fat signal as a function of echo time in the rTSE sequence. As B1 inhomogeneity increases, fat signal rises from an initially suppressed state towards its steady-state value, determined from the particular flip angle it experiences and its specific off-resonance. Numbers in figure legend indicate the refocusing flip angle simulated (i.e. degree of B1 inhomogeneity).
In Fig. 5, 1D simulations of T2-induced blurring show that the FWHM values of venous, arterial, and synovial fluid signal are increased by 55%, 29%, and 9%, respectively in the phase-encoding direction. For muscle, the large amount of anticipated blur is mitigated by the fact that the signal is nearly completely gone by the typical echo times used in this study.
Figure 5.
T2-induced blur in a long echo-train TSE sequence. For muscle, the large amount of anticipated blur is mitigated by the fact that the signal is nearly completely gone by the typical echo times used in this study. The FWHM for venous, arterial, and fluid signal based on these simulations are: 1.55, 1.29, and 1.09 pixels respectively.
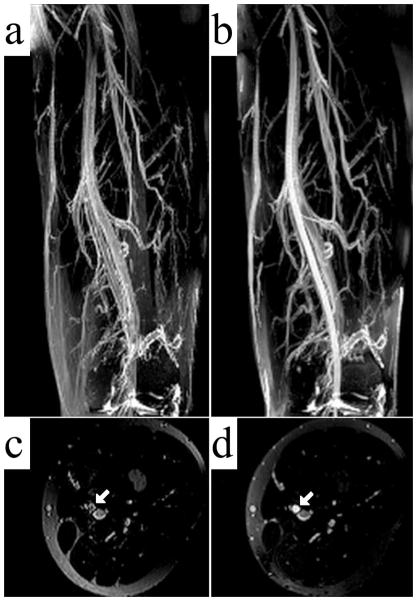
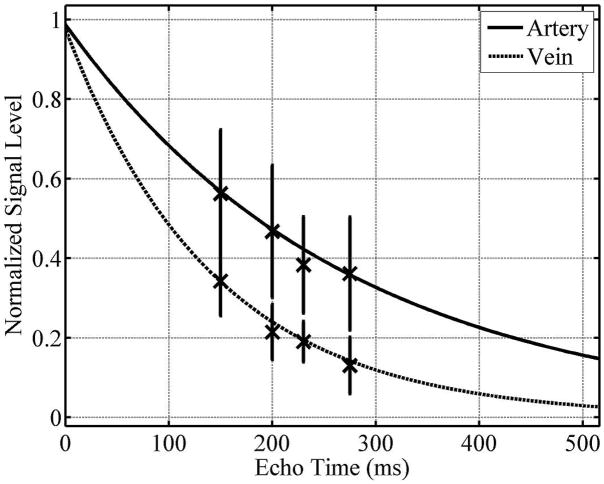
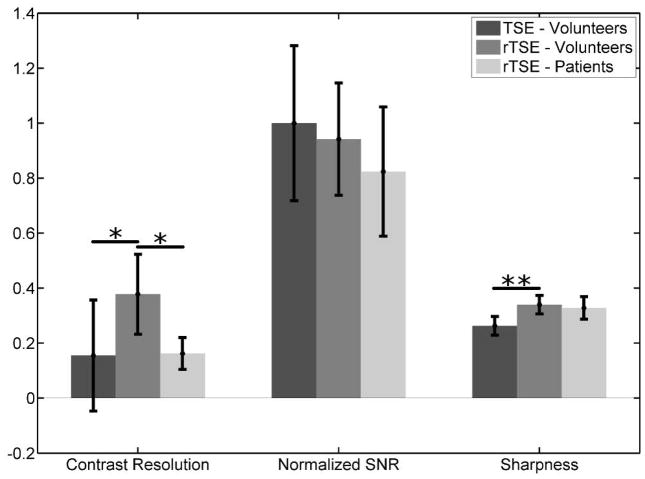
Figure 6 demonstrates that the incorporation of the changes outlined above into a traditional, Cartesian TSE scan results in angiograms with good artery/vein delineation and good muscle suppression. The femoral artery appears much brighter and sharper in the rTSE image (Fig. 6b,d) than in the TSE image (Fig. 6a,c). Furthermore, ghosting artifacts arising from the TSE sequence due to pulsatile motion are visible in the 3D phase encoding direction (anterior-posterior) in Fig. 6c. These ghosts are removed in the rTSE image. Figure 7 shows simulation results across a range of echo times for arterial and venous signal using the Luz-Meiboom model. Overlaid on the solid line of simulation data are data points taken from axial ROIs in the femoral artery and vein from a normal, female volunteer at different echo times, showing good agreement with simulated data. Although the SNR was similar compared to the traditional, spoiled TSE technique, the contrast and vessel sharpness were both improved using the rTSE sequence in volunteers (Fig. 8). However, as expected from simulations, fat signal is less uniform in the rTSE image compared to TSE; it appears brighter in some areas and darker in others as the robustness of fat suppression and B1 homogeneity vary over the imaging volume.
Figure 6.
Coronal MIPs of the thigh station of a normal volunteer TSE (a), and rTSE (b) scans. Axial reformats of the imaging volume are shown in (c) and (d) for the TSE and rTSE scans, respectively, with solid arrows marking the superficial femoral artery.
Figure 7.
Simulated arterial and venous signals as a function of echo time. Experimental data from a female volunteer closely matches the simulated signals. Maximum contrast between arteries and veins is developed at 230 ms for the echo spacings used in this experiment.
Figure 8.
Contrast resolution, SNR, and vessel sharpness comparisons between TSE and rTSE pulse sequences for volunteers and patients. SNR was similar between sequences, but for volunteers, rTSE had significantly better contrast resolution and vessel sharpness. Normalized contrast resolution 0.155±0.202 for TSE vs. 0.378±0.145 for rTSE - p < 0.01 (*); sharpness 0.263±0.034 for TSE vs. 0.340±0.034 for rTSE - p < 0.005 (**). When comparing between volunteers and patients, artery-vein contrast was significantly lower in patients as compared to volunteers. SNR and vessel sharpness were comparable between the two groups. Normalized contrast resolution 0.165±0.062 for patients vs. 0.378±0.145 for volunteers - p < 0.01 (*).
Figure 9 demonstrates use of the rTSE sequence in the calf station of a normal volunteer. Excellent artery-background contrast is obtained in most areas.
Figure 9.
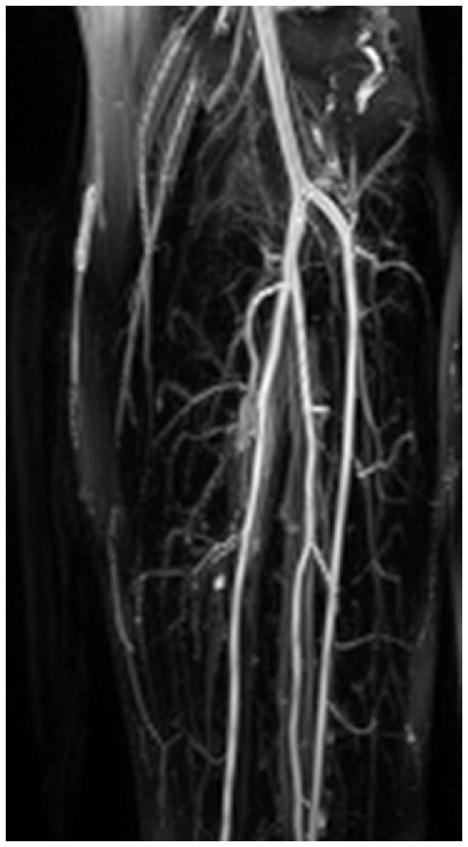
Coronal MIP of the left-calf station of a normal volunteer rTSE scan.
Figure 10 demonstrates the effectiveness of the Cartesian rTSE scan in detecting irregularities in patients. Abdominal-station obstructions were more difficult to identify due to wrap-around artifacts caused by large patient size. However, in the thigh station, the rTSE sequence (Fig. 10b,d) was able to successfully image atherosclerotic plaques detected by conventional angiographic methods (Fig. 10a,c). Although rTSE arterial-venous contrast in patients was less than that measured in normal volunteers (Fig. 8), the SNR and vessel sharpness in the patient images were similar to those in the volunteers.
Figure 10.
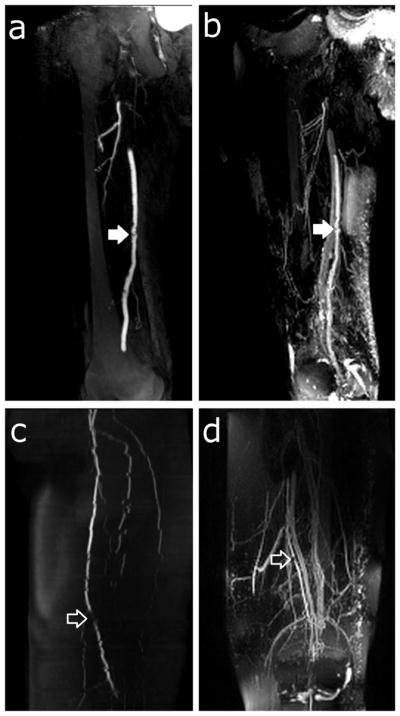
Patient thin-MIPs comparing rTSE with conventional angiographic methods. a) Right leg thigh-station ceMRA of a 76 year-old male with claudication. b) rTSE MIP in the same patient. There is an irregular atherosclerotic plaque on the superficial femoral artery (closed arrow). c) Left leg thigh-station 2D TOF MRA and (d) rTSE MIP of the thigh station of a 76 year-old female. There is a focal stenosis of the superficial femoral artery (open arrow). Also note the jagged edges of the arteries in the 2D TOF MRA resulting from patient motion during the image acquisition.
Average diagnostic quality scores are reported in Table 1. The major causes of low quality in the patient group were metal artifacts due to surgical clips, incomplete fat suppression, low signal, wrap around artifacts due to large patient size, and presence of edema.
Table 1.
Diagnostic quality scores of the rTSE sequence. Scores reported are mean ± standard deviation with the number of datasets scored in parentheses. p < 0.05 (*)
| Abdomen | Thigh | Calf | Total* | |
|---|---|---|---|---|
| Volunteers | 1.5 ± 0.71 (2) | 1.1 ± 0.33 (9) | 1.0 ± 0.0 (2) | 1.2 ± 0.38 (13) |
| Patients | 3.0 ± 1.0 (3) | 2.7 ± 1.2 (3) | 3.3 ± 1.2 (3) | 3.0 ± 1.0 (9) |
Discussion
The use of balanced gradients and RF-pulse phase alternation in a TSE sequence resulted in images with comparable SNR, but higher contrast resolution and vessel sharpness, than those generated without the use of balanced gradients. The rTSE sequence can be thought of as either a balanced-gradient TSE sequence, or equivalently as a high-flip-angle bSSFP sequence wherein data acquisition takes place prior to the formation of steady-state; both frames of thought can provide insight to the sequence. For example, by catalyzing the rTSE sequence with a ramped series of RF pulses, bSSFP-style phase detection can be used to separate water and fat images, albeit with poor artery-vein differentiation due to minimal echo spacings required in that instance (23).
That said, the rTSE sequence differs from bSSFP sequences in several important respects. First, 180° refocusing pulses provide a large echo signal level and allow T2-weighting to be easily achieved for artery-muscle contrast similar to that of a traditional TSE sequence without additional T2-preparattion pulses. Second, because much of the imaging is carried out during the initial transient, the well-known bSSFP banding artifact is largely avoided for spins that receive approximately a 180° refocusing pulse (i.e., water). Furthermore, gating strategies necessary for other vascular beds can be more naturally applied in TSE imaging, though the transient nature of magnetization preparation already results in a necessary interruption of the signal in bSSFP FIA imaging (16), mitigating this issue somewhat.
Blurring due to T2-decay during the echo train is a potential limitation of this sequence. Simulations show that a ~35% reduction in arterial resolution may be expected in the phase-encoding dimension (left-right). Variable flip angle schemes have been developed in order to address this effect by shaping the signal evolution of long echo train sequences through variable RF pulse flip angles. This technique cannot be applied in this situation, as the variable flip angle methods require strong crusher gradients to diphase FID signal arising from non-180° pulses. One potential solution to this problem is to simply acquire more phase encoding lines such that the T2-decay-induced blurring would bring the overall resolution in-line with the acquired resolutions in the readout and through-plane directions.
Patient SNR and vessel sharpness values were similar to those obtained in normal volunteers; however, a statistically significant reduction in contrast resolution was observed. This may be attributed to decreased arterial oxygenation in patients, or to increased venous T2 due to decreased oxygen consumption by the associated tissue in PAD. In either case, the TE of 230 ms was determined from a set of healthy data (along with a model) and may not be the optimal choice for the reduced oxygenation difference between arteries and veins found in patients. The Luz-Meiboom model indicates that higher field-strength is desirable to decrease venous T2 (17, 22). In our experience, a 30% improvement in arterial-venous contrast is achieved by performing these studies at 3.0 T, rather than at 1.5 T, but comes at a cost of increased inhomogeneity and safety concerns due to the power deposition of multiple, lengthy echo trains in a 3D sequence. However, adaptation of the protocol to satisfy SAR limits by increasing the TR was only necessary in 2 volunteers.
The Luz-Meiboom model is helpful in examining other ways to improve the artery-vein contrast and indicates that, in addition to allowing for higher resolution images, longer echo spacings are desirable to increase contrast in the final images (17, 22, 24). However, lengthening the echo spacing in our current Cartesian rTSE sequence has a negative impact on scan time due to acquisition segmentation which is necessary in order to restrict echo train lengths to reasonable durations. In order to achieve extended echo spacings while maintaining reasonable scan times, spiral readout gradients could be used to more efficiently sample k-space, as they can acquire a similar amount of data in far fewer readout periods (25). Furthermore, spiral gradients are naturally resistant to artifacts due to flow and motion, making them excellent candidates for a sequence wherein blood motion must be neglected.
The low diagnostic quality scores reported in patients was mainly due to low signal, incomplete fat suppression, wrap around artifacts due to large patient size, and presence of edema. The proximal 3 cm of each image volume was excluded from analysis due to low signal. The precise cause of this low signal is unknown. It was present in both patients and volunteers, indicating it is likely not a flow effect. However, this artifact may be easily overcome by overlapping the acquired imaging slabs.
Bright fat in TSE images is a well-documented phenomenon and is due to T2 lengthening via the removal of J-coupling-induced dephasing by rapidly-applied refocusing pulses (26). In addition to this, fat appears less uniform, and in some areas brighter, in rTSE images compared to TSE images despite the use of fat saturation prepulses. This is due to FID and subsequent stimulated-echo components from imperfect refocusing pulses entering the echo train, and a more robust suppression of this signal by the traditional, unbalanced TSE gradient scheme. Dephasing this signal (which occurs naturally in a traditional TSE pulse sequence due to non-zero gradient moments) attenuates it by the time the center of k space is sampled (18). The rTSE sequence, by nature of its balanced gradients, does not suppress this incidental fat signal, which will have a variable strength when the k = 0 line is acquired dependent on its particular precessional frequency and the refocusing flip angle it experiences.
Wrap-around artifacts caused by large patient size (relative to slab-thickness) can be addressed by reducing anterior-posterior resolution, increasing scan time, or utilizing slab-selective RF pulses.
As in all T2-weighted FIA imaging, synovial fluid appears bright in images generated by the rTSE sequence. While they were not explored here, inversion preparation pulses can be used to reduce the signal from synovial fluid as well as the long-T2 edematous fluid often seen in patients, at the cost of reduced overall signal (14).
In conclusion, the rTSE sequence is capable of rapidly generating noncontrast angiograms of the periphery without a subtraction operation by exploiting the rapid T2-weighted imaging capability of the TSE sequence, while maintaining flow insensitivity provided by balanced-gradient imaging. The peripheral MRA images obtained with rTSE are sharper and have better arterial-venous contrast than those obtained with a traditional TSE sequence. Current limitations of this technique include limited artery-vein contrast, high signal of synovial and edematous fluid, and incomplete fat suppression. Despite these limitations and a reduction in arterial-venous contrast resulting in poor diagnostic quality scores, the preliminary results in patients are encouraging, as several stenotic sections identified using established MRA methods were clearly visible on rTSE images of the mid-thigh. However, as this is an initial proof-of-concept study with a limited number of patients, further refinement and validation of the sequence is needed in order to determine its clinical role.
Acknowledgments
Grant support: NIH R01 HL079110, NIH T32 HL007284-33, NIH R01 HL 075792, AHA Predoctoral Fellowship (SWF), Siemens Medical Solutions
References
- 1.Ouriel K. Peripheral arterial disease. Lancet. 2001 Oct;358(9289):1257–1264. doi: 10.1016/S0140-6736(01)06351-6. [DOI] [PubMed] [Google Scholar]
- 2.Roger VL, Go AS, Lloyd-Jones DM, Adams RJ, Berry JD, Brown TM, et al. Heart disease and stroke statistics – 2011 update: a report from the American Heart Association. Circulation. 2011 Feb;123(4):e18–e209. doi: 10.1161/CIR.0b013e3182009701. [DOI] [PMC free article] [PubMed] [Google Scholar]
- 3.Lakshminarayan R, Simpson JO, Ettles DF. Magnetic resonance angiography: current status in the planning and follow-up of endovascular treatment in lower-limb arterial disease. Cardiovasc Intervent Radiol. 2009 May;32(3):397–405. doi: 10.1007/s00270-008-9467-5. [DOI] [PubMed] [Google Scholar]
- 4.Hadizadeh DR, Gieseke J, Lohmaier SH, Wilhelm K, Boschewitz J, Verrel F, et al. Peripheral MR angiography with blood pool contrast agent: prospective intraindividual comparative study of high-spatial-resolution steady-state MR angiography versus standard-resolution first-pass MR angiography and DSA. Radiology. 2008 Nov;249(2):701–711. doi: 10.1148/radiol.2492072033. [DOI] [PubMed] [Google Scholar]
- 5.Thomsen HS. Nephrogenic systemic fibrosis: A serious late adverse reaction to gadodiamide. Eur Radiol. 2006 Dec;16(12):2619–2621. doi: 10.1007/s00330-006-0495-8. [DOI] [PMC free article] [PubMed] [Google Scholar]
- 6.Weinreb JC, Abu-Alfa AK. Gadolinium-based contrast agents and nephrogenic systemic fibrosis: why did it happen and what have we learned? J Magn Reson Imaging. 2009 Dec;30(6):1236–1239. doi: 10.1002/jmri.21979. [DOI] [PubMed] [Google Scholar]
- 7.Axel L. Blood flow effects in magnetic resonance imaging. Magn Reson Annu. 1986:237–244. [PubMed] [Google Scholar]
- 8.Reimer P, Boos M. Phase-contrast MR angiography of peripheral arteries: technique and clinical application. Eur Radiol. 1999;9(1):122–127. doi: 10.1007/s003300050642. [DOI] [PubMed] [Google Scholar]
- 9.Steinberg FL, Yucel EK, Dumoulin CL, Souza SP. Peripheral vascular and abdominal applications of MR flow imaging techniques. Magn Reson Med. 1990 May;14(2):315–320. doi: 10.1002/mrm.1910140216. [DOI] [PubMed] [Google Scholar]
- 10.Edelman RR, Sheehan JJ, Dunkle E, Schindler N, Carr J, Koktzoglou I. Quiescent-interval single-shot unenhanced magnetic resonance angiography of peripheral vascular disease: technical considerations and clinical feasibility. Magn Reson Med. 2010 Apr;63(4):951–958. doi: 10.1002/mrm.22287. [DOI] [PMC free article] [PubMed] [Google Scholar]
- 11.Miyazaki M, Sugiura S, Tateishi F, Wada H, Kassai Y, Abe H. Non-contrast-enhanced MR angiography using 3D ECG-synchronized half-Fourier fast spin echo. J Magn Reson Imaging. 2000 Nov;12(5):776–783. doi: 10.1002/1522-2586(200011)12:5<776::aid-jmri17>3.0.co;2-x. [DOI] [PubMed] [Google Scholar]
- 12.Fan Z, Sheehan J, Bi X, Liu X, Carr J, Li D. 3D noncontrast MR angiography of the distal lower extremities using flow-sensitive dephasing (FSD)-prepared balanced SSFP. Magn Reson Med. 2009 Dec;62(6):1523–1532. doi: 10.1002/mrm.22142. [DOI] [PMC free article] [PubMed] [Google Scholar]
- 13.Wright GA, Nishimura DG, Macovski A. Flow-independent magnetic resonance projection angiography. Magn Reson Med. 1991 Jan;17(1):126–140. doi: 10.1002/mrm.1910170117. [DOI] [PubMed] [Google Scholar]
- 14.Brittain JH, Olcott EW, Szuba A, Gold GE, Wright GA, Irarrazaval P, et al. Three-dimensional ow-independent peripheral angiography. Magn Reson Med. 1997 Sep;38(3):343–354. doi: 10.1002/mrm.1910380302. [DOI] [PubMed] [Google Scholar]
- 15.Brittain JH, Hu BS, Wright GA, Meyer CH, Macovski A, Nishimura DG. Coronary angiography with magnetization-prepared T2 contrast. Magn Reson Med. 1995 May;33(5):689–696. doi: 10.1002/mrm.1910330515. [DOI] [PubMed] [Google Scholar]
- 16.Cukur T, Lee JH, Bangerter NK, Hargreaves BA, Nishimura DG. Non-contrast-enhanced ow-independent peripheral MR angiography with balanced SSFP. Magn Reson Med. 2009 Jun;61(6):1533–1539. doi: 10.1002/mrm.21921. [DOI] [PMC free article] [PubMed] [Google Scholar]
- 17.Wright GA, Hu BS, Macovski A. Estimating oxygen saturation of blood in vivo with MR imaging at 1.5 T. J Magn Reson Imaging. 1991 May-Jun;1(3):275–283. doi: 10.1002/jmri.1880010303. [DOI] [PubMed] [Google Scholar]
- 18.Bernstein MA, King KF, Zhou XJ. Handbook of MRI pulse sequences. New York: Elsevier Academic Press; 2004. pp. 774–788. [Google Scholar]
- 19.McCormack EJ, Egnor MR, Wagshul ME. Improved cerebrospinal fluid flow measurements using phase contrast balanced steady-state free precession. Magn Reson Imaging. 2007 Feb;25(2):172–182. doi: 10.1016/j.mri.2006.09.023. [DOI] [PubMed] [Google Scholar]
- 20.Aletras AH, Kellman P, Derbyshire JA, Arai AE. ACUT2E TSE-SSFP: a hybrid method for T2-weighted imaging of edema in the heart. Magn Reson Med. 2008 Feb;59(2):229–235. doi: 10.1002/mrm.21490. [DOI] [PubMed] [Google Scholar]
- 21.Hinks RS, Constable RT. Gradient moment nulling in fast spin echo. Magn Reson Med. 1994 Dec;32(6):698–706. doi: 10.1002/mrm.1910320604. [DOI] [PubMed] [Google Scholar]
- 22.Luz Z, Meiboom S. Nuclear Magnetic Resonance Study of the Protolysis of Trimethylammonium Ion in Aqueous Solution-Order of the Reaction with Respect to Solvent. J Chem Phys. 1963;39(2):366. [Google Scholar]
- 23.Fielden SW, Mugler JP, III, Meyer CH. Catalyzing the refocused TSE echo train facilitates phase-detection for fat-water separation. Proceedings of the 20th Annual Meeting of ISMRM; Melbourne, Australia. 2012. (abstract 2488) [Google Scholar]
- 24.Cukur T, Shimakawa A, Yu H, Hargreaves BA, Hu BS, Nishimura DG, et al. Magnetization-prepared IDEAL bSSFP: a flow-independent technique for noncontrast-enhanced peripheral angiography. J Magn Reson Imaging. 2011 Apr;33(4):931–939. doi: 10.1002/jmri.22479. [DOI] [PMC free article] [PubMed] [Google Scholar]
- 25.Fielden SW, Tan H, Mugler JP, III, Kramer CM, Meyer CH. Noncontrast MRA using spiral refocused turbo spin echo. Proceedings of the 18th Annual Meeting of ISMRM; Stockholm, Sweden. 2010. (abstract 3788) [Google Scholar]
- 26.Henkelman RM, Hardy PA, Bishop JE, Poon CS, Plewes DB. Why fat is bright in RARE and fast spin-echo imaging. J Magn Reson Imaging. 1992 Sep-Oct;2(5):533–540. doi: 10.1002/jmri.1880020511. [DOI] [PubMed] [Google Scholar]


