

Abstract
Neonatal sepsis (NS) is an important cause of mortality in newborns and life-threatening disorder in infants. The meta-analysis was performed to investigate the diagnosis value of tumor necrosis factor-α (TNF-α) test in NS. Our collectible studies were searched from PUBMED, EMBASE, and the Cochrane Library between March 1994 and August 2013. Accordingly, 347 studies were collected totally, in which 15 articles and 23 trials were selected to study the NS in our meta-analysis. The TNF-α test showed moderate accuracy of the diagnosis of NS both in early-onset neonatal sepsis (sensitivity = 0.66, specificity = 0.76, Q∗ = 0.74) and in late-onset neonatal sepsis (sensitivity = 0.68, specificity = 0.89, Q∗ = 0.87). We also found the northern hemisphere group in the test has higher sensitivity (0.84) and specificity (0.83). A diagnostic OR analysis found that the study population may be the major reason for the heterogeneity. Accordingly, we suggest that TNF-α is also a valuable marker in the diagnosis of NS.
1. Introduction
Neonatal sepsis (NS), as one of the major causes, leads to neonatal mortality and morbidity, especially in neonates born preterm [1]. Early diagnosis and management of the newborn infant with NS play key roles in preventing severe and life-threatening complications [2]. During the first hours of life, reliable infection markers are absent in NS. Therefore, neonatologists often begin early antibiotic treatment in newborn infants with risk factors for infection, exposing many neonates to unnecessary treatments. Due to the limitation of the treatment strategy in early diagnosis of sepsis, the isolation of causative organisms from microbiological cultures takes up to 72 h, which cannot be used to identify most infected infants [3].
Procalcitonin (PCT), a 116-amino acid peptide considered as a precursor in calcium homeostasis, has been proved to be a valuable marker for distinguishing sepsis from other noninfectious disease [4, 5]. C-reactive protein (CRP), another biomarker, is a protein discovered in the blood and whose levels will rise after inflammation [6–8]. To date, CRP and PCT have been proposed for inclusion as two mostly used diagnostic markers in the international definition of sepsis [9, 10]. Recently, many studies have found that some new markers also play important roles in the diagnosis of neonatal sepsis. However, the systematic research and comparison of these biomarkers for diagnosing NS are limited. For example, we have investigated the diagnosis value of serum amyloid A (SAA) in NS [11]. Here, we continue to evaluate the value of the tumor necrosis factor-α (TNF-α), by considering it as a useful marker. TNF-α is a cytokine involved in systemic inflammation, which belongs to a member of a group of cytokines that stimulate the acute phase reaction [12].
Thus, the objective of this meta-analysis was to investigate the value of TNF-α for detecting NS. Although a lot of works indicate that both PCT and CRP are two superior markers for diagnosis of sepsis and infection, we suggest here the TNF-α is also a promising marker in NS. A deeper meta-analysis of these studies is thus currently needed.
2. Methods
2.1. Studies Retrieval and Selection
In order to perform a systematic analysis of the available evidence on the efficacy of TNF-α in NS [13], the common approach of literature search was performed in PUBMED, EMBASE, and the Cochrane Library for relevant citations from March 1994 to August 2013. The search terms used were “TNF-α,” “neonatal,” “neonate,” “sepsis,” “infant,” “newborn,” and “tumor necrosis factors-α”. The reference lists of all known primary and review articles were also searched. No language restriction was used, so that we have examined the references of known articles to fully retrieve the data.
If an article does not include enough data for calculating sensitivity and specificity (2 × 2 table), we asked the corresponding author to provide us with necessary data. If there was no response from the corresponding author, a reminder was sent after one week. If we still cannot achieve the data after this process, the study was excluded from meta-analysis. The selection of articles was performed by two investigators independently to ensure the high accuracy.
2.2. Data Extraction
Data collected from the studies included the first author, publication year, diagnostic cut-off point and time, test methods, and sensitivity and specificity data. So the numbers of true-positive, false-positive, false-negative, and true-negative results were extracted for each study. Accuracy data was extracted to construct 2 × 2 table at a specific time. We have requested the information from the authors, if no enough data on the criteria was found in the studies.
2.3. Statistical Analysis
We used Meta-Disc 1.4 software and Review Manager 5.0 to perform the statistical analysis [14]. Diagnoses were grouped into two groups according to the time of TNF-α test for diagnosis of NS. One group is the time points of TNF-α measurement for the diagnosis of early-onset neonatal sepsis (EONS), which were 0–72 h of age; the other group is the time points of TNF-α measurement for the diagnosis of late-onset neonatal sepsis (LONS), in which the age of neonates is older than 72 h. We calculated the sensitivity, specificity, diagnostic odds ratio (OR), and corresponding 95% confidence intervals (CI) from each study. We also gained the pooled sensitivity, specificity, and diagnosis OR from each group.
The diagnostic OR expresses how much greater the odds of having sepsis are for newborns who have a positive test result, relatively to newborns who have a negative result [15]. For the estimates of diagnostic OR, heterogeneity was assessed by using the Cochrane Q statistic. Normally, I 2 lies between 0% and 100%. If I 2 < 50%, then there is a lot of homogeneity among studies in meta-analysis; whereas I 2 > 50% shows there is more heterogeneity among studies. A value of 0% indicates no observed heterogeneity, and larger values show increasing heterogeneity [16]. We explored the reasons for heterogeneity by carrying out the subgroup analysis and examined characteristics of included studies.
In order to summarize these results, we constructed summary receiver operator characteristic (SROC) curves, which showed the relationship between sensitivity and the false positives (1-specificity). Q* values was received from the SROC curves. Meanwhile, the area under the (SROC) curves was also calculated from the SROC curves, which have been proposed as a way to assess diagnostic data in the context of a meta-analysis [17].
3. Results
3.1. Study Selection
The literature search was completed in August 2013. We found 347 potentially relevant restudies, but only 15 articles met our inclusion criteria. Figure 1 shows the chart of literature search. Detailed information for each included study is presented in Table 1.
Figure 1.
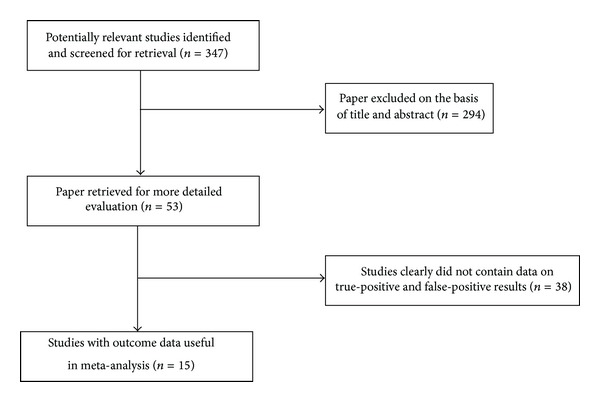
Summary of study assessment and inclusion in the meta-analysis of studies involving diagnosis of neonatal sepsis using a TNF-α test.
Table 1.
Characteristics of studies included in the meta-analysis of the diagnosis of neonatal sepsis using a TNF-α test.
| Study | Study population | Patients (n) | Sepsis diagnosis | Cut-off (pg/mL) | Time | Country |
|---|---|---|---|---|---|---|
| Hotoura et al. 2012 [1] | Cases: newborns with suspected sepsis Control: infection-free infants |
82 | Culture; clinical | 30 | LONS | Greece |
| Hotoura et al. 2012 [1] | Cases: newborns with suspected sepsis Control: infection-free infants |
82 | Culture; clinical | 15 | LONS | Greece |
| Sherwin et al. 2008 [28] | Cases: NICU newborns with suspected sepsis Control: neonates without sepsis |
164 | Culture; clinical | 180 | EONS | New Zealand |
| Sherwin et al. 2008 [28] | Cases: NICU newborns with suspected sepsis Control: neonates without sepsis |
164 | Culture; clinical | 70 | LONS | New Zealand |
| Sherwin et al. 2008 [28] | Cases: NICU newborns with suspected sepsis Control: neonates without sepsis |
164 | Culture; clinical | 180 | LONS | New Zealand |
| Kocabaş et al. 2007 [14] | Cases: neonates with a suspected clinical sepsis Control: healthy neonates without infectious |
55 | Culture; clinical | 7.5 | LONS | Turkey |
| Fida et al. 2006 [18] | Cases: neonates with clinical or proven or possible infected sepsis Control: disease without infection |
28 | Culture; clinical | 29.86 | EONS | Saudi Arabia |
| Park et al. 2004 [19] | Cases: newborns with suspected sepsis Control: neonates without sepsis |
77 | Culture; clinical | 41 | EONS | Korea |
| Layseca-Espinosa et al. 2002 [20] | Cases: neonates with clinical or proven sepsis Control: disease without infection |
63 | Culture; clinical | 0.18 | EONS | Spain |
| Martin et al. 2001 [21] | Cases: newborns with suspected sepsis Control: neonates without sepsis |
32 | Culture; clinical | 20 | EONS | Sweden |
| Berner et al. 2000 [22] | Cases: newborns with suspected sepsis Control: neonates without sepsis |
31 | Culture; clinical | 48 | EONS | Germany |
| Silveira and Procianoy 1999 [23] | Cases: newborn infants with clinical sepsis or probably infected with clinical sepsis Control: neonates without sepsis |
117 | Culture; clinical | 12 | EONS | Brazil |
| Ng et al. 1997 [29] | Cases: VLBW infants with suspected clinical sepsis Control: noninfected newborns |
101 | Culture; clinical | 17 | LONS | Hong Kong |
| Ng et al. 1997 [29] | Cases:VLBW infants with suspected clinical sepsis Control: noninfected newborns |
101 | Culture; clinical | 17 | LONS | Hong Kong |
| Ng et al. 1997 [29] | Cases: VLBW infants with suspected clinical sepsis Control: noninfected newborns |
101 | Culture; clinical | 17 | LONS | Hong Kong |
| Hotoura et al. 2011 [30] | Cases: full-term neonates with suspected or documented infection Control: infection-free infants |
95 | Culture; clinical | 30 | LONS | Greece |
| Hotoura et al. 2011 [30] | Cases: full-term neonates with suspected or documented infection Control: infection-free infants |
95 | Culture; clinical | 15 | LONS | Greece |
| Hallwirth et al. 2002 [24] | Cases: neonates with sepsis Control: neonates without sepsis |
25 | Culture; clinical | 20000 | LONS | Austria |
| Procianoy and Silveira 2012 [25] | Cases: very low birth weight infants with clinical sepsis Control: neonates without sepsis |
84 | Culture; clinical | 30 | EONS | Brazil |
| Shi et al. 1994 [26] | Cases: neonates with sepsis Control: neonates without sepsis |
67 | Culture; clinical | 267.2 | EONS | CHINA |
| Ng et al. 2007 [27] | Cases: very low birth weight infants with suspected sepsis Control: neonates without sepsis |
155 | Culture; clinical | 0.6 | EONS | Hong Kong |
| Ng et al. 2007 [27] | Cases: very low birth weight infants with suspected sepsis Control: neonates without sepsis |
155 | Culture; clinical | 0.6 | EONS | Hong Kong |
| Hallwirth et al. 2002 [24] | Cases: neonates with sepsis Control: neonates without sepsis |
25 | Culture; clinical | 20000 | EONS | Austria |
3.2. Accuracy of the TNF-α Test in the Diagnosis of Proven Early-Onset Neonatal Sepsis
Eleven articles and twelve trials were included to estimate the use of the TNF-α test in the diagnosis of proven early-onset neonatal sepsis (EONS). EONS was defined as the clinical sepsis in the 0–72 h after delivery, met the inclusion criteria in [18–27].
In these trials, we can get the TP, TN, FP, FN, sensitivity, specificity, DOR, PPV, and NPV from the articles. The sensitivity ranged from 20.8% to 100% and pooled sensitivity is 66.1% (95% CI 60.7%–70.1%), specificity ranged from 43.1% to 100% and pooled specificity is 75.6% (95% CI 72.2%–78.9%), and the detailed forest map is shown in Figure 2. We calculated the significant heterogeneity among studies (sensitivity, I 2 = 87.5%; specificity, I 2 = 88.7%); it indicated that patient selection or other relevant factors might be responsible for heterogeneity.
Figure 2.
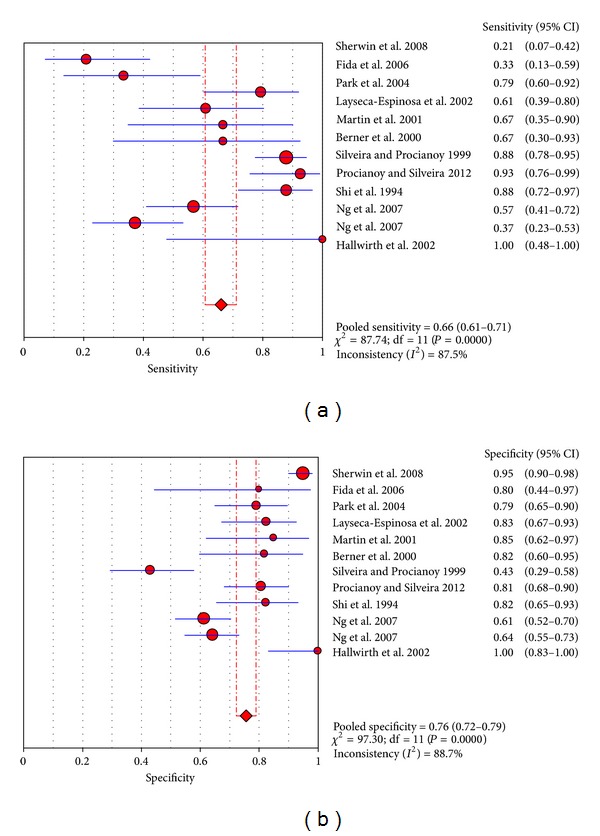
Forest plot for sensitivity and specificity of the TNF-α test to diagnose neonatal sepsis at the EONS.
The value of DOR of TNF-α was 7.43 (95%CI 3.47–15.90), as shown in Figure 3. In these articles, we calculated the significant heterogeneity (I 2 = 77.9%). The SROC curve for TNF-α markers was plotted in Figure 4; the AUC was 0.81 with the standard error being 0.04. The pooled diagnostic accuracy (Q*) of 0.7430 with the standard error was 0.04.
Figure 3.
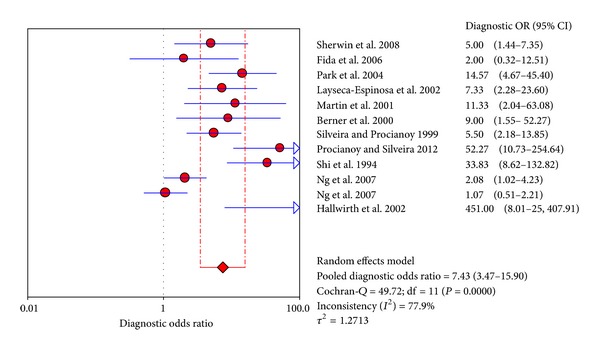
Forest plot for diagnostic OR of the TNF-α test to diagnose neonatal sepsis at the EONS.
Figure 4.
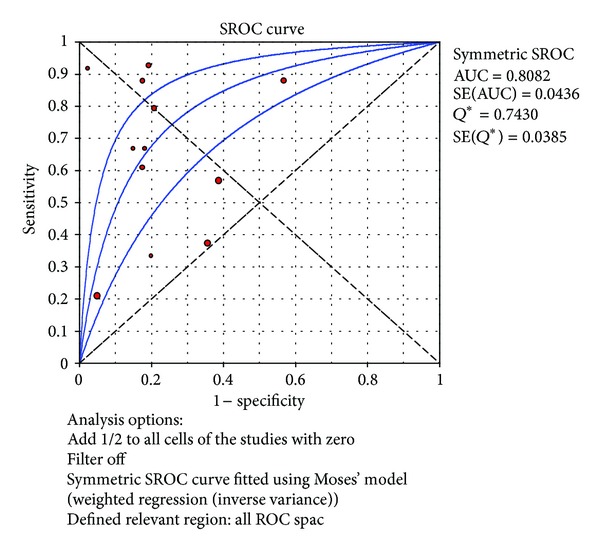
Summary receiver operating characteristic (SROC) curve of the TNF-α test for the diagnosis of early-onset neonatal sepsis. Each point represents one study in the SROC curve.
3.3. Accuracy of the TNF-α Test in the Diagnosis of Proven Late-Onset Neonatal Sepsis
Six articles and eleven trials were included to estimate the use of the TNF-α test in the diagnosis of proven late-onset neonatal sepsis (LONS). LONS was defined as the clinical sepsis 72 h after birth, met the inclusion criteria in [1, 14, 24, 28–30].
In these trials, we can also get much information from the articles. The sensitivity ranged from 23.1% to 100% and pooled sensitivity is 68.0% (95% CI 62.8%–72.8%), specificity ranged from 73.2% to 100% and pooled specificity is 88.5% (95% CI 85.9%–90.7%), and the detailed forest map is shown in Figure 5. We calculated the significant heterogeneity among studies (sensitivity, I 2 = 91.9%; specificity, I 2 = 87.5%), which indicated that patient selection or other relevant factors might be responsible for heterogeneity.
Figure 5.
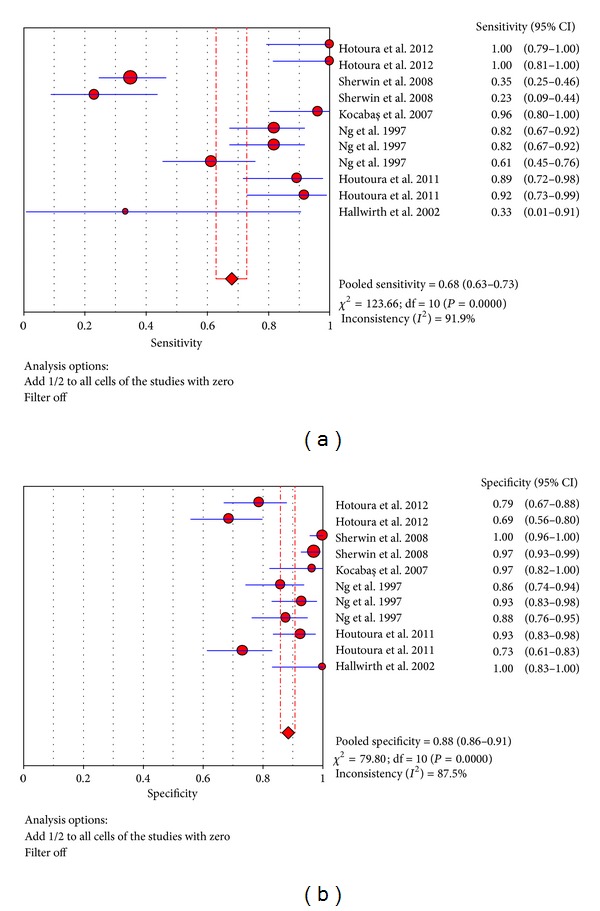
Forest plot for sensitivity and specificity of the TNF-α test to diagnose neonatal sepsis at the LONS.
The value of DOR of TNF-α was 37.44 (95% CI 19.07–73.48), as shown in Figure 6. In these articles, we calculated the significant heterogeneity (I 2 = 41.6%). The SROC curves for TNF-α markers were plotted in Figure 7; the AUC was 0.93 with the standard error being 0.017. The pooled diagnostic accuracy (Q*) of 0.8696 with the standard error was 0.02.
Figure 6.
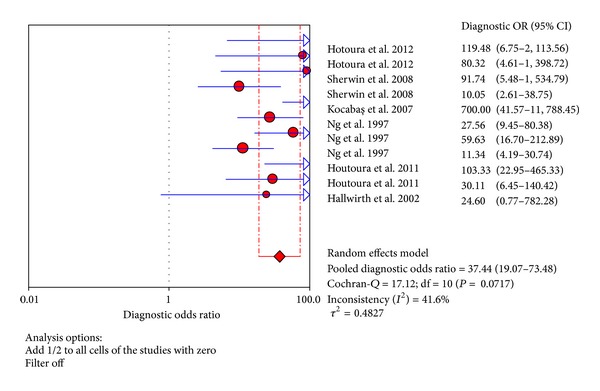
Forest plot for diagnostic OR of the TNF-α test to diagnose neonatal sepsis at the LONS.
Figure 7.

Summary receiver operating characteristic (SROC) curve of the TNF-α test for the diagnosis of late-onset neonatal sepsis. Each point represents one study in the SROC curve.
3.4. Intensive Study of the TNF-α Test in the Diagnosis of Proven Late-Onset Neonatal Sepsis
In the LONS study, study populations come from different countries, but in general they can be further divided into two regions: the northern hemisphere and the southern hemisphere.
Eight trials were included to estimate the use of the TNF-α test in the northern hemisphere at the diagnosis of proven late-onset neonatal sepsis [1, 14, 29, 30]. In these trials, sensitivity ranged from 61.4% to 100% and pooled sensitivity is 84.0% (95% CI 78.8%–88.4%), specificity ranged from 68.8% to 96.6% and pooled specificity is 83.3% (95% CI 79.6%–86.6%), and the detailed forest maps are shown in Figure 8. We calculated the significant heterogeneity among studies (sensitivity, I 2 = 77.4%; specificity, I 2 = 76.3%), which indicated that patient selection or other relevant factors might be responsible for heterogeneity.
Figure 8.
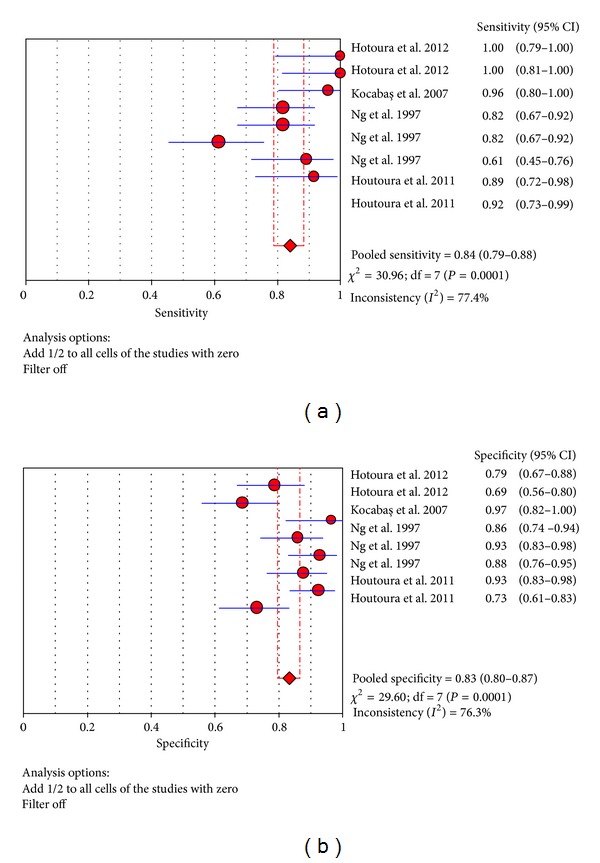
Forest plot for sensitivity and specificity of the TNF-α test to diagnose neonatal sepsis at the LONS in the northern hemisphere.
The value of DOR of TNF-α test in the northern hemisphere at the diagnosis of proven late-onset neonatal sepsis was 44.94 (95% CI 20.71–97.50), as shown in Figure 9. In these articles, we calculated the significant heterogeneity (I 2 = 47.1%). The SROC curves for TNF-α markers were plotted in Figure 10; the AUC was 0.93 with the standard error being 0.017. The pooled diagnostic accuracy (Q*) of 0.8710 with the standard error was 0.02.
Figure 9.
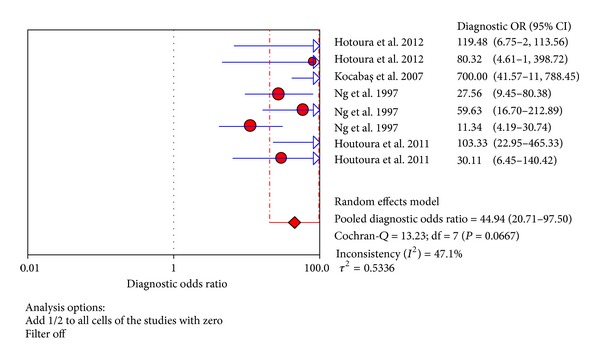
Forest plot for diagnostic OR of the TNF-α test to diagnose neonatal sepsis at the LONS in the northern hemisphere.
Figure 10.
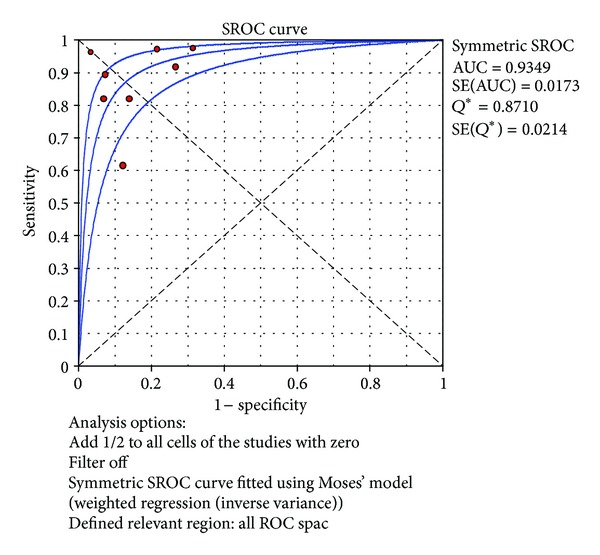
Summary receiver operating characteristic (SROC) curve of the TNF-α test for the diagnosis of late-onset neonatal sepsis in the northern hemisphere. Each point represents one study in the SROC curve.
Three trials were included to estimate the use of the TNF-α test in the southern hemisphere at the diagnosis of proven late-onset neonatal sepsis [24, 28]. In these trials, sensitivity ranged from 23.1% to 35% and pooled sensitivity is 32.1% (95% CI 23.5%–41.7%), specificity ranged from 97.1% to 100% and pooled specificity is 98.3% (95% CI 95.8%–99.5%), and the detailed forest map is shown in Figure 11. We calculated the significant heterogeneity among studies (sensitivity, I 2 = 0%; specificity, I 2 = 56.0%), which indicated that patient selection or other relevant factors might be responsible for heterogeneity.
Figure 11.
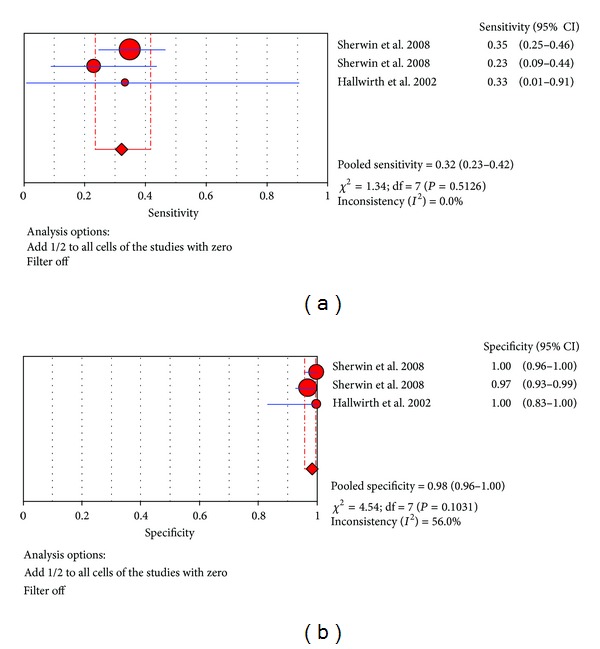
Forest plot for sensitivity and specificity of the TNF-α test to diagnose neonatal sepsis at the LONS in the southern hemisphere.
The value of DOR of TNF-α test in the northern hemisphere at the diagnosis of proven late-onset neonatal sepsis was 20.88 (95% CI 3.84–113.49), as shown in Figure 12. In these articles, we calculated the significant heterogeneity (I 2 = 35.5%). The SROC curves for TNF-α markers were plotted in Figure 13; the AUC was 0.0468 with the standard error being 0.224. The pooled diagnostic accuracy (Q*) of 0.1052 with the standard error was 0.309.
Figure 12.
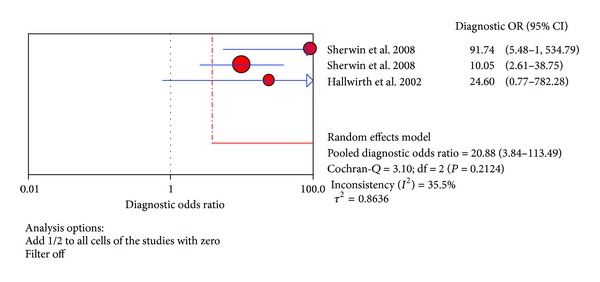
Forest plot for diagnostic OR of the TNF-α test to diagnose neonatal sepsis at the LONS in the southern hemisphere.
Figure 13.
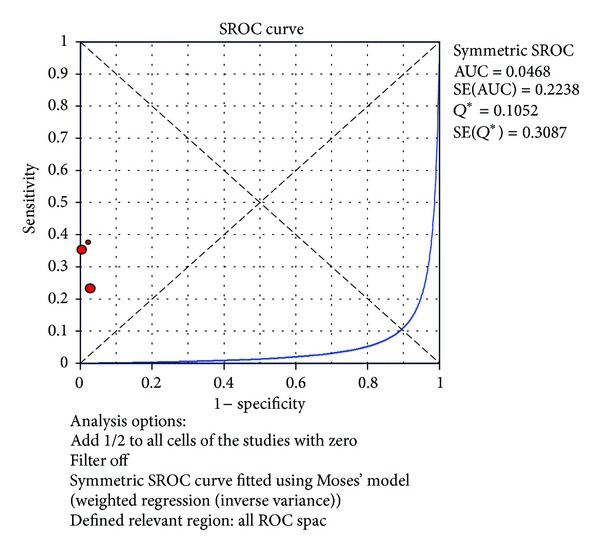
Summary receiver operating characteristic (SROC) curve of the TNF-α test for the diagnosis of late-onset neonatal sepsis in the southern hemisphere. Each point represents one study in the SROC curve.
3.5. Comparison of the Diagnostic Accuracy of Markers for Neonatal Sepsis
In LONS, PCT and CRP have been proven to be useful markers for the diagnosis of NS [3, 9, 31]. In order to show the value of diagnosis of the TNF-α test for NS in LONS, we compared TNF-α with PCT and CRP in LONS. Six articles and eleven trials were used to evaluate the diagnosis of TNF-α. Compared with 55% (95% CI 45%–65%) for the CRP test and 72% (95% CI 63%–81%) for the PCT test [14], the pooled sensitivity for the TNF-α test was 68% (95% CI 63%–73%).
The pooled specificity for the TNF-α was slightly higher than for the CRP and PCT test (88.5% (95% CI 86%–91%) versus 85% (95% CI 81%–88%) versus 77% (95% CI 72%–81%)). Furthermore, the pooled diagnostic OR for the TNF-α was higher than CRP and PCT (37.4 (95% CI 19.1–73.5) versus 8.6 (95% CI 3.5–21.0) versus 11.6 (95% CI 5.2–26.0)). The Q* value was slightly higher for the TNF-α than CRP and PCT (0.87 versus 0.75 versus 0.77). In SROC curve the TNF-α's AUC is almost equal to CRP (0.93 versus 0.96). As many articles reported that PCT and CRP are good markers, the TNF-α is also a good marker for the diagnosis of NS in LONS.
3.6. Analysis of Heterogeneity
Heterogeneity is very critical in a meta-analysis, so we should try to explore the reason for the heterogeneity. Generally speaking, variations include several influence factors, for instance the cut-off value, study population, inject antibodies, and so forth.
Firstly, we consider the cut-off value. In our study, many data are so large, so we suppose that this is the possible reason for the heterogeneity. We excluded two studies of [24, 28] whose cut-off values were relatively large. But the I 2 (heterogeneity test) almost does not change (41.7% versus 41.6%). So the cut-off value is not the reason for the heterogeneity. Secondly, we consider the study population. The I 2 is reduced from 41.6% to 0% when two studies of [28, 29] were excluded from the meta-analysis. Their study population is different from others. So the study population may be the major reason for the heterogeneity.
3.7. Publication Bias
The publication bias is difficult to avoid in meta-analysis [32]. In each study, we often choose favorable results and give up negative results; many “blindness” of test results was never reported. The limit of current available data may bias our conclusion.
4. Discussion
NS is one of the most common diseases and life-threating disorder in neonate, and thus it can bring the high mortality and morbidity in infants. So the identification of biomarkers is very important to improve the diagnosis of NS. The clinical signs are nonspecific and laboratory indicators including blood culture are not reliable [33]. The sensitivities of markers are not always so high [34]. So it is necessary to find a good marker for NS.
It is well known that an excellent marker should have high sensitivity and specificity. In our meta-analysis, the TNF-α tests' sensitivity is 0.66 for the diagnosis of early-onset neonatal sepsis, and the specificity is 0.46 and the Q* is 0.74. At the late-onset neonatal sepsis, the TNF-α test's sensitivity is 0.68, whereas the specificity is 0.89 and the Q* is 0.87. In particular, TNF-α shows a higher accuracy for the diagnosis of NS in LONS. Therefore, we have further analyzed the regional issues in LONS. To this end, we have classified studies into two groups, that is, northern hemisphere group [1, 14, 29, 30] and southern hemisphere group [24, 28]. Our analysis found that the northern hemisphere group has higher sensitivity and specificity (sensitivity = 84%, specificity = 83%). The results show that the TNF-α has appropriate accuracy for the diagnosis of NS and thus is a good biomarker for the diagnosis of NS.
CRP is an excellent marker and has been applied in clinic [10]. The sensitivity of CRP is 30%–97%, and the specificity ranged from 75% to 100% [35]. In our meta-analysis, TNF-α' sensitivity ranged from 23.1% to 100%, and specificity ranged from 73.2% to 100%. The study from TNF-α is similar to CRP, so the TNF-α is a useful marker in the diagnosis of NS. In addition, PCT is more excellent marker which has better accuracy than CRP for the diagnosis of NS [3]. In our meta-analysis, the pooled sensitivity of TNF-α is slightly lower than that of the PCT test in EONS (66.1% versus 74%), the pooled specificity also in such (76% versus 86%). But in LONS, the pooled specificity of TNF-α is higher than that of the PCT test (89% versus 77%), although the pooled sensitivity is slightly lower than PCT (68% versus 72%). Generally speaking, the data of TNF-α and PCT is greater than CRP. This result again shows that TNF-α is good marker in the diagnosis of NS.
In conclusion, TNF-α shows the moderate accuracy in the diagnosis of NS, both in EONS and LONS. If we test the accuracy of TNF-α by further dividing data into two regions, the study in northern hemisphere shows a better result. Because of the relatively few testing data, the experiments results need to be further studied and the clinical validation is also needed.
Acknowledgments
This work was supported by the National Natural Science Foundation of China Grants (81272143 and 21203131), the Natural Science Foundation of Jiangsu Province (K200509), the Natural Science Foundation of the Jiangsu Higher Education Institutions of China (12KJB180014), Jiangsu Innovation Team Grant LJ201141, and Program of Innovative and Entrepreneurial Talent.
Conflict of Interests
The authors declare that there is no conflict of interests regarding the publication of this paper.
Authors' Contribution
Bokun Lv and Jie Huang equally contributed to this work.
References
- 1.Hotoura E, Giapros V, Kostoula A, Spyrou P, Andronikou S. Pre-inflammatory mediators and lymphocyte subpopulations in preterm neonates with sepsis. Inflammation. 2012;35(3):1094–1101. doi: 10.1007/s10753-011-9416-3. [DOI] [PubMed] [Google Scholar]
- 2.Mishra UK, Jacobs SE, Doyle LW, Garland SM. Newer approaches to the diagnosis of early onset neonatal sepsis. Archives of Disease in Childhood. 2006;91(3):F208–F212. doi: 10.1136/adc.2004.064188. [DOI] [PMC free article] [PubMed] [Google Scholar]
- 3.Yu Z, Liu J, Sun Q, Qiu Y, Han S, Guo X. The accuracy of the procalcitonin test for the diagnosis of neonatal sepsis: a meta-analysis. Scandinavian Journal of Infectious Diseases. 2010;42(10):723–733. doi: 10.3109/00365548.2010.489906. [DOI] [PubMed] [Google Scholar]
- 4.Uzzan B, Cohen R, Nicolas P, Cucherat M, Perret G-Y. Procalcitonin as a diagnostic test for sepsis in critically ill adults and after surgery or trauma: a systematic review and meta-analysis. Critical Care Medicine. 2006;34(7):1996–2003. doi: 10.1097/01.CCM.0000226413.54364.36. [DOI] [PubMed] [Google Scholar]
- 5.Müller B, Christ-Crain M, Nylen ES, Snider R, Becker KL. Limits to the use of the procalcitonin level as a diagnostic marker. Clinical Infectious Diseases. 2004;39(12):1867–1868. doi: 10.1086/426148. [DOI] [PubMed] [Google Scholar]
- 6.Bilavsky E, Yarden-Bilavsky H, Ashkenazi S, Amir J. C-reactive protein as a marker of serious bacterial infections in hospitalized febrile infants. Acta Paediatrica. 2009;98(11):1776–1780. doi: 10.1111/j.1651-2227.2009.01469.x. [DOI] [PubMed] [Google Scholar]
- 7.Kordek A, Hałasa M, Podraza W. Early detection of an early onset infection in the neonate based on measurements of procalcitonin and C-reactive protein concentrations in cord blood. Clinical Chemistry and Laboratory Medicine. 2008;46(8):1143–1148. doi: 10.1515/CCLM.2008.214. [DOI] [PubMed] [Google Scholar]
- 8.Simon L, Gauvin F, Amre DK, Saint-Louis P, Lacroix J. Serum procalcitonin and C-reactive protein levels as markers of bacterial infection: a systematic review and meta-analysis. Clinical Infectious Diseases. 2004;39(2):206–217. doi: 10.1086/421997. [DOI] [PubMed] [Google Scholar]
- 9.Caldas JPS, Marba STM, Blotta MHSL, Calil R, Morais SS, Oliveira RTD. Accuracy of white blood cell count, C-reactive protein, interleukin-6 and tumor necrosis factor alpha for diagnosing late neonatal sepsis. Jornal de Pediatria. 2008;84(6):536–542. doi: 10.2223/JPED.1838. [DOI] [PubMed] [Google Scholar]
- 10.Levy MM, Fink MP, Marshall JC, et al. 2001 SCCM/ESICM/ACCP/ATS/SIS international sepsis definitions conference. Intensive Care Medicine. 2003;29(4):530–538. doi: 10.1007/s00134-003-1662-x. [DOI] [PubMed] [Google Scholar]
- 11.Yuan H, Huang J, Lv B, et al. Diagnosis value of the serum amyloid a test in neonatal sepsis: a meta-analysis. BioMed Research International. 2013;2013:9 pages. doi: 10.1155/2013/520294.520294 [DOI] [PMC free article] [PubMed] [Google Scholar]
- 12.Francesconi LP, Ceresér KM, Mascarenhas R, Stertz L, Gama CS, Belmonte-de-Abreu P. Increased annexin-V and decreased TNF-alpha serum levels in chronic-medicated patients with schizophrenia. Neuroscience Letters. 2011;502(3):143–146. doi: 10.1016/j.neulet.2011.06.042. [DOI] [PubMed] [Google Scholar]
- 13.Bernardo WM, Aires FT, Carneiro RM, Sá FP, Rullo VE, Burns DA. Effectiveness of probiotics in the prophylaxis of necrotizing enterocolitis in preterm neonates: a systematic review and meta-analysis. Jornal de Pediatria. 2013;89(1):18–24. doi: 10.1016/j.jped.2013.02.004. [DOI] [PubMed] [Google Scholar]
- 14.Kocabaş E, Sarikçioğlu A, Aksaray N, Seydaoğlu G, Seyhun Y, Yaman A. Role of procalcitonin, C-reactive protein, interleukin-6, interleukin-8 and tumor necrosis factor-α in the diagnosis of neonatal sepsis. Turkish Journal of Pediatrics. 2007;49(1):7–20. [PubMed] [Google Scholar]
- 15.Glas AS, Lijmer JG, Prins MH, Bonsel GJ, Bossuyt PMM. The diagnostic odds ratio: a single indicator of test performance. Journal of Clinical Epidemiology. 2003;56(11):1129–1135. doi: 10.1016/s0895-4356(03)00177-x. [DOI] [PubMed] [Google Scholar]
- 16.Higgins JPT, Thompson SG, Deeks JJ, Altman DG. Measuring inconsistency in meta-analyses. British Medical Journal. 2003;327(7414):557–560. doi: 10.1136/bmj.327.7414.557. [DOI] [PMC free article] [PubMed] [Google Scholar]
- 17.Walter SD. Properties of the Summary Receiver Operating Characteristic (SROC) curve for diagnostic test data. Statistics in Medicine. 2002;21(9):1237–1256. doi: 10.1002/sim.1099. [DOI] [PubMed] [Google Scholar]
- 18.Fida NM, Al-Mughales JA, Fadellah MF. Serum concentrations of interleukin-1 alpha, interleukin-6 and tumor necrosis factor-alpha in neonatal sepsis and meningitis. Saudi Medical Journal. 2006;27(10):1508–1514. [PubMed] [Google Scholar]
- 19.Park KH, Yoon BH, Shim S-S, Jun JK, Syn HC. Amniotic fluid tumor necrosis factor-alpha is a marker for the prediction of early-onset neonatal sepsis in preterm labor. Gynecologic and Obstetric Investigation. 2004;58(2):84–90. doi: 10.1159/000078492. [DOI] [PubMed] [Google Scholar]
- 20.Layseca-Espinosa E, Pérez-González LF, Torres-Montes A, et al. Expression of CD64 as a potential marker of neonatal sepsis. Pediatric Allergy and Immunology. 2002;13(5):319–327. doi: 10.1034/j.1399-3038.2002.01064.x. [DOI] [PubMed] [Google Scholar]
- 21.Martin H, Olander B, Norman M. Reactive hyperemia and interleukin 6, interleukin 8, and tumor necrosis factor-alpha in the diagnosis of early-onset neonatal sepsis. Pediatrics. 2001;108(4):p. E61. doi: 10.1542/peds.108.4.e61. [DOI] [PubMed] [Google Scholar]
- 22.Berner R, Tüxen B, Clad A, Forster J, Brandis M. Elevated gene expression of interleukin-8 in cord blood is a sensitive marker for neonatal infection. European Journal of Pediatrics. 2000;159(3):205–210. doi: 10.1007/s004310050051. [DOI] [PubMed] [Google Scholar]
- 23.Silveira RC, Procianoy RS. Evaluation of interleukin-6, tumour necrosis factor-α and interleukin- 1β for early diagnosis of neonatal sepsis. Acta Paediatrica. 1999;88(6):647–650. doi: 10.1080/08035259950169314. [DOI] [PubMed] [Google Scholar]
- 24.Hallwirth U, Pomberger G, Zaknun D, et al. Monocyte phagocytosis as a reliable parameter for predicting early-onset sepsis in very low birthweight infants. Early Human Development. 2002;67(1-2):1–9. doi: 10.1016/s0378-3782(01)00245-6. [DOI] [PubMed] [Google Scholar]
- 25.Procianoy RS, Silveira RC. Association between high cytokine levels with white matter injury in preterm infants with sepsis. Pediatric Critical Care Medicine. 2012;13(2):183–187. doi: 10.1097/PCC.0b013e3182231074. [DOI] [PubMed] [Google Scholar]
- 26.Shi Y, Shen C, Wang J, Li H, Qin S, Liu R. Role of tumor necrosis factor in neonatal sepsis. Chinese Medical Sciences Journal. 1994;9(1):45–48. [PubMed] [Google Scholar]
- 27.Ng PC, Li K, Chui KM, et al. IP-10 is an early diagnostic marker for identification of late-onset bacterial infection in preterm infants. Pediatric Research. 2007;61(1):93–98. doi: 10.1203/01.pdr.0000250207.95723.96. [DOI] [PubMed] [Google Scholar]
- 28.Sherwin C, Broadbent R, Young S, et al. Utility of interleukin-12 and interleukin-10 in comparison with other cytokines and acute-phase reactants in the diagnosis of neonatal sepsis. American Journal of Perinatology. 2008;25(10):629–636. doi: 10.1055/s-0028-1090585. [DOI] [PubMed] [Google Scholar]
- 29.Ng PC, Cheng SH, Chui KM, et al. Diagnosis of late onset neonatal sepsis with cytokines, adhesion molecule, and C-reactive protein in preterm very low birthweight infants. Archives of Disease in Childhood. 1997;77(3):F221–F227. doi: 10.1136/fn.77.3.f221. [DOI] [PMC free article] [PubMed] [Google Scholar]
- 30.Hotoura E, Giapros V, Kostoula A, Spirou P, Andronikou S. Tracking changes of lymphocyte subsets and pre-inflammatory mediators in full-term neonates with suspected or documented infection. Scandinavian Journal of Immunology. 2011;73(3):250–255. doi: 10.1111/j.1365-3083.2010.02499.x. [DOI] [PubMed] [Google Scholar]
- 31.Naher BS, Mannan MA, Noor K, Shahiddullah M. Role of serum procalcitonin and C-reactive protein in the diagnosis of neonatal sepsis. Bangladesh Medical Research Council Bulletin. 2011;37(2):40–46. doi: 10.3329/bmrcb.v37i2.8432. [DOI] [PubMed] [Google Scholar]
- 32.Knudsen TB, Kristiansen TB, Simon L, et al. Issues pertaining to data extraction and classification and publication bias in meta-analysis of the diagnostic accuracy of markers for bacterial infection. Clinical Infectious Diseases. 2005;40(9):1372–1374. doi: 10.1086/429507. [DOI] [PubMed] [Google Scholar]
- 33.Gerdes JS. Diagnosis and management of bacterial infections in the neonate. Pediatric Clinics of North America. 2004;51(4):939–959. doi: 10.1016/j.pcl.2004.03.009. [DOI] [PubMed] [Google Scholar]
- 34.Chiesa C, Panero A, Osborn JF, Simonetti AF, Pacifico L. Diagnosis of neonatal sepsis: a clinical and laboratory challenge. Clinical Chemistry. 2004;50(2):279–287. doi: 10.1373/clinchem.2003.025171. [DOI] [PubMed] [Google Scholar]
- 35.Chan T, Gu F. Early diagnosis of sepsis using serum biomarkers. Expert Review of Molecular Diagnostics. 2011;11(5):487–496. doi: 10.1586/erm.11.26. [DOI] [PubMed] [Google Scholar]