

Abstract
Peripheral nerve injury induces permanent alterations in spinal cord circuitries that are not reversed by regeneration. Nerve injury provokes the loss of many proprioceptive IA afferent synapses (VGLUT1-IR boutons) from motoneurons, the reduction of IA EPSPs in motoneurons, and the disappearance of stretch reflexes. After motor and sensory axons successfully reinnervate muscle, lost IA VGLUT1 synapses are not re-established and the stretch reflex does not recover; however, electrically evoked EPSPs do recover. The reasons why remaining IA synapses can evoke EPSPs on motoneurons, but fail to transmit useful stretch signals are unknown. To better understand changes in the organization of VGLUT1 IA synapses that might influence their input strength, we analyzed their distribution over the entire dendritic arbor of motoneurons before and after nerve injury. Adult rats underwent complete tibial nerve transection followed by microsurgical reattachment and 1 year later motoneurons were intracellularly recorded and filled with neurobiotin to map the distribution of VGLUT1 synapses along their dendrites. We found in control motoneurons an average of 911 VGLUT1 synapses; ∼62% of them were lost after injury. In controls, VGLUT1 synapses were focused to proximal dendrites where they were grouped in tight clusters. After injury, most synaptic loses occurred in the proximal dendrites and remaining synapses were declustered, smaller, and uniformly distributed throughout the dendritic arbor. We conclude that this loss and reorganization renders IA afferent synapses incompetent for efficient motoneuron synaptic depolarization in response to natural stretch, while still capable of eliciting EPSPs when synchronously fired by electrical volleys.
Keywords: axotomy, IA afferents, nerve transection, regeneration, spinal cord, stretch reflex
Introduction
Functional recovery following repair of peripheral nerves remains disappointing for nearly 1 million people who suffer traumatic nerve injuries annually. Nine of 10 patients do not regain normal motor coordination, and 4 of 10 patients have difficulty achieving gross manual activity (Hoke and Brushart, 2010). Current consensus holds that this poor outcome is the result of connection errors made by regenerating sensory and motor axons with peripheral targets. Certainly, targeting errors hinder recovery after injury to major nerve trunks; however, functional impairments are also observed following injuries to terminal nerve branches and after reinnervation of the correct muscle (Abelew et al., 2000; Maas et al., 2007; Sabatier et al., 2011). In this case, targeting errors are not possible and a different mechanism is needed to explain the permanency of disorders in gait, balance, and controlled reaching.
Changes in spinal-cord circuitry triggered by the nerve injury also cause motor dysfunction (Navarro, 2009). Specifically, the stretch reflex is lost after nerve transection and muscle stretch fails to initiate or even modulate motoneuron (MN) firing; this alteration is permanent and remains after successful nerve regeneration and muscle reinnervation in the periphery (Cope et al., 1994; Huyghues-Despointes et al., 2003). This occurs even though nearly half of regenerated muscle spindle afferents successfully reconnect with spindle receptors and afferent responses to stretch can be readily recorded in dorsal roots entering the spinal cord (Collins et al., 1986; Haftel et al., 2005). We found that these deficits are partially explained by the loss of a large fraction of IA afferent synapses on MNs (Alvarez et al., 2011; Bullinger et al., 2011). Surprisingly, although muscle reinnervation does not induce recovery of lost IA synapses, it does partially reverse the profound depression of electrically evoked monosynaptic EPSPs seen in the early weeks after injury (Mendell, 1988; Mendell et al., 1995), and it can restore and even amplify H-reflexes (Valero-Cabré and Navarro, 2001). These findings suggest a nonintuitive paradigm in which remaining IA synapses partially recover their capacity to depolarize the MN when electrically driven, but they are not competent to effectively transmit information about muscle stretch. One possibility is that the IA afferents that remain connected with MNs fail to reinnervate spindles peripherally (Banks and Barker, 1989), another is that their central synapses with MNs redistribute on the dendritic arbor in such a manner that weakens neurotransmission. The exact distribution of the IA afferent input on the whole dendritic arbor of MNs before and after injury is unknown. Therefore, this study had two main goals. First, to determine the total IA afferent input onto single uninjured neurobiotin-filled MNs (using VGLUT1 as a marker; Alvarez et al., 2004, 2011), and second, to map the location of IA synapses that remain after nerve injury and regeneration. Our results suggest that IA afferents are normally nonuniformly distributed along MN dendrites, being concentrated on proximal dendrites. After nerve injury there is preferential loss and structural changes in proximal synapses that could present significant barriers for recovery of MN responses to muscle stretch and reflex function.
Materials and Methods
All studies were performed on adult female Wistar rats (225–300 g). All animal care, nerve surgeries, and electrophysiological recordings in terminal experiments were prepared at Wright State University and approved by the institutional laboratory animal use committee at Wright State University.
Peripheral nerve transection and repair.
Two- to 3-month-old Wistar rats were anesthetized with isoflurane until the animal achieved a surgical plane of anesthesia (induction 4–5%; maintenance 1–3%, both in 100% O2). Nerves were exposed by a midline posterior incision (∼1.5 cm) through the skin of the left leg at the popliteal fossa level. After retraction of the overlying biceps femoris, the tibial nerve (TN) was exposed, completely transected with scissors, and immediately surgically rejoined to promote regeneration. Surgical nerve reunion was achieved by rejoining the cut nerve ends without tension using three 10-0 Ethilon sutures passed through the epineurium. After washing with 0.9% sterile saline, the wound was closed in layers and the animals were removed from anesthesia. A subcutaneous injection of buprenorphine (0.1 mg/kg) was delivered immediately and every 12 h after surgery prophylactically to alleviate any possible pain, up to 2 d after surgeries. The animals never showed signs of distress (vocalization, lethargy, weight loss, absence of grooming) and displayed normal exploratory and feeding behaviors soon after recovery from anesthesia.
Animal preparation for terminal recording sessions and collection of tissue.
Electrophysiological studies were performed on two groups of rats in vivo: a control group of rats that were untreated and age matched to a second group which was treated with tibial nerve repair (described above) >12 months earlier to allow ample time for muscle reinnervation. These animals are all different from the animals we collected for our previously published materials with this nerve injury model (Alvarez et al., 2011). In the terminal experiments, rats were deeply anesthetized by isoflurane throughout the experiment, beginning with induction in an enclosed chamber (4–5% in 100% O2, inhalation in induction chamber) and continuing with delivery through a tracheal cannula (1–3% mixed in 100% O2). The animal's condition was continuously monitored for respiratory rate (40–60 breaths/min), end tidal CO2 (3–5%), oxygen saturation (>90%), heart rate (300–500 beats/min), and core temperature (36°–38°C). These levels were variously maintained by adjusting isoflurane concentration, radiant and water-pad heat sources, and subcutaneous injection of Ringer/dextrose solution. One hour after intracellular recording and labeling of medial gastrocnemius (MG) MNs, the animals received a lethal injection of euthasol (150 mg/kg, i.p.) and were perfusion-fixed through the left ventricle with 4% paraformaldehyde in 0.1 m phosphate buffer. The spinal cord tissue was then harvested and postfixed overnight before histology.
Electrophysiology.
Standard procedures were used to prepare the rat in vivo for electrophysiological recording of individual spinal MNs supplying the MG muscle (Bullinger et al., 2011). Briefly, anesthetized rats were fixed to a rigid recording frame with the dorsal surface of the lumbosacral spinal cord exposed by a laminectomy, and the left hindlimb dissected to expose selected nerves and muscles. Skin flaps were used to construct pools of warm mineral oil over exposed tissues. The MG nerve was dissected and suspended in continuity on a monopolar silver hook electrode for electrical stimulation at a site just distal to the lesion for rats in the regenerated group. Electrical stimulation yielded robust contraction of MG muscles, thereby verifying successful reinnervation in injured animals. All other nerves supplying the limb were crushed, including common peroneal, sural, and tibial nerve.
MNs were searched, impaled, and recorded intracellularly using borosilicate glass microelectrodes (1.2 mm outer diameter, 7–10 MΩ DC resistance, 2 m K-acetate) advanced through the spinal cord using a stepping microdrive (Transvertex). Motoneurons supplying the MG muscle were identified by antidromic action potentials elicited by electrical stimulation of the MG nerve (current strength 2.5× muscle contraction threshold, pulse duration 40 μs). Glass microelectrodes contained 10% solution of Neurobiotin (Vector Laboratories) for labeling. Only MNs with stable membrane potentials and action potential amplitudes of at least +60 mV were acceptable for further study. MNs were injected with current through the micropipette to measure their intrinsic electrical properties: rheobase current (depolarizing pulses 50 ms in duration at the lowest strengths capable of initiating action potentials), after hyperpolarization (AHP; suprathreshold pulses 0.5 ms in duration), and input resistance (hyperpolarization produced by −1 and −3 nA current pulses, 50 ms in duration). Possible differences in conduction velocity were estimated by comparing the delays of the antidromic action potentials after MG nerve stimulation. Positive current (5 nA), delivered as 400 ms pulses at 2 Hz for ∼5–10 min, were used to aid neurobiotin passage into the MN. Then we waited for ∼1 hour, before sacrificing the animal, to allow neurobiotin to spread throughout the entire MN. Records of MN membrane potential, electrode current, muscle length, and muscle force were collected, digitized (20 kHz for all records except 1 kHz for muscle length), stored, and analyzed using Cambridge Electronic Design Power 1401and Spike2 software. To optimize neurobiotin labeling and morphological analyses we deliberately kept our recordings short (<30 min). Therefore these MNs did not undergo the thorough physiological characterization presented by Bullinger et al. (2011). Each filled MN was collected from a different rat with the exception of regenerated MNs 5 and 6 that were obtained from the same rat; MN 5 was more caudal than MN 6.
Histological processing and immunohistochemistry.
Parasagittal longitudinal sections were obtained serially at 75 μm thickness on a vibratome (VT-1000) and processed to reveal neurobiotin and VGLUT1 immunofluorescence. The sections were collected free floating and after blocking with 10% normal donkey serum for 1 h they were incubated overnight in a solution containing streptavidin coupled to AlexaFluor 555 (SA-555, diluted 1:50; Invitrogen) and rabbit anti VGLUT1 antibodies (diluted 1:1000; Synaptic Systems) both diluted in 0.01 m phosphate buffer with 0.9% NaCl and 0.3% Triton X-100 (PBS-TX0.3). The following day the sections were washed in PBS and incubated for 2 h in donkey anti-rabbit IgG antibodies conjugated to fluorescein isothiocyanate (FITC; Jackson Immunoresearch) diluted 1:100 in PBS-TX0.3 and then washed (in PBS), mounted serially on glass slides, and coverslipped with Vectashield (Vector Laboratories).
To confirm the presence of synapses, we estimated the percentage of VGLUT1 dendrite contacts that displayed a presynaptic active zone identified by immunoreactivity to bassoon. Sections containing a further neurobiotin-filled control MN (Cell #7) were immunolabeled with VGLUT1 antibodies as described, but mixed with a mouse monoclonal antibody against bassoon (Enzo Life Sciences) diluted 1:4000 in PBS-TX0.3. Bassoon and VGLUT1 immunoreactivities were detected with respectively DyLight 649- and FITC-coupled secondary antibodies raised in donkey against mouse or rabbit IgGs (Jackson Immunoresearch). Neurobiotin labeling was revealed with SA-555 as before. We randomly sampled 65 VGLUT1 contacts on neurobiotin-labeled dendrites and measured the three fluorescent signals (dendrite neurobiotin, bassoon-IR, and VGLUT1-IR) along lines orthogonal to the dendrites and VGLUT1 terminals. Sixty-three VGLUT1 contacts (95.4%) displayed a bassoon-IR active zone interposed between them and the dendrite (see Fig. 3).
Figure 3.

VGLUT1-IR contacts on MN dendrites display the active zone marker Bassoon. A, Single confocal optical section through the cell body and proximal dendrite of a neurobiotin filled MN (Cell #7). The section was counterstained for VGLUT1 (FITC, green) and bassoon (DyLight 649, blue). B, C, High-magnification of the VGLUT1-IR contact; box in A. Bassoon immunoreactivity is detected in between the VGLUT1-IR contact and the MN dendrite. A line density profile was taken at the indicated position. D, Line profile density. A bassoon immunoreactivity peak (blue line) is present between the peak of VGLUT1-immunofluorescence (green line) and the neurobiotin-filled dendrite (red line). Scale bar (in A), 20 μm.
Confocal imaging and neuron reconstruction.
Every section containing either cell bodies, dendrites, or axonal segments of intracellularly filled MNs was imaged first at low-magnification with 10× and 20× objectives using a epifluorescence microscope (BX60, Olympus) coupled to RT-Spot camera (Diagnostic Instruments) and then at high-magnification in an Olympus FV1000 confocal microscope using a 60× objective (NA, 1.35, oil-immersion) with no digital zoom applied. Low mag images were superimposed in Image Pro Plus (v7.0. Media Cybernetics) to render a first view of the overall organization of the dendrites and matching branches in serial sections (Fig. 1E1,F1). High-magnification was necessary to reveal the presence of synaptic contacts between VGLUT1-immunoreactive (IR) punctae and intracellularly filled dendrites. At high-magnification, the field-of-view includes only an small region of the whole dendritic arbor in the section, for that reason we imaged the whole section using overlapping image tiles, each containing a z-stack of all optical planes (z-step = 1 μm). Up to 42 tiles were necessary in some sections to image all dendritic segments.
Figure 1.
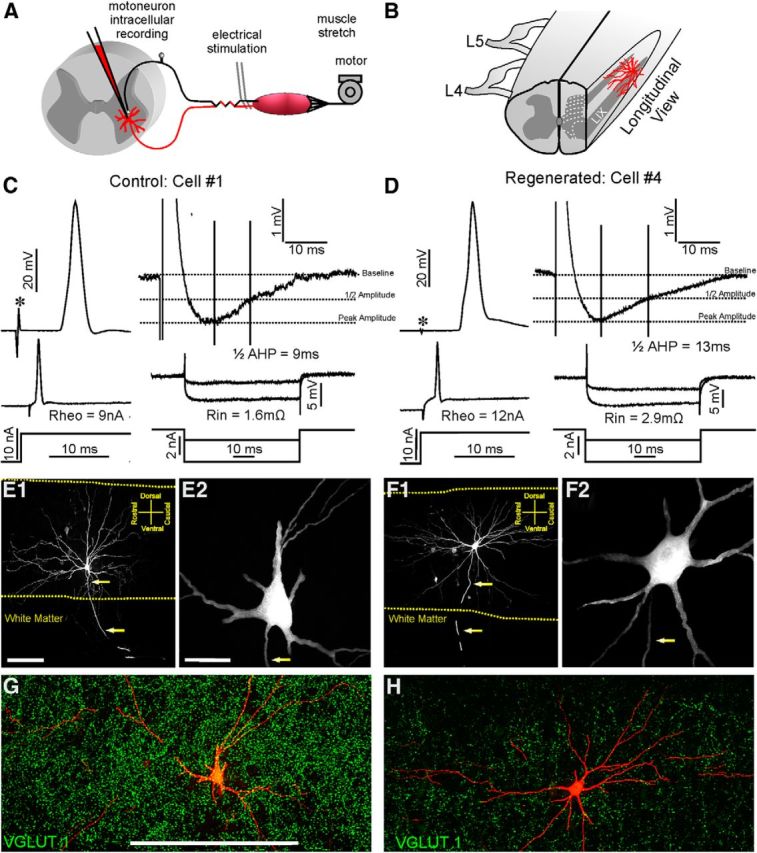
Control and regenerated MG MNs 1 year after nerve injury display similar general electrophysiological and morphological characteristics. A, Schematic of experimental design. MNs were intracellularly recorded after identification using electrical stimulation from the MG nerve as search stimulus. The MG muscle was isolated and its tendon attached to a motor for eliciting controlled stretches and recording muscle force. B, Diagram showing the location of filled MNs and section orientation. All recorded MNs were impaled between L5 and L4 segments, and 75-μm-thick histological sections were obtained in the sagittal plane. The diagram shows the section profile and approximate location of MNs for orientation. C, D, Top, Left, Antidromic APs elicited in a control (C) and a regenerated (D) MNs after stimulation of the MG nerve. There were no significant differences in latency onset of antidromic APs after the stimulus (asterisks) or in AP amplitude. Top, Right, AHPs after eliciting single spikes through an intrasomatic current pulse. Horizontal dashed lines indicate baseline, half-amplitude, and peak amplitude of the AHP. Vertical lines indicate time from peak to half-AHP decay. Bottom, Rheobase currents necessary to elicit firing (Rheo) and hyperpolarizing currents used to check input resistances (Rin) of control (C) and regenerated MNs (D). There were no differences in any of these properties between control and regenerated MNs (Table 1). E, F, Low-magnification partial reconstructions of a control (E1) and a regenerated (F1) MN. Images were constructed by superimposing wide-field epifluorescence digital images from five consecutive 75-μm-thick serial sections. E2, F2, High-magnification confocal images of 2D projections of all optical planes through the cell bodies of the same control (E2) an regenerated (F2) MNs. Dendritic branching, cell body size and number of primary dendrites did not significantly differ between control and regenerated MNs (Table 2). Yellow dashed lines mark the border between white matter and gray matter. Arrows mark the trajectory of ventrally directed axons. G, H, 2D projections of all confocal planes through the 75-μm-thick section containing the neurobiotin labeled cell bodies (red) of the same control (G) and regenerated (H) MNs. The sections were immunostained for VGLUT1 (green). After nerve injury there is dramatic reduction in VGLUT1-IR punctae in lamina IX regions containing the affected motor pools. Scale bars: E1, F1, 300 μm; E2, F2, 50 μm; G, H, 500 μm.
Neuron reconstructions.
Sections were montaged in Neurolucida (v10.0, Microbrightfield) from the z-stack image tiles and all labeled dendrites traced. Dendritic origins from the cell body were defined as the point of maximal convexity in each emerging dendrite. The numbers of points used to trace particular dendrites regions depended on the speed at which they changed in diameter, z-position, or path tortuosity. We entered, on average, one tracing point per 1.4 μm of dendrite length (depending on MN size and dendrite tortuosity this represents between 50,000 and 77,000 points per neuron). The position of each synapse was labeled using a “marker” (filled circle) that was then “attached” to that dendritic position. The cell body was reconstructed through a series of contours traced in each optical plane. Sometimes cell body tracings expanded two sections. VGLUT1-IR synapses on the cell body were labeled with a different marker (filled triangles). Contacts were sometimes confirmed by rotating the images in 3D using Imaris software (v7.2.2, Bitplane; Fig. 2). The primary axon and all its collaterals were also traced (data not shown). Once all labeled dendrite and axon segments were traced in single sections and their synapses marked, we reconstructed the whole neuron by manually splicing dendrite and axon pieces through serial sections.
Figure 2.
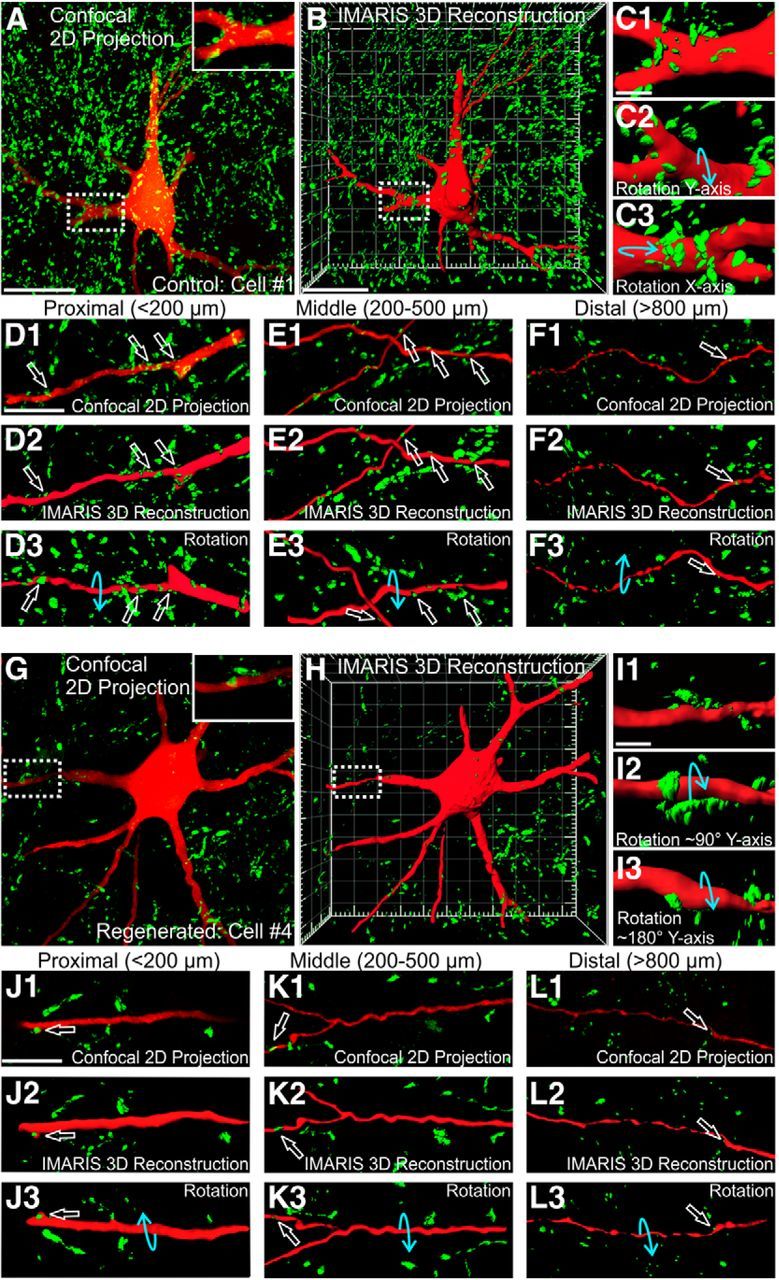
VGLUT1-IR contacts on cell bodies and different proximo-distal segments of dendrites. A, 2D projection image of all VGLUT1-IR boutons contained in 10 confocal planes through the cell body of a control MN (obtained at 1 μm z-steps). B, Imaris 3D reconstruction of the full volume (75 μm thick) of the field-of-view shown in A. Note that in 3D projection views VGLUT1-IR contacts behind the filled cell body and dendrites are hidden. C, High-magnification Imaris 3D rendering of the primary dendrite boxed in A and B. C1–C3, A display of this dendrite segment in three rotations in the directions indicated by the blue arrows. Rotations confirm VGLUT1-IR contacts from all directions. D, VGLUT1-IR contacts (open white arrows) on a relatively proximal dendrite branch (<200 μm from the cell body) shown as 2D confocal projection (D1), IMARIS 3D rendered with no rotation (D2), and a 180° rotation in the y-plane (D3). E, F, Similar image sequence but in dendrite branches located in mid-regions (200–500 μm from the cell body, E) or quite distally (>800 μm; F). Distal branches frequently become varicose. There is a reduction in the number of VGLUT1-IR contacts (open white arrows) from proximal to distal dendrite segments. G–L, Confocal 2D projection and Imaris 3D rendered images in different rotations of a regenerated MN showing VGLUT1-IR contacts (open white arrows) on the cell body and dendrite segments at different distances from the cell body. There is a large loss of synapses in regenerated MNs that is more pronounced around the cell body and proximal segments. Scale bars: A, B, G, H, 50 μm; C, I, 10 μm; D, J, E, F, K, L, 50 μm.
Analyses.
The traced neurons and their synaptic markers were analyzed using Neuroexplorer (v10.0, Microbrightfield) and several custom made MATLAB (MathWorks) programs kindly donated by the laboratory of Dr P. Kenneth Rose (Queen's University in Kingston, ON, Canada). All basic morphological features were measured. Cell body: surface, volume, aspect ratio, and maximum, minimum, and average diameters. Dendritic arbor: number of primary dendrites, and for each dendrite or all dendrites combined we calculated the overall surface, total length (pathlengths of all dendritic branched added), number of branches and dendrite segments, number of dendrites of different order, maximum path distance from the cell body, and maximum branch order (see Table 2). Dendrograms were constructed in Neuroexplorer for each dendrite. Only the most relevant measurements and analyses are reported. Two dendrograms are presented as examples (see Fig. 4).
Table 2.
Morphological properties of the cell bodies and dendrite arbors
| Control cell #1 | Control cell #2 | Control cell #3 | Regen cell #4 | Regen cell #5 | Regen cell #6 | Average control (SD) | Average regen (SD) | p Value* | |
|---|---|---|---|---|---|---|---|---|---|
| Soma | |||||||||
| Maximum dia (μm) | 54.5 | 56.2 | 52.1 | 56.8 | 41.9 | 46.5 | 54.3 ± 2.1 | 48.4 ± 7.6 | 0.27 |
| Minimum dia (μm) | 27.2 | 23.7 | 23.0 | 34.6 | 30.3 | 32.0 | 24.6 ± 2.2 | 32.3 ± 2.2 | 0.01* |
| Mean dia (μm) | 36.1 | 36.7 | 34.5 | 45.4 | 36.5 | 37.0 | 35.8 ± 1.1 | 39.6 ± 5.0 | 0.26 |
| Surface area (μm2) | 6,371.2 | 5,645.3 | 5,878.6 | 6,134.7 | 1,2981.8 | 7,768.45 | 5,965.0 ± 370.6 | 8,961.6 ± 3576.1 | 0.22 |
| Volume (μm3) | 34,952.8 | 29,838.6 | 26,505.1 | 38,212.4 | 40,942.0 | 45,814.5 | 30,432.2 ± 4,255.0 | 41,656.3 ± 3,851.1 | 0.03* |
| Dendrites | |||||||||
| Total length (μm) | 54,295 | 57,670 | 55,035 | 43,125 | 53,103 | 45,383 | 55,667 ± 1,774 | 47,203 ± 5,232 | 0.06 |
| Surface area (μm2) | 197,772 | 212,362 | 203,311 | 220,915 | 258,011 | 249,239 | 204,482 ± 7,365 | 242,722 ± 19,388 | 0.03* |
| Volume (μm3) | 80,320 | 94,431 | 74,422 | 127,273 | 134,535 | 143,630 | 83,057 ± 10,281 | 135,146 ± 8,196 | 0.002* |
| No. 1st Order dendrites | 7 | 8 | 6 | 8 | 10 | 11 | 7.0 ± 1.0 | 9.7 ± 1.5 | 0.06 |
| No. Segments | 226 | 228 | 250 | 196 | 299 | 241 | 234.7 ± 13.3 | 213.3 ± 51.6 | 0.74 |
| No. Branch points | 125 | 109 | 121 | 93 | 141 | 114 | 118.3 ± 8.3 | 116.0 ± 24.1 | 0.88 |
| No. Endings | 135 | 118 | 128 | 102 | 157 | 126 | 127.0 ± 8.5 | 128.3 ± 27.6 | 0.96 |
| Maximum branch order | 11 | 9 | 10 | 10 | 10 | 9 | 10.0 ± 1.0 | 9.7 ± 0.6 | 0.65 |
*Mann-Whitney Wilcoxon test.
All values were obtained after shrinkage correction. Regen, Regeneration; dia, diameter.
Figure 4.
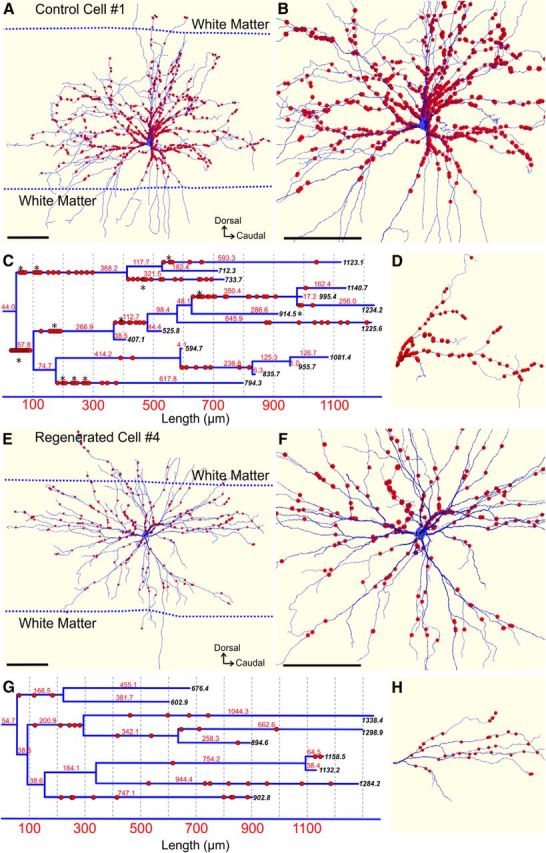
VGLUT1-IR synapses are lost along the dendrites of injured MNs; they also become declustered and more homogeneously distributed. A, B, 3D reconstruction of a control MN (Cell #1) with all VGLUT1-IR contacts marked as red dots. The white matter borders at the level of the cell body section are indicated with dashed lines. White matter dendrites receive almost no VGLUT1 synapses. Most VGLUT1-IR contacts are concentrated proximally and B shows a close-up better illustrating their very high density in this region. C, D, Dendrogram in C of the dendrite shown in D.Numbers in black italics display the distance in micrometers to the dendrite ends. Numbers in red indicate the length in micrometers of each dendritic branch. VGLUT1-IR synapses (red dots) are distributed throughout the dendrites but with a higher concentration proximally. VGLUT1-IR synapses are highly clustered (asterisks). Clusters include a larger number of VGLUT1-IR synapses and are more frequent in the more proximal dendrites. E, F, 3D reconstruction of an injured MN after muscle reinnervation (Cell #4) with its complement of VGLUT1-IR contacts (red dots). The close-up of proximal dendrites in E best reveals the significant loss of VGLUT1-IR synapses in this region. G, H, Dendrogram in G of dendrite shown in H. The dendrogram shows a loss of VGLUT1-IR contacts proximally, such that now they occur at a lower density and more uniformly along the dendrite. In addition, clusters of VGLUT1-IR contacts (i.e., >2 contacts spaced by <2–3 μm) are not present. Scale bars: A, B, E, F, 250 μm.
The distribution of synapses was analyzed by obtaining the following measurements. (1) Overall VGLUT1 synaptic densities on dendrites and cell bodies were calculated by dividing the total number of synapses by the total dendritic or cell body surface. (2) VGLUT1 proximo-distal distributions were obtained by calculating total number of contacts, the total length, and the total available membrane of all dendrite segments at defined dendrite path distances from dendrite origins. Data were binned at 50 μm increasing distances to obtain a distribution of either linear (length) or surface density along the dendrite. (3) Sholl analysis was used to further test VGLUT1 distributions along dendrites. For this purposes a series of concentric nested spheres were placed around the cell body to segment the dendritic arbor in 50 μm bins of incremental radial distance from the center of the cell body. The total number of synapses and the overall length and/or surface of all dendrite segments contained in each Sholl bin were used to estimate the density of contacts according to dendritic length (linear) or surface area. (4) To analyze the clustering or spread of synapses a “nearest-neighbor” analysis was performed. Differences in next-neighbor distances provided an estimate of the spread of synapses in different regions of the dendritic arbor. (5) A center of mass analysis (COM) as reported by Grande et al. (2005) and Montague et al. (2013) was performed to test whether VGLUT1 synapses on control and injured MNs were randomly placed according to the distribution of available dendritic surface or if on the contrary VGLUT1 synapses displayed preferential placements on dendritic arbors.
Finally, we noted that VGLUT1-IR contacts remaining in regenerated MNs were smaller (particularly in the more proximal regions) than distally. Therefore, we divided each MN in three Sholl bins, proximal (<300 μm), midregion (300–600 μm), and distal (>300 μm), and measured ∼50 VGLUT1-IR contacts per dendritic compartment and per cell. We outlined each VGLUT1-IR cluster and measured their areas and ferret diameters, but given the complexity of the VGLUT1-IR cluster, we only analyzed their total area. It should be noted that the VGLUT1-IR cluster is a representation of the presynaptic vesicle cluster and not of the full synaptic bouton, as shown using intracellular fills of IA afferent fibers in Alvarez et al. (2011).
Statistics.
All statistical tests were made using SigmaStat 12 (Jandel) and curve fitting was performed with Clampfit 10.2 (Molecular Devices). When possible, we used parametric comparisons based on t tests (for pair comparisons, i.e., control vs regenerated groups) or ANOVA (multiple comparisons, i.e., individual motoneurons, different motoneuron compartments). If normality was not fulfilled due to small sample sizes, we used Mann–Whitney Wilcoxon rank sum tests. Proportions were compared using Fisher's exact tests. Non-normally distributed samples were organized in cumulative probability functions and compared using Kolmogorov–Smirnov tests. Statistical significance was set at p < 0.05. Curve fitness was tested with standard regression.
Results
Basic physiological and morphological properties do not differ between control and regenerated motoneurons
Six adult MG MNs (control, Cells #1–3; regenerated, Cells #4–6) were identified in vivo, recorded intracellularly, filled with neurobiotin, and successfully recovered histologically with their entire dendritic arbors fully labeled (see Materials and Methods; Fig. 1). Another control MN (Cell #7) was only partially filled with neurobiotin. This cell was not fully reconstructed, but used to confirm the precision of synapse identification using VGLUT1 immunoreactivity (see below). Rats in the regenerated group underwent complete TN transection followed by immediate rejoining of the nerve to facilitate nerve regeneration and muscle reinnervation (Alvarez et al., 2011). MNs were recorded and labeled ∼1 year after surgery, therefore, well after peripheral nerve regeneration and muscle reinnervation was completed. Reinnervated MG muscles recovered their original wet weight and readily contracted after electrical stimulation of the regenerated tibial nerve. No significant differences in action potential (AP) delay, resting membrane potential, AP amplitude, rheobase, input resistance, AHP amplitude, and AHP half-decay were detected between control and regenerated MNs (Fig. 1C,D; Table 1). These parameters were also similar to rat MG MNs analyzed previously and confirmed the restoration of electrical properties after MNs successfully reinnervate muscle (Haftel et al., 2005; Bichler et al., 2007; Bullinger et al., 2011).
Table 1.
Electrical properties of control and regenerated motoneurons
| Cell | Delay (ms) | Vm (mV) | AP Amp (mV) | Rheobase (nA) | Rin (MΩ) | AHP Amp (mV) | AHP Half-decay (ms) |
|---|---|---|---|---|---|---|---|
| Regen cell #4 | 1.7 | 60 | 79 | 12 | 2.9 | 1.0 | 13.2 |
| Regen cell #5 | 1.6 | X | 63 | 4 | 2.6 | 1.9 | 10.5 |
| Regen cell #6 | 1.5 | 62 | 78 | 7 | 2.0 | 0.8 | 8.7 |
| Control cell #1 | 1.5 | 70 | 73 | 9 | 1.6 | 1.1 | 9.2 |
| Control cell #2 | 1.6 | 68 | 72 | 10 | 1.4 | 1.4 | 6.6 |
| Control cell #3 | 1.6 | 62 | 72 | 13 | 3.3 | 0.4 | 7.8 |
| Control cell #7 | 1.7 | 60 | 66 | 4 | 4 | 2.5 | 17 |
| Control-average (n = 4) | 1.6 ± 0.1 | 65.0 ± 4.8 | 70.8 ± 3.2 | 9.0 ± 3.7 | 2.6 ± 1.3 | 1.4 ± 0.9 | 10.2 ± 4.7 |
| Regen-average (n = 3) | 1.6 ± 0.1 | 61.0 ± 1.4 | 73.3 ± 9.0 | 7.7 ± 4.0 | 2.5 ± 0.8 | 1.2 ± 0.6 | 10.8 ± 2.3 |
| p Value* | 1.000 | 0.329 | 0.662 | 0.670 | 0.941 | 0.851 | 0.836 |
*Student's t test.
Regen, Regeneration.
After obtaining these electrophysiological data, the spinal cord blocks containing recorded neurons were sectioned in a parasagittal plane (Fig. 1B). The sections were collected serially and immunostained for VGLUT1. Neurobiotin-labeled dendrite segments were sometimes located >1.5 mm apart from the cell body, therefore to image all labeled MN dendrites at a magnification high enough (60× objective) to resolve VGLUT1-IR contacts we used a motorized stage and automatic tiling of sequential confocal image stacks to fully image areas up to 2.5 mm2 in single sections (up to 42 tiles of confocal image stacks). The tiled images were imported into Neurolucida for section reconstruction and 3D tracing. All labeled dendrite segments in each vibratome section were manually traced throughout all confocal optical planes (1 μm z-steps). The full dendritic arbor was reconstructed by stitching all traced dendrite segments through serial sections (from 13 to 20 sections per neuron) and then corrected for z-axis shrinkage. MN cell bodies were reconstructed as a series of contours traced at all confocal optical planes. The cell bodies, with one exception, were fully contained within the thickness of single vibratome sections.
All MN cell bodies were located in spinal lumbar segments 4 and 5 (Fig. 1E,F), as previously described for the rat triceps surae motor pool (Nicolopoulos-Stournaras and Iles, 1983; Chen and Wolpaw, 1994). Each cell body extended 6–11 primary dendrites with processes up to 1.77 mm from origin (i.e., Cell #4). Dendrites were filled all the way to their terminal segments which displayed the characteristic beaded varicosities with thin intervaricose connections (<0.5 μm diameter) that are typical of MN distal dendrite endings (Ulfhake and Kellerth, 1981; Fig. 2F–L). All six reconstructed MNs had dendritic branches that penetrated into the white matter, both ventrally and in a lateral orientation (see Figs. 4, 7, 8). The amount of dendrite in the white matter appears dependent on the relative positions of the cell body to the white matter border. It should be noted that in our parasagittal planes of cut the ventral white matter border is accurately defined, but the exact position of the lateral border and the points of entry of laterally directed dendrites are more ambiguous. This prevented us from calculating the exact proportions of dendritic surface and length located in the white matter for each of the cells.
Figure 7.

COM analyses reveal a preferential loss of VGLUT1-IR in ventrolateral quadrants of the dendritic trees. A–N, COM analyses in, respectively, a control (Cell #2) and a regenerated MN (Cell #4). A, B, Neurolucida reconstruction of control MN Cell #2 and its VGLUT1-IR contacts in the original parasagittal plane (A) and rotated 90° into a transverse plane (B). Dashed lines indicate the position of the white matter borders at the level of the section containing the cell body. C, 3D plots showing the position of the COM calculated from the distribution of VGLUT1-IR contacts (red star), the COMs of a thousand random synaptic distributions (gray dots), and the average of these random COMs (blue star). The cell body center has (0,0,0) coordinates and positive values indicate respectively caudal, dorsal, and medial to the cell body. In this particular cell, the COM calculated from the VGLUT1-IR synapse distribution is slightly more dorsal than random synapse distributions, but it is in approximately the same rostrocaudal and mediolateral coordinates. D, Represents the location of the VGLUT1-IR contact COM (red star) and the average COM of the random synaptic distributions (blue star) on a transverse view of the dendritic arbor. E–G, Cum–sum plots of the rostrocaudal (E), dorsoventral (F), and mediolateral (G) coordinates of the thousand random synaptic distributions with the locations of the observed and average random COM coordinate (blue star). The cumulative probability of the VGLUT1-IR synapse distribution COM x, y, and z coordinates is calculated by interpolation to the cum–sum curve. The probability that the observed COM is different to the computer generated random COM coordinates is equal to two times (two-tail test) the y-coordinate value if this value is <0.5 or 1 minus the y-coordinate if the COM coordinate value is >0.5 (Montague et al., 2013). In Cell #2, a significant difference for observed COM coordinates was only found for the dorsoventral position, which is more positive, and thus more dorsal than expected for a random distribution of synapses. H, I, Parasagittal and transverse views of regenerated MN Cell #5. Note a bundle of dorsomedially directed dendrites with more VGLUT1-IR contacts than dendrite segments traveling in other quadrants. J, Locations in space of random synaptic distributions COMs, their average COM, and the COM calculated for the VGLUT1-IR contact distribution. In this case, the observed COM is clearly more dorsal and medial than the random distributions. K, Locations of the VGLUT1-IR contact distribution COM (red star) and the random distributions average COM (blue star). L–N, Cum–sum plots used to calculate probabilities. In Cell #5 the observed distribution of VGLUT1-IR synapses is significantly more dorsal and medial than expected for random distributions.
Figure 8.
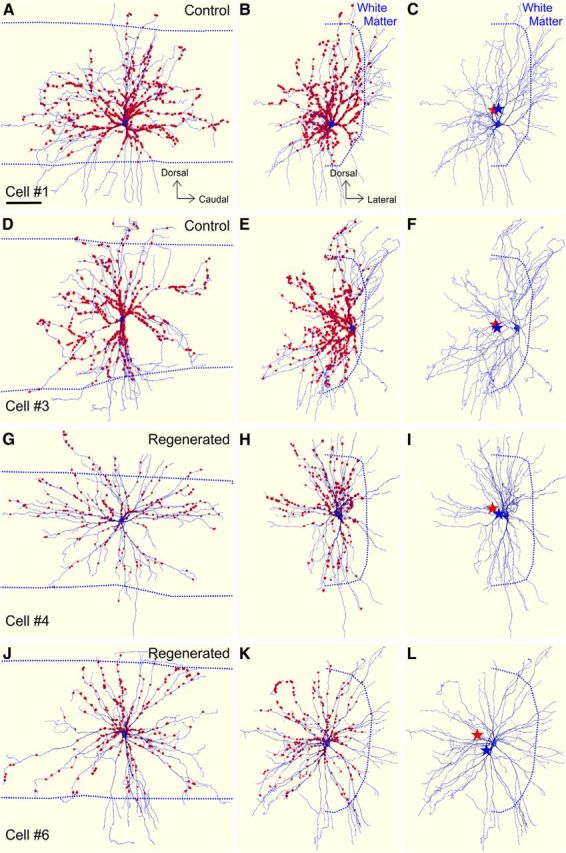
The COM of VGLUT1-IR synaptic distributions moves to dorsomedial positions in regenerated MNs. A, D, G, J, Neurolucida reconstructions of controls and regenerated MNs in their original longitudinal orientation and with all VGLUT1-IR contacts plotted. B, E, H, K, Rotation showing the same MNs and the distribution of VGLUT1-IR contacts in the transverse plane. C, F, I, L, Transverse view of the cells with VGLUT1-IR contact removed for better visualization of the dendritic tree. The calculated COM for the VGLUT1-IR contact distribution (red stars) and the average random synaptic COM (blue stars) are indicated. In all panels, dashed lines indicate the position of the white matter. In control MNs both COMs are close together, with a slight shift of the VGLUT1-IR COM that is in part depended on the amount of dendritic surface placed in white matter and that largely did not receive any VGLUT1-IR contacts. Because distal dendrites are usually small in relation to the total size of the neuron, they contribute little surface and therefore the shifts are small but can be statistically significant (Table 3). In both regenerated MNs, the VGLUT1-IR synaptic distribution moves dorsomedially with respect to random synaptic distributions in the available dendrite surface.
Overall morphological characteristics were compared between reconstructed control and regenerated MNs to determine any structural change that could influence synaptic densities or distributions (Table 2). The average mean soma diameter of regenerated MNs was slightly larger than in controls. This small difference did not reach statistical significance, but was related to a more rounded cell body shape after injury (compare Figs. 2A and G). Thus, although maximum soma diameters did not significantly change, minimum soma diameters significantly increased in regenerated MNs (p = 0.013, t test) and therefore aspect ratios (maximum diameter/minimum diameter) decreased significantly from 2.2 ± 0.2 in control MNs to 1.5 ± 0.1 in regenerated MNs (p = 0.006, t test). This alteration could be the result of the earlier chromatolytic cell body reaction that axotomized MNs undergo to sustain metabolic demands and increase protein synthesis during regeneration (Lieberman, 1971). The change in shape, however, did not significantly (in our samples) affect the somatic surface available for synaptic contacts but did increase significantly total cell body volume (p = 0.03; Table 2).
There were no significant changes in overall dendritic arbor parameters, such as number of first order dendrites, dendrite segments, branch points, or endings (Table 2). Our estimates of dendritic arbor total length and surface in control MG MNs are larger than previously reported by Chen and Wolpaw (1994). These differences could be due to dissimilar proportions in the type of motor units sampled. On average, F-motor units have a larger dendritic arbor than S-motor units (Cullheim et al., 1987), and the relatively brief and low-amplitude AHPs recorded in our control an experimental MNs suggest a sampling bias toward F-type motor units (Deardorff et al., 2013). Alternatively, differences in shrinkage correction, which were not reported in the previous work (Chen and Wolpaw, 1994), might have also contributed to this difference. Total dendritic length (corrected for z-axis shrinkage) decreased in regenerated MNs, on average, by 15% compared with controls (Table 2), but this trend did not reach significance in our relatively small samples (p = 0.06). The maximum dendrite length recorded in each cell was however unchanged and interestingly there was a 12% significant increase in surface area in regenerated MNs (p = 0.03). This increase in surface area is likely due to an overall increase in dendrite thickness and was correlated with a significant increase in dendrite volume. The increase in dendrite surface area was, however, too small to explain the large changes in synaptic densities described below in regenerated MNs.
VGLUT1-IR synapses are lost in injured and regenerated MG motoneurons
The density of VGLUT1-IR synapses decreased in lamina IX regions occupied by the cell bodies and dendrites of regenerated MNs (Fig. 1G,H), suggesting a decreased overall input, as previously reported (Alvarez et al., 2011). VGLUT1-IR contacts occurred on the cell body, proximal and distal dendrites (see Figs. 2, 4). VGLUT1-IR contacts were defined as punctae touching neurobiotin-filled dendrites or cell bodies. “Contacts” were confirmed, when necessary, in three-dimensional views (Fig. 2) and mapped throughout the dendritic arbor (see Fig. 4). To establish their synaptic nature, control Cell #7 was dually immunostained for VGLUT1 and bassoon, an active zone presynaptic protein (tom Dieck et al., 1998; Nishimune et al., 2004). Of 65 VGLUT1-IR contacts sampled on MN dendrites, 95.4% displayed a bassoon-IR active zone between dendrite and VGLUT1-IR, as revealed by fluorescence intensity profiles along lines drawn orthogonal to VGLUT1-IR contacts (Fig. 3). This test population of VGLUT1-IR, contacts was sampled from dendrites of different sizes and distances from the cell body. We conclude that with very few exceptions, contacts indeed represent synaptic sites. This particular MN was not fully reconstructed because neurobiotin labeling was incomplete.
Control MNs received an average of 911.0 ± 104.3 (±SD) VGLUT1-IR contacts over the entire dendritic arbor and an average of 25.0 ± 12.2 on the cell body. Cells #1–2 received a comparable number of VGLUT1-IR contacts (Cell #1 = 941; Cell #2 = 997), whereas control Cell #3 had a lower number (Cell #3 = 795). Interestingly, the cell body of Cell #3 was located more laterally than the other two; this resulted in a larger portion of the dendritic arbor in the white matter (see Fig. 8D–F). Dendrites in the white matter received very few VGLUT1-IR contacts. Therefore, the dendritic surface located in the gray matter and that is available to receive VGLUT1-IR synapses was lower in Cell #3 compared with the other two control MNs (note that in this and other figures the border between white and gray matter is drawn at the plane of the cell body and can slightly change its exact position in other planes; thus, most VGLUT1-IR contacts close to this border in the 2D projection are in fact in the gray matter).
There were fewer VGLUT1-IR contacts on regenerated MNs (Cells #4–6). On average they received 350.3 ± 79.5 VGLUT1-IR contacts (61.6% depletion from controls, p = 0.001, Student's t test). This depletion was larger than previously estimated when analyzing dendrites contained within single 50-μm-thick sections oriented in the transverse plane (Alvarez et al., 2010, 2011). The most likely explanation is that the longitudinal orientation used in present analyses, coupled with obtaining full reconstructions, allowed sampling a larger proportion of dendrites contained in lamina IX, where the greatest loss of IA afferent synapses occurs. Further support for this explanation comes from Cell #5 which extended the largest number of medially directed dendrites into LVII and retained the largest number of contacts in the regenerated group (442 compared with Cell #4 = 301 and Cell #6 = 308). The cell body of regenerated MNs also showed a large decrease in contacts with an average of 3.3 ± 2.1 VGLUT1 contacts per MN (p = 0.03; 86.8% fewer vs control values). Next, we examined the distribution of synaptic losses on the dendritic arbor.
VGLUT1 contacts accumulate on proximal dendrites
The distribution of VGLUT1-IR synapses over the dendritic arbors of MNs has not been reported before. Contrary to previous conclusions on the distribution of IA afferent synapses on MNs based on horseradish peroxidase (HRP) intra-axonal fills (Burke and Glenn, 1996), VGLUT1-IR contacts were found nonuniformly distributed on the dendrites of control MNs, with the highest numbers located proximal to the cell body (Figs. 4A–D, 5A,B, 6A,C,D). In addition, proximal VGLUT1-IR contacts were frequently clustered in groups, as shown more clearly in individual dendrograms (Fig. 4C).
Figure 5.

Quantification of VGLUT1-IR contact proximo-distal distribution in control and regenerated MNs. A, Absolute number of VGLUT1-IR contacts found at different dendrite path distances from dendrite origins. Each cell is plotted separately. Most VGLUT1-IR synapses on control MNs occur adjacent to the cell body and then decrease in number with increased distance to the cell body. In contrast, similar numbers of VGLUT1-IR synapses are found at different distances on the dendrites of regenerated MNs, up to ∼1000 μm distance from dendrite origins. In both control and regenerated MNs relatively few VGLUT1-IR synapses are found at distances beyond 1000 μm. B, Average cumulative distributions of VGLUT1-IR synapses along the dendritic arbor of control and regenerated MNs. Up to 1000 μm in the dendritic arbor (vertical line) the distribution of synapses in control MNs is best fitted by a single exponential function (R2 = 0.99), suggesting a progressive decay in number of synapses with distance. In contrast, the distribution of synapses in regenerated MNs was well fitted by a linear polynomial function (R2 = 0.97) with no fit improvement using exponential functions. This suggests a rather uniform distribution. C, Distribution of dendritic lengths at different distances from the cell body is best described by Gaussian curves with peaks between 500 and 700 μm path distance, where the maximum number of branches are concentrated. Curves describing regenerated MNs are always slightly below that of controls at all distances, but overall this decrease was not significant (Table 2). Insets show the cumulative distribution of total dendritic length in control versus regenerated MNs. Both distributions closely overlap indicating that the relative proportions of dendritic segments at different distances from the cell body did not vary. D, Distributions of dendrite surfaces is shifted to the left compared with dendrite length because proximal dendrites are thicker and display larger surfaces. In contrast to the distribution of dendritic length, surface curves in experimental MNs were frequently above those from controls. This was due to an increase in dendrite thickness, particularly in the more proximal regions, that was reflected in very significant increases in total dendrite volume (Table 2). However, the overall distribution of dendrite surface or their cumulative percentage distribution (inset) did not reveal differences between control and injured MNs. E, Linear density of VGLUT1-IR contacts (i.e., number of VGLUT1-IR contacts per 100 μm of dendrite length) in the three control and three regenerated MNs. In control MNs VGLUT1-IR contact density is very high adjacent to the cell body (x = 0) and then declines abruptly, becoming lower and more uniform after ∼400 μm path-distance from dendrite origins. In regenerated MNs, a lower more uniform density is registered throughout the dendritic arbor. F, Surface densities (i.e., number of VGLUT1-IR contacts per 100 μm2 of dendrite area) reveal a similar pattern. In this case, the decrease in density with distance on control MNs is partially offset by dendritic tapering (which reduces available surface and thus partially compensate for the decrease in synapse number per unit length of dendrite). In regenerated MNs, the density is low and uniform throughout the dendrite arbor. Beyond 1000 μm the estimates of VGLUT1-IR contact surface densities became highly variable because the number of dendritic segments in the gray matter is reduced and the extreme tapering provokes large variations in calculated densities from just a few synapses. Inset, The average of control and experimental MN densities normalized against a uniform density calculated from the total number of synapses and dendritic lengths in each cell. Although in control MNs densities greatly differ from the uniform average density (line at y = 1), in regenerated MNs densities fluctuate around the uniform distribution throughout the total length of the dendritic arbor.
Figure 6.
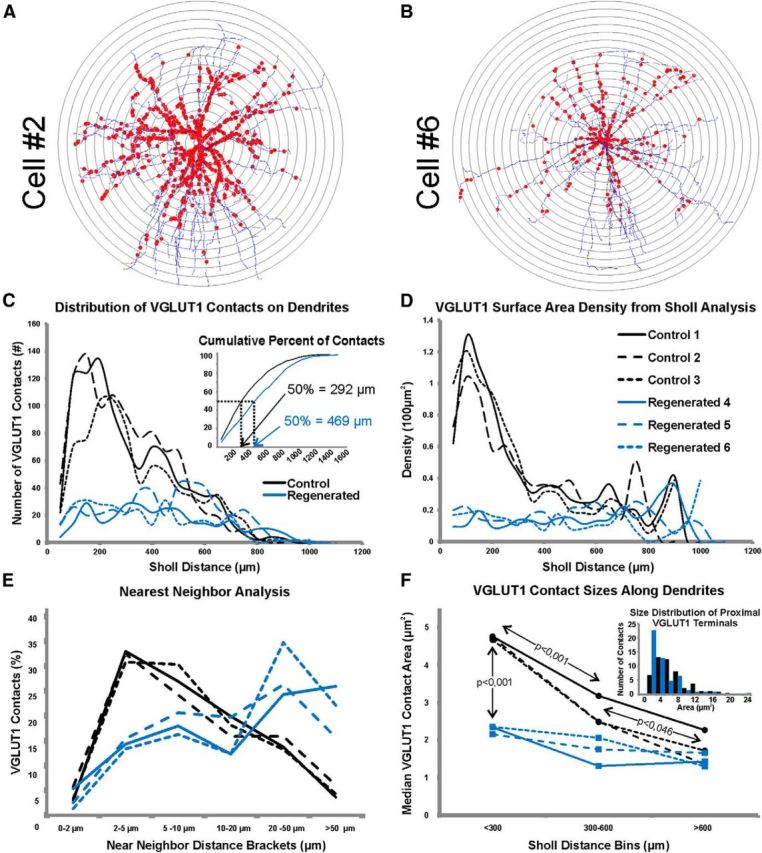
Sholl analyses also reveals a proximal bias in VGLUT1-IR contacts in control MNs and a preferential loss of proximal synapses in regenerated MNs. A, B, Representation of Sholl bins placed on a control MN (Cell #2; A) and an injured and regenerated MN (Cell #6; B). The analyses were performed three-dimensionally so that each Sholl circle represents a sphere of increasing 50-μm-radial distances from the center of the cell body. The dendritic length, surface and number of VGLUT1-IR contacts contained within each Sholl distance bin is then calculated. C, Distribution of VGLUT1-IR contacts in different Sholl bins. Most VGLUT1-IR contacts in control MNs are located close to the cell body and therefore in the first few Sholl bins, thereafter they gradually decrease in number with increasing Sholl distance. In regenerated MNs the numbers of VGLUT1-IR contacts remain relatively constant in all Sholl bins up to 800 μm radial distance from the center of the cell body. Inset shows the cumulative distributions of VGLUT1-IR contacts. The positions corresponding to 50% of terminals are indicated. D, Distribution of surface densities according to Sholl distances. In control MNs, the surface density abruptly decrease proximo-distally, whereas in regenerated motoneurons surface density is low and relatively constant in all Sholl bins. E, Near-neighbor analyses. The graph represents the percentage of VGLUT1-IR contacts with a near neighbor located within the distance brackets indicated in the x-axis. Distances are calculated as path-distance along the dendrite from the center of the apposition between VGLUT1-IR contact and dendrite for each synapse. The majority of VGLUT1-IR contacts in all three control MNs have near neighbors located between 2 and 5 μm. Gradually longer near-neighbor distances were found in progressively fewer VGLUT1-IR contacts in control MNs. In contrast, the nearest-neighbors of most VGLUT1-IR contacts in regenerated MNs were located at distances of 20 μm or more along the dendrite. F, VGLUT1-IR contacts significantly decreased in size in all three control MNs (black lines) with increasing distances to the cell body. Indicated are p values for Bonferroni corrected t tests comparing the average median values of VGLUT1-IR area from contacts sampled proximally (<300 μm Sholl bin), in mid-regions (300–600 μm), or distal (>600 μm) on dendrites of control MNs. In regenerated MNs (blue lines), the size of VGLUT1-IR contacts decreased and this was most dramatic in proximal regions where they become approximately half the size of controls (p < 0.001). This decrease in size of proximal VGLUT1-IR synapses abolished in regenerated MNs the size gradient according to VGLUT1-IR contact location. Differences in VGLUT1-IR size between control and regenerated MNs in mid and distal dendrite regions were not significant. Inset indicates the size distribution of VGLUT1-I contacts on the proximal dendrites of control (black bars) and regenerated (blue bars) MNs. In regenerated MNs, there is an increase in the number of small boutons, whereas the skewed tail of VGLUT1-IR contacts toward large sizes disappears (samples consist of 50 boutons measured in the proximal compartment in each of three regenerated and three control MNs).
Proximal dendrites have the largest diameters and thus expose large surface areas available for synaptic inputs (i.e., “synaptic space”). Nevertheless, there were more VGLUT1-IR contacts in proximal dendritic segments than would correspond to their surface area. On average, 50% of all VGLUT1-IR contacts in control MNs were found within the proximal 300 μm of dendrite (calculated as path distance from dendrite origins on the cell body) despite this region representing only 25% of total dendritic surface (Fig. 5A–D). Seventy-five percent of all VGLUT1-IR contacts were accumulated in the first 550 μm of dendrite, representing 56% of the entire dendritic surface. When the number of VGLUT1-IR contacts was divided by the available length of dendrites (linear density) or dendritic surface area (surface density), calculated densities were in both cases larger proximally than distally (Figs. 5E,F). In control MNs, surface densities at 100 μm distance from dendrite origins were, on average, 11.5 ± 0.6 (±SD) VGLUT1-IR contacts per 1000 μm2 and decreased to 4.8 ± 2.2 at a distance of 350 μm. Contact densities decreased further at more distal locations and also became more variable (at 800 μm distance from dendrite origins we calculated on average 2.1 ± 5.7 VGLUT1-IR contacts per 1000 μm2). Even higher variability was found distal to 800 μm because differences in dendrite locations and thicknesses. Whereas distal dendrites running medially toward lamina VII retain many VGLUT1-IR contacts, dendrites entering the white matter, either laterally or ventrally, display few or no VGLUT1-IR contacts (see Figs. 7, 8). In addition, the extreme and variable tapering of distal segments and the fact that fewer dendrite segments are sampled at the most distal regions generates large variability in calculated surface densities, even from a few VGLUT1-IR contacts (Fig. 5F; distances >1000 μm).
Similar conclusions were obtained using Sholl analyses in bins of 50 μm incremental distances from the cell body center (Fig. 6). Close parallelism between path distance and Sholl analyses are expected because MN dendrites fan out linearly in radial directions from the cell body center (Fig. 6A,B) Thus, dendrite segments contained within a radius of 250 μm from the cell body center received, on average, 51% of all VGLUT1-IR contacts (±3%, SD) but represented only 19.7% of the total dendritic surface. Peak numbers of VGLUT1-IR contacts were found in Sholl bins at 100–250 μm distances in different control MNs (Fig. 6C) and in all MNs VGLUT1-IR contact densities diminished from proximal to distal Sholl bins (Fig. 6D). Sholl bins in the first 50–150 μm from the cell body averaged 11.0 ± 1.3 VGLUT1-IR contacts per 1000 μm2 of available surface, while Sholl bins 350–500 μm from the cell body center displayed lower densities, on average 3.2 ± 0.2 (SD) contacts per 1000 μm2. Variability in contact numbers and calculated densities increased, as expected, in more distal Sholl bins.
Proximal VGLUT1 contacts are preferentially lost after nerve injury
Following peripheral nerve injury VGLUT1-IR contacts were reduced in number and reorganized along dendritic arbors. Proximal dendrites were the most affected by synaptic losses (Fig. 4C,D,G,H); ∼77% (±7%, SD) of VGLUT1-IR contacts were lost in the first 300 μm of dendrite in regenerated MNs compared with the control average. The loss was ∼50% (±17%, SD) between 300 and 1000 μm path distances and 12% (±35%, SD) in dendrite segments more distal than 1000 μm (Fig. 4A). The increased variability in calculated percentage losses with increased distance has several explanations. Variable synaptic loses in dendrite mid-regions are best explained by the different territories occupied by dendrites from different cells at 300–1000 μm distance from their origins. Cell #5 displayed the lower loss in this region (31%) because the presence of many dendrite branches directed mediodorsally into LVII (Fig. 7H,I). In contrast, the high variability in very distal segments is better explained by differing numbers of dendrite segments sampled distal to 1000 μm in different neurons.
The proximo-distal differences in the loss of VGLUT1-IR synapses, coupled to the similar amount of available dendrite at different distances from the cell body in control and regenerated MNs (Figs. 5C,D), resulted in more uniform distributions of remaining VGLUT1-IR contacts on regenerated MNs compared with the steep proximo-distal gradients of VGLUT1-IR contact densities in control MNs. Up to 1000 μm distance from dendrite origins linear density estimates ranged from 0.2 to 3.1 VGLUT1-IR contacts per 100 μm in different proximo-distal bins of regenerated MNs (average 0.9 ± 0.5, SD; Fig. 5A,E). Surface densities ranged from 0.6 to 3.3 VGLUT1-IR contacts per 1000 μm2 (average 1.4 ± 0.3, SD; Figs. 5F). The distribution of VGLUT1-IR contacts changed significantly. Whereas the cumulative probability of VGLUT1-IR contacts (up to a 1000 μm distance from the cell body) at increasing distances could be well fitted (R2 = 0.99) by a single exponential in control MNs (i.e., increasingly lower numbers of contacts with distance), in regenerated MNs this was well fitted by a linear polynomial function (R2 = 0.97; i.e., uniform distribution; Fig. 5B). Moreover, when the distribution of VGLUT1-IR contact densities in each cell was normalized to a uniform distribution of average density (Fig. 5F, inset), the distribution in control MNs displayed densities higher than average values up to ∼400 μm path distance and lower than average density more distally. In contrast, the distribution of densities fluctuated around the uniform distribution throughout the dendritic arbor in regenerated MNs. In conclusion, the loss of VGLUT1-IR synapses in regenerated MNs does not result in scaled-down versions of control synaptic distributions, but represents a reorganization of inputs such that the proximal bias is lost and synapses become uniformly distributed. Similar to control MNs, VGLUT1-IR contacts in dendrite regions distal to 1000 μm were rare in regenerated MNs and calculated densities were also highly variable.
Sholl analyses lead to the same conclusion (Fig. 6B). We identified three Sholl bins as roughly comparable to dendrite regions analyzed by path distance and designated them proximal (<300 μm Sholl bins), middle (300–600 μm), and distal (>600 μm). We found an 80% depletion of VGLUT1-IR contacts within Sholl bins in the first 300 μm (Fig. 6C). Sholl bins located between 300 and 600 μm showed depletions of 35.9–63.3%, with Cell #5 again having the lowest percentage depletion. In regions >600 μm, Cells #4–5 showed, respectively, 13.6 and 15.9% percentage depletions. However, Cell #6 showed 59% fewer VGLUT1-IR contacts but this cell also displayed a shorter total dendrite length in this region. Similar to above, the changes in VGLUT1-IR contact numbers resulted in greatly diminished densities in proximal regions and in a low uniform density along Sholl distance bins (Fig. 5D).
VGLUT1 contact groupings are dispersed after peripheral nerve injury
Dendrograms revealed a decreased incidence of clusters of VGLUT1-IR synaptic contacts in regenerated MNs (Fig. 4C,G). Where clusters did occur they contained fewer numbers of VGLUT1-IR contacts. A “near-neighbor” analysis was used to calculate the dendrite distance from each VGLUT1-IR contact to its closest neighbor and plot the frequency of contacts against their nearest neighbor distances (Fig. 6E). Control MNs had the highest numbers of VGLUT1-IR contacts (36% ± 2) with nearest neighbors at a distance of 2–5 μm from their respective centers of apposition with the dendrite. Given that many VGLUT1-IR contacts are quite large (>2 μm apposition along the dendrite), this implies that most of these terminals are tightly clustered. Most of these clusters occurred relatively proximal, whereas more distal VGLUT1-IR contacts were more dispersed. In contrast, only 17% ±3 of VGLUT1-IR synapses on regenerated MNs had a near-neighbor at <5 μm distance. When this did occur, it usually consisted of just two closely located synapses, whereas control MNs clusters always include >2 synapses. In regenerated MNs the majority of VGLUT1-IR contacts were dispersed, 50% ± 8 had nearest-neighbors at >20 μm distance along the dendrites. In contrast, only 19% ± 3 of VGLUT1-IR contacts in control MNs were this isolated.
We also noted that the remaining VGLUT1-IR contacts appeared smaller on regenerated MNs compared with controls and that in controls there was a proportion of very large synapses located on proximal dendrites. Therefore, we randomly measured in each cell 50 VGLUT1-IR contacts in each of the three different Sholl bins defined above (proximal, middle, distal). As shown previously (Alvarez et al., 2011), VGLUT1-immunofluorescence delimits the clusters of presynaptic vesicles and it is not identical to the full bouton size. This is because there are areas inside the boutons occupied by neurofilaments and mitochondria that are unlabeled by VGLUT1-immunofluorescence. Therefore, immunolabeled VGLUT1-IR synaptic vesicle clusters are frequently convoluted and have tortuous surfaces and for that reason are best described by their areas. Interestingly, in control MNs the distribution of areas is highly skewed because the presence of a proportion of very large VGLUT1-IR clusters concentrated in the proximal dendrites of control MNs (Fig. 6, inset). Thus, we compared their median areas rather than their average size. The average median area of VGLUT1-IR contacts significantly decreased in control MNs (n = 3) from 4.7 ± 0.1 μm2 (±SE) in proximal dendrites to 2.7 ± 0.4 μm2 and 1.8 ± 0.5 μm2 in the middle and distal regions, respectively (Fig. 6; ANOVA p < 0.001; Bonferroni t tests, p < 0.001 between proximal and the two other compartments; p < 0.043 between middle and distal regions). The population of large VGLUT1-IR boutons disappeared in the proximal dendritic arbor of regenerated MNs such that their median area was significantly reduced to less than half of controls (2.3 ± 0.1 μm2 average median VGLUT1-IR cluster area of regenerated MNs; n = 3, p < 0.001 Bonferroni corrected t test). Interestingly, there were no significant differences (p > 0.05) in average median area between the three proximo-distal compartments dendritic compartments in regenerated MNs or between the middle and distal compartments of regenerated MNs compared with controls.
In conclusion, after injury proximal VGLUT1-IR contacts are spread out on the dendrites and they are also reduced in size because of the disappearance of a population of large synapses. The resulting distribution of VGLUT1-IR synapses in regenerated MNs is therefore best described as small size declustered synapses distributed at uniform low-densities throughout the dendrites. This structural reorganization, in addition to the dramatic loss of proximal VGLUT1-IR synapses, likely significantly alters VGLUT1 input strength on regenerated MNs.
VGLUT1-IR contacts show a preference for dendrite territories located dorsomedially with respect to the cell body and this preferred location becomes more apparent after injury
To quantify preferences for VGLUT1-IR contact localization in different dendrite quadrants around cell bodies (i.e., dorsomedial, ventrolateral, rostrocaudal) we used the recently described COM analysis (Grande et al., 2005; Montague et al., 2013). In this analysis each contact is assigned an x (rostrocaudal), y (dorsoventral), and z (mediolateral) coordinate with 0,0,0 representing the center of the cell body. Positive values indicate caudal, dorsal, and medial to the cell body; negative values are rostral, ventral, and lateral to the cell body. Because synapse locations are necessarily affected by the distribution of available synaptic space on dendrites, the observed COMs are compared with synapse distributions generated randomly on the available dendritic arbors. For this purpose we generated 1000 random distributions of the same number of terminals counted for VGLUT1-IR contacts in each cell. The average COM of these random distributions was calculated and compared with the observed COM value to estimate the probability that the observed VGLUT1-IR contacts were randomly distributed (Fig. 7; Table 3).
Table 3.
COM coordinates of VGLUT1-IR synaptic distributions and random synaptic distributions
| Observed COM distance from cell body center (μm) |
Average random COM distance from observed COM (μm)* |
p Value† |
|||||||
|---|---|---|---|---|---|---|---|---|---|
| Rostrocaudal | Dorsoventral | Mediolateral | Rostrocaudal | Dorsoventral | Mediolateral | Rostrocaudal | Dorsoventral | Mediolateral | |
| Control cell 1 | −2.4 | +112.8 | +25.4 | −52.8 | +1.9 | −28.3 | 0.0001 | 0.75 | 0.27 |
| Control cell 2 | −42.8 | −8.4 | +75.6 | +4.8 | −48.4 | +1.2 | 0.60 | 0.0001 | 0.77 |
| Control cell 3 | −27.3 | +27.0 | +161.0 | +20.6 | −15.1 | −19.3 | 0.01 | 0.31 | 0.003 |
| Regen cell 4 | −32.1 | +68.3 | +95.2 | +32.8 | −49.2 | −44.0 | 0.06 | 0.0001 | 0.0001 |
| Regen cell 5 | −23.0 | +21.3 | +227.1 | +1.3 | −94.4 | −191.9 | 0.67 | 0.0001 | 0.0001 |
| Regen cell 6 | −1.9 | +56.8 | +113.5 | +22.6 | −99.4 | −58.1 | 0.06 | 0.0001 | 0.0001 |
*Bold indicates those differences that were statistically different. A negative difference indicates that the COM coordinates of the observed VGLUT1-IR contact distribution were either more rostral, dorsal or medial than the average COM of random synaptic distributions.
†Figure 7 shows the calculation of p values.
Regen, Regeneration.
Observed COMs in control and regenerated MNs suggest a VGLUT1-IR contact bias to dendrite regions located rostrally (6 of 6 cells), dorsally (5 of 6), and medially (6 of 6) to the cell body (Figs. 7, 8), but always close to the cell body (Table 3), suggesting relatively well balanced distributions around the cell body. Differences between observed VGLUT1 and random COM coordinates in control MNs were usually small (≤50 μms) and not significant. When they did differ, the differences were not consistent among the three controls MNs (Table 3) and seem influenced by the cell body position, which in turn affected dendrite availability in different directions and proximity with the white matter. For example, the dorsal distribution of VGLUT1-IR contacts in two control MNs (Cells #1 and 3) with relatively ventral cell bodies and extending more dendrite branches dorsally, did not differ from random distributions. In contrast, Cell #2 had a more dorsal cell body, more dendrite branches directed ventrally and the observed dorsoventral COM coordinate of VGLUT1-IR contacts was significantly more dorsal than random distributions (Fig. 7A–N; Table 3). This could suggest a dorsal bias that might be masked in other MNs because it coincides with more available synaptic space in dorsal dendrites. Analogous topographic considerations explain the medial coordinates of VGLUT1 and random COMs in control MNs. In this case, proximity to the white matter exacerbates the medial bias because lateral dendrites entering the white matter lack VGLUT1-IR contacts and because the proportion of medially directed dendrites and branches increases when the cell body is located more laterally and closer to the white matter. For example, a medial preference of VGLUT1-IR contacts was particularly large in Cell #3 whose cell body was positioned close to the lateral white matter border and extended many medially oriented dendrites (Fig. 8F).
In conclusion, VGLUT1-IR contacts on control MNs displayed a slight bias to dendrite territories located dorsal and medial to the cell body, but this was frequently matched by a larger amount of dendrite surface area in these regions. Whether this bias was significantly different from random synaptic distributions was dependent on the exact position of the cell body and dendrite distributions. A dorsomedial preference makes sense because incoming IA primary afferents from homonymous and close synergistic muscles course from dorsomedial to ventrolateral territories in an ∼45° angle (Ishizuka et al., 1979; Burke and Glenn, 1996). However, the fact that most VGLUT1-IR contacts are located on proximal dendrites likely obscures possible biases imposed by IA afferent trajectories on more distal dendrites.
In regenerated MNs, VGLUT1 COMs were located more dorsally and medially; this was significantly different from random distributions (Figs. 7, 8; Table 3). This result suggests a relatively larger loss of VGLUT1-IR contacts in ventrolateral dendrite territories which fits the suggested progressive retraction of IA afferent branches (Alvarez et al., 2011). Alternatively, a possible dorsomedial bias in contact distribution in distal dendrites might be unmasked by the great loss of proximal synapses surrounding the cell body. It is likely that both effects contribute to the shift of observed COMs to dorsomedial locations after injury. Rostrocaudal distributions of VGLUT1-IR contacts did not change.
In summary, this study demonstrates that injured MNs that successfully regenerate and reinnervate muscle nevertheless lose two-thirds of their VGLUT1 synapses. Moreover, their distribution along MN dendrites changes, such that the remaining VGLUT1 synapses are now smaller, more uniformly distributed along dendrites, declustered, and preferentially preserved in dendrite branches located dorsomedial to the cell body. As discussed below, this reorganization might weaken IA-VGLUT1 inputs on MNs.
Discussion
VGLUT1 synapses concentrate in proximal dendrites
A few studies previously analyzed the distribution of IA synapses on MN dendrites by mapping synapses between IA afferents and MN pairs, both intracellularly labeled with HRP in the cat (Brown and Fyffe, 1981; Redman and Walmsley, 1983a,b; Burke and Glenn, 1996). In these analyses, IA synapses were found widely distributed throughout the dendrites but with scarce somatic and juxtasomatic synapses. Detailed analyses of single IA fibers are lacking in rodents, but our study, using VGLUT1, provides the first analysis of the whole IA input on single rat MNs and by difference to previous conclusions (in cat), we found this input heavily biased toward the proximal dendritic tree. Species differences could explain these different conclusions. Alternatively, these mismatches could be due to undersampling of afferent arbors in HRP studies, as was documented by comparisons with neurobiotin-filled afferents (Koerber and Mirnics, 1995). The study of Burke and Glenn (1996) detected the larger number of synapses and reported on average 8.5 synapses from single IA afferents onto single MNs. If that was the case, the numbers of VGLUT1 synapses we report in rat MNs would predict a disparate large convergence from >100 IA afferents. This is approximately two times the number of IA afferents estimated for triceps surae muscles in rat (Zelená, 1994). VGLUT1 also labels group IB and II synapses, but it is expected that contributions from these afferents will be minor compared with IAs (for review, see Alvarez et al., 2011). In cats, further support for a wide distribution of IA synapses, at low density close to the soma also rests on decades of intracellular recordings of IA-MN EPSPs (Redman, 1979; Fleshman et al., 1988). This conclusion was based on interpretations of EPSP amplitude and rise times expected from passive spread of synaptic currents on dendrites. However, EPSPs produced by single IA afferents activated by muscle stretch in rat and cat MG MNs have similar rise times when recorded in comparable conditions in which passive membrane properties dominate (Mendell and Henneman, 1971; Watt et al., 1976; Bullinger et al., 2011). Assuming that EPSP rise times reflect synaptic location, then the distributions of IA synapses should be similar in cat and rat MNs, ruling out species differences.
Burke and Glenn (1996) also reported that several collaterals from single IA fibers contribute synapses to single MNs. Synapses originated in different collaterals were located far apart on the dendritic arbor, but synapses originated from single collaterals were closely spaced. These are likely represented in our study by clustered VGLUT1-IR synapses frequently linked by weakly immunolabeled intervaricose segments. Interestingly, VGLUT1 synaptic clusters do not exist in distal regions; therefore, a logical conclusion is that IA collaterals targeting proximal dendrites establish several closely spaced synapses, whereas those targeting distal branches establish single isolated synapses. The origins of this organization could be rooted in development. VGLUT1 synapses undergo intense proliferation during early postnatal maturation with differential capacity for generating additional synapses depending on their neuron targets (Siembab et al., 2010). Differential synaptic addition might also occur in different compartments of the MN dendrite. Connections between IA afferents and MNs are initially established in embryo (Chen et al., 2003) before the postnatal maturation of the MN dendritic arbor (Kalb, 1994; Inglis et al., 1998). Proximal IA synapses are therefore formed first, expected to strongly couple with postsynaptic firing in relatively immature MNs with high input resistances and become subject to Hebbian-type strengthening, including de novo formation of synapses (Holtmaat and Svoboda, 2009). This might also result in larger synaptic boutons. In conclusion, the distribution of VGLUT1 synapses might be the result of developmental mechanisms that strengthen IA synapses targeting proximal dendrites and fail to strengthen distal IA synapses. Their distinct impact on MN firing could explain the malfunction of the monosynaptic reflex after nerve injury (Cope et al., 1994; Haftel et al., 2005; Bullinger et al., 2011) or spinal muscular atrophy (Mentis et al., 2011). Both are situations in which there is a large loss of proximal VGLUT1 synapses while preserving distal VGLUT1 synapses.
Significance of VGLUT1 synapses remaining after nerve injury
The loss of proximal VGLUT1 synapses after nerve injury results in a population of VGLUT1 synapses that are not clustered, smaller in size, and are uniformly distributed at low density throughout the dendrites. It is well known that the stripping of synapses from axotomized motoneurons is more intense in proximal somatodendritic regions (Carlstedt and Cullheim, 2000; Cullheim and Thams, 2007) and may be the distributions observed after injury result from this effect. However, we found important differences between the removal of IA synapses and synaptic stripping (Alvarez et al., 2010, 2011). First, lost VGLUT1 synapses are not recovered after regeneration. Second, IA VGLUT1 synapse losses are a consequence of retraction of all IA fiber collaterals from LIX and therefore remaining synapses on LIX dendrites likely originate in nerves other than the injured tibialis nerve, which carries afferents from the homonymous MG and its closest synergists.
Homonymous IA connections are usually stronger than heteronymous IA inputs, and the strength of the latter varies according to the level of synergy between the IA afferent muscle of origin and the target motor pool (Eccles et al., 1957; Webb and Cope, 1992). It is therefore tempting to suggest that the proximal input with many clustered and large synapses is populated by homonymous and close synergist heteronymous connections, whereas distal VGLUT1 synapses (and to a certain extent isolated proximal synapses remaining after nerve injury) might originate from IA inputs less relevant for the MN and that are not involved in generating stretch reflexes from the homonymous muscle or its close synergists. Their sparse distribution probably reflects a weaker influence on MN firing. Nonetheless, some remaining VGLUT1 synapses must originate from injured axons because these are still capable of eliciting electrically evoked EPSPs on MNs (Bullinger et al., 2011). The extensive retraction of IA afferents from LIX suggest these are preferentially located in dorsomedially directed LVII dendrites and likely responsible for biasing the distribution of VGLUT1 synapses after injury to the dorsomedial quadrant above the soma.
Relationship between synaptic reorganizations and IA afferent input strength
The retraction of proximal IA synapses agrees with early studies that found significantly reduced electrically evoked homonymous IA EPSPs on MNs after nerve injury in a large number of different experimental conditions (Eccles et al., 1959; Mendell et al., 1974; Gallego et al., 1980). However, after muscle reinnervation electrically evoked composite EPSPs recovered in amplitude and time course (Gallego et al., 1980; Goldring et al., 1980; Foehring et al., 1986a,b). Although EPSPs produced by regenerated afferents did not fully recover their original amplitude and were smaller than in controls (Mendell et al., 1995), their significant functional recuperation was speculated to be due to synapse restoration (Mendell, 1988), but we confirm here that lost VGLUT1 synapses never recover, as previously suggested (Alvarez et al., 2011). This is in agreement with the permanent loss of the stretch reflex (Cope et al., 1994) and the poor recovery of stretch-evoked EPSPs in MNs (Haftel et al., 2005; Bullinger et al., 2011). One possibility is that injured IA afferents that remain connected to MNs do not reinnervate spindle receptors. Indeed, a proportion of proprioceptive axons fail to reconnect with appropriate receptors (Collins et al., 1988), but partial failure in peripheral reconnection cannot explain the large loss in synaptic transmission of stretch signals from affected muscles (Bullinger et al., 2011).
On the other hand, synaptic reorganizations after nerve injury result in a more distal and sparsely distributed synaptic input that could decrease synaptic efficacy at the cell body. Moreover, it has been shown that synaptic vesicle cluster and bouton size correlate with variables that have significant effects on the synaptic current (Pierce and Mendell, 1993). Weaker synaptic currents and passive electrotonic attenuation should decrease IA input efficacy, but more importantly IA afferent input strength at the cell body strongly relies on amplification from dendritic active conductances known as persistent inward currents (PICs) that increase both the amplitude and time course of IA EPSPs on MNs (Schwindt and Crill, 1980; Hounsgaard et al., 1986; Hounsgaard and Kiehn, 1993; Lee and Heckman, 1998; Carlin et al., 2000; Hultborn, 2002; Heckman et al., 2008). Modeling studies demonstrated the necessity of spatial matching between synaptic inputs and PIC localization for optimal amplification (Elbasiouny et al., 2005; Bui et al., 2006; Grande et al., 2007) and depending on the study, they located PICs in mid-dendrite regions or proximally. It is thus possible that synaptic redistributions after injury might create a spatial mismatch between the localization of IA synapses and PICs. Declustering and smaller synaptic currents might decrease further their efficacy to bring the membrane to PIC activation thresholds in situations in which the input is temporally dispersed (as occurs in response to natural stretch), but not so much after synchronous maximal activation of all remaining IA synapses by maximal electrical volleys. Future modeling studies will be necessary to test these hypotheses.
Footnotes
This work was supported by NIH Program Project Grant P01NS057228. We thank Dr P.K. Rose for helpful discussions and sharing their COM analysis programs, and Lori Goss, Registered Veterinary Technician, for excellent technical assistance during nerve surgeries and veterinary care of the animals.
The authors declare no competing financial interests.
References
- Abelew TA, Miller MD, Cope TC, Nichols TR. Local loss of proprioception results in disruption of interjoint coordination during locomotion in the cat. J Neurophysiol. 2000;84:2709–2714. doi: 10.1152/jn.2000.84.5.2709. [DOI] [PubMed] [Google Scholar]
- Alvarez FJ, Villalba RM, Zerda R, Schneider SP. Vesicular glutamate transporters in the spinal cord, with special reference to sensory primary afferent synapses. J Comp Neurol. 2004;472:257–280. doi: 10.1002/cne.20012. [DOI] [PubMed] [Google Scholar]
- Alvarez FJ, Bullinger KL, Titus HE, Nardelli P, Cope TC. Permanent reorganization of IA afferent synapses on motoneurons after peripheral nerve injuries. Ann N Y Acad Sci. 2010;1198:231–241. doi: 10.1111/j.1749-6632.2010.05459.x. [DOI] [PMC free article] [PubMed] [Google Scholar]
- Alvarez FJ, Titus-Mitchell HE, Bullinger KL, Kraszpulski M, Nardelli P, Cope TC. Permanent central synaptic disconnection of proprioceptors after nerve injury and regeneration: I. Loss of VGLUT1/IA synapses on motoneurons. J Neurophysiol. 2011;106:2450–2470. doi: 10.1152/jn.01095.2010. [DOI] [PMC free article] [PubMed] [Google Scholar]
- Banks RW, Barker D. Specificities of afferents reinnervating cat muscle spindles after nerve section. J Physiol. 1989;408:345–372. doi: 10.1113/jphysiol.1989.sp017463. [DOI] [PMC free article] [PubMed] [Google Scholar]
- Bichler EK, Nakanishi ST, Wang QB, Pinter MJ, Rich MM, Cope TC. Enhanced transmission at a spinal synapse triggered in vivo by an injury signal independent of altered synaptic activity. J Neurosci. 2007;27:12851–12859. doi: 10.1523/JNEUROSCI.1997-07.2007. [DOI] [PMC free article] [PubMed] [Google Scholar]
- Brown AG, Fyffe RE. Direct observations on the contacts made between IA afferent fibres and alpha-motoneurones in the cat's lumbosacral spinal cord. J Physiol. 1981;313:121–140. doi: 10.1113/jphysiol.1981.sp013654. [DOI] [PMC free article] [PubMed] [Google Scholar]
- Bui TV, Ter-Mikaelian M, Bedrossian D, Rose PK. Computational estimation of the distribution of L-type Ca(2+) channels in motoneurons based on variable threshold of activation of persistent inward currents. J Neurophysiol. 2006;95:225–241. doi: 10.1152/jn.00646.2005. [DOI] [PubMed] [Google Scholar]
- Bullinger KL, Nardelli P, Pinter MJ, Alvarez FJ, Cope TC. Permanent central synaptic disconnection of proprioceptors after nerve injury and regeneration: II. Loss of functional connectivity with motoneurons. J Neurophysiol. 2011;106:2471–2485. doi: 10.1152/jn.01097.2010. [DOI] [PMC free article] [PubMed] [Google Scholar]
- Burke RE, Glenn LL. Horseradish peroxidase study of the spatial and electrotonic distribution of group IA synapses on type-identified ankle extensor motoneurons in the cat. J Comp Neurol. 1996;372:465–485. doi: 10.1002/(SICI)1096-9861(19960826)372:3<465::AID-CNE9>3.0.CO%3B2-0. [DOI] [PubMed] [Google Scholar]
- Carlin KP, Jones KE, Jiang Z, Jordan LM, Brownstone RM. Dendritic L-type calcium currents in mouse spinal motoneurons: implications for bistability. Eur J Neurosci. 2000;12:1635–1646. doi: 10.1046/j.1460-9568.2000.00055.x. [DOI] [PubMed] [Google Scholar]
- Carlstedt T, Cullheim S. Spinal cord motoneuron maintenance, injury and repair. Prog Brain Res. 2000;127:501–514. doi: 10.1016/S0079-6123(00)27025-8. [DOI] [PubMed] [Google Scholar]
- Chen HH, Hippenmeyer S, Arber S, Frank E. Development of the monosynaptic stretch reflex circuit. Curr Opin Neurobiol. 2003;13:96–102. doi: 10.1016/S0959-4388(03)00006-0. [DOI] [PubMed] [Google Scholar]
- Chen XY, Wolpaw JR. Triceps surae motoneuron morphology in the rat: a quantitative light microscopic study. J Comp Neurol. 1994;343:143–157. doi: 10.1002/cne.903430111. [DOI] [PubMed] [Google Scholar]
- Collins WF, 3rd, Mendell LM, Munson JB. On the specificity of sensory reinnervation of cat skeletal muscle. J Physiol. 1986;375:587–609. doi: 10.1113/jphysiol.1986.sp016135. [DOI] [PMC free article] [PubMed] [Google Scholar]
- Collins WF, 3rd, Davis BM, Mendell LM. Modulation of EPSP amplitude during high frequency stimulation depends on the correlation between potentiation, depression and facilitation. Brain Res. 1988;442:161–165. doi: 10.1016/0006-8993(88)91445-X. [DOI] [PubMed] [Google Scholar]
- Cope TC, Bonasera SJ, Nichols TR. Reinnervated muscles fail to produce stretch reflexes. J Neurophysiol. 1994;71:817–820. doi: 10.1152/jn.1994.71.2.817. [DOI] [PubMed] [Google Scholar]
- Cullheim S, Thams S. The microglial networks of the brain and their role in neuronal network plasticity after lesion. Brain Res Rev. 2007;55:89–96. doi: 10.1016/j.brainresrev.2007.03.012. [DOI] [PubMed] [Google Scholar]
- Cullheim S, Fleshman JW, Glenn LL, Burke RE. Membrane area and dendritic structure in type-identified triceps surae alpha motoneurons. J Comp Neurol. 1987;255:68–81. doi: 10.1002/cne.902550106. [DOI] [PubMed] [Google Scholar]
- Deardorff AS, Romer SH, Deng Z, Bullinger KL, Nardelli P, Cope TC, Fyffe RE. Expression of postsynaptic Ca2+-activated K+ (SK) channels at C-bouton synapses in mammalian lumbar-motoneurons. J Physiol. 2013;591:875–897. doi: 10.1113/jphysiol.2012.240879. [DOI] [PMC free article] [PubMed] [Google Scholar]
- Eccles JC, Eccles RM, Lundberg A. The convergence of monosynaptic excitatory afferents on to many different species of alpha motoneurones. J Physiol. 1957;137:22–50. doi: 10.1113/jphysiol.1957.sp005794. [DOI] [PMC free article] [PubMed] [Google Scholar]
- Eccles JC, Krnjevic K, Miledi R. Delayed effects of peripheral severance of afferent nerve fibres on the efficacy of their central synapses. J Physiol. 1959;145:204–220. doi: 10.1113/jphysiol.1959.sp006136. [DOI] [PMC free article] [PubMed] [Google Scholar]
- Elbasiouny SM, Bennett DJ, Mushahwar VK. Simulation of dendritic CaV1.3 channels in cat lumbar motoneurons: spatial distribution. J Neurophysiol. 2005;94:3961–3974. doi: 10.1152/jn.00391.2005. [DOI] [PubMed] [Google Scholar]
- Fleshman JW, Rudomin P, Burke RE. Supraspinal control of a short-latency cutaneous pathway to hindlimb motoneurons. Exp Brain Res. 1988;69:449–459. doi: 10.1007/BF00247299. [DOI] [PubMed] [Google Scholar]
- Foehring RC, Sypert GW, Munson JB. Properties of self-reinnervated motor units of medial gastrocnemius of cat: I. Long-term reinnervation. J Neurophysiol. 1986a;55:931–946. doi: 10.1152/jn.1986.55.5.931. [DOI] [PubMed] [Google Scholar]
- Foehring RC, Sypert GW, Munson JB. Properties of self-reinnervated motor units of medial gastrocnemius of cat: II. Axotomized motoneurons and time course of recovery. J Neurophysiol. 1986b;55:947–965. doi: 10.1152/jn.1986.55.5.947. [DOI] [PubMed] [Google Scholar]
- Gallego R, Kuno M, Núñez R, Snider WD. Enhancement of synaptic function in cat motoneurones during peripheral sensory regeneration. J Physiol. 1980;306:205–218. doi: 10.1113/jphysiol.1980.sp013392. [DOI] [PMC free article] [PubMed] [Google Scholar]
- Goldring JM, Kuno M, Núñez R, Snider WD. Reaction of synapses on motoneurones to section and restoration of peripheral sensory connexions in the cat. J Physiol. 1980;309:185–198. doi: 10.1113/jphysiol.1980.sp013503. [DOI] [PMC free article] [PubMed] [Google Scholar]
- Grande G, Armstrong S, Neuber-Hess M, Rose PK. Distribution of contacts from vestibulospinal axons on the dendrites of splenius motoneurons. J Comp Neurol. 2005;491:339–351. doi: 10.1002/cne.20699. [DOI] [PubMed] [Google Scholar]
- Grande G, Bui TV, Rose PK. Effect of localized innervation of the dendritic trees of feline motoneurons on the amplification of synaptic input: a computational study. J Physiol. 2007;583:611–630. doi: 10.1113/jphysiol.2007.134999. [DOI] [PMC free article] [PubMed] [Google Scholar]
- Haftel VK, Bichler EK, Wang QB, Prather JF, Pinter MJ, Cope TC. Central suppression of regenerated proprioceptive afferents. J Neurosci. 2005;25:4733–4742. doi: 10.1523/JNEUROSCI.4895-04.2005. [DOI] [PMC free article] [PubMed] [Google Scholar]
- Heckman CJ, Hyngstrom AS, Johnson MD. Active properties of motoneurone dendrites: diffuse descending neuromodulation, focused local inhibition. J Physiol. 2008;586:1225–1231. doi: 10.1113/jphysiol.2007.145078. [DOI] [PMC free article] [PubMed] [Google Scholar]
- Höke A, Brushart T. Introduction to special issue: challenges and opportunities for regeneration in the peripheral nervous system. Exp Neurol. 2010;223:1–4. doi: 10.1016/j.expneurol.2009.12.001. [DOI] [PMC free article] [PubMed] [Google Scholar]
- Holtmaat A, Svoboda K. Experience-dependent structural synaptic plasticity in the mammalian brain. Nat Rev Neurosci. 2009;10:647–658. doi: 10.1038/nrn2699. [DOI] [PubMed] [Google Scholar]
- Hounsgaard J, Kiehn O. Calcium spikes and calcium plateaux evoked by differential polarization in dendrites of turtle motoneurones in vitro. J Physiol. 1993;468:245–259. doi: 10.1113/jphysiol.1993.sp019769. [DOI] [PMC free article] [PubMed] [Google Scholar]
- Hounsgaard J, Hultborn H, Kiehn O. Transmitter-controlled properties of alpha-motoneurones causing long-lasting motor discharge to brief excitatory inputs. Prog Brain Res. 1986;64:39–49. doi: 10.1016/S0079-6123(08)63398-1. [DOI] [PubMed] [Google Scholar]
- Hultborn H. Plateau potentials and their role in regulating motoneuronal firing. Adv Exp Med and Biol. 2002;508:213–218. doi: 10.1007/978-1-4615-0713-0_26. [DOI] [PubMed] [Google Scholar]
- Huyghues-Despointes CM, Cope TC, Nichols TR. Intrinsic properties and reflex compensation in reinnervated triceps surae muscles of the cat: effect of movement history. J Neurophysiol. 2003;90:1547–1555. doi: 10.1152/jn.00719.2002. [DOI] [PubMed] [Google Scholar]
- Inglis FM, Furia F, Zuckerman KE, Strittmatter SM, Kalb RG. The role of nitric oxide and NMDA receptors in the development of motor neuron dendrites. J Neurosci. 1998;18:10493–10501. doi: 10.1523/JNEUROSCI.18-24-10493.1998. [DOI] [PMC free article] [PubMed] [Google Scholar]
- Ishizuka N, Mannen H, Hongo T, Sasaki S. Trajectory of group IA afferent fibers stained with horseradish peroxidase in the lumbosacral spinal cord of the cat: three dimensional reconstructions from serial sections. J Comp Neurol. 1979;186:189–211. doi: 10.1002/cne.901860206. [DOI] [PubMed] [Google Scholar]
- Kalb RG. Regulation of motor neuron dendrite growth by NMDA receptor activation. Development. 1994;120:3063–3071. doi: 10.1242/dev.120.11.3063. [DOI] [PubMed] [Google Scholar]
- Koerber HR, Mirnics K. Morphology of functional long-ranging primary afferent projections in the cat spinal cord. J Neurophysiol. 1995;74:2336–2348. doi: 10.1152/jn.1995.74.6.2336. [DOI] [PubMed] [Google Scholar]
- Lee RH, Heckman CJ. Bistability in spinal motoneurons in vivo: systematic variations in persistent inward currents. J Neurophysiol. 1998;80:583–593. doi: 10.1152/jn.1998.80.2.583. [DOI] [PubMed] [Google Scholar]
- Lieberman AR. The axon reaction: a review of the principal features of perikaryal responses to axon injury. Int Rev Neurobiol. 1971;14:49–124. doi: 10.1016/S0074-7742(08)60183-X. [DOI] [PubMed] [Google Scholar]
- Maas H, Prilutsky BI, Nichols TR, Gregor RJ. The effects of self-reinnervation of cat medial and lateral gastrocnemius muscles on hindlimb kinematics in slope walking. Exp Brain Res. 2007;181:377–393. doi: 10.1007/s00221-007-0938-8. [DOI] [PMC free article] [PubMed] [Google Scholar]
- Mendell LM. Physiological aspects of synaptic plasticity: the IA/motoneuron connection as a model. Adv Neurol. 1988;47:337–360. [PubMed] [Google Scholar]
- Mendell LM, Henneman E. Terminals of single IA fibers: location, density, and distribution within a pool of 300 homonymous motoneurons. J Neurophysiol. 1971;34:171–187. doi: 10.1152/jn.1971.34.1.171. [DOI] [PubMed] [Google Scholar]
- Mendell LM, Munson JB, Scott JG. Connectivity changes of IA afferents on axotomized motoneurons. Brain Res. 1974;73:338–342. doi: 10.1016/0006-8993(74)91054-3. [DOI] [PubMed] [Google Scholar]
- Mendell LM, Taylor JS, Johnson RD, Munson JB. Rescue of motoneuron and muscle afferent function in cats by regeneration into skin: II. IA-motoneuron synapse. J Neurophysiol. 1995;73:662–673. doi: 10.1152/jn.1995.73.2.662. [DOI] [PubMed] [Google Scholar]
- Mentis GZ, Blivis D, Liu W, Drobac E, Crowder ME, Kong L, Alvarez FJ, Sumner CJ, O'Donovan MJ. Early functional impairment of sensory-motor connectivity in a mouse model of spinal muscular atrophy. Neuron. 2011;69:453–467. doi: 10.1016/j.neuron.2010.12.032. [DOI] [PMC free article] [PubMed] [Google Scholar]
- Montague SJ, Fenrich KK, Mayer-Macaulay C, Maratta R, Neuber-Hess MS, Rose PK. Non-uniform distribution of contacts from noradrenergic and serotonergic boutons on the dendrites of cat splenius motoneurons. J Comp Neurol. 2013;521:638–656. doi: 10.1002/cne.23196. [DOI] [PubMed] [Google Scholar]
- Navarro X. Chapter 27: neural plasticity after nerve injury and regeneration. Int Rev Neurobiol. 2009;87:483–505. doi: 10.1016/S0074-7742(09)87027-X. [DOI] [PubMed] [Google Scholar]
- Nicolopoulos-Stournaras S, Iles JF. Motor neuron columns in the lumbar spinal cord of the rat. J Comp Neurol. 1983;217:75–85. doi: 10.1002/cne.902170107. [DOI] [PubMed] [Google Scholar]
- Nishimune H, Sanes JR, Carlson SS. A synaptic laminin-calcium channel interaction organizes active zones in motor nerve terminals. Nature. 2004;432:580–587. doi: 10.1038/nature03112. [DOI] [PubMed] [Google Scholar]
- Pierce JP, Mendell LM. Quantitative ultrastructure of IA boutons in the ventral horn: scaling and positional relationships. J Neurosci. 1993;13:4748–4763. doi: 10.1523/JNEUROSCI.13-11-04748.1993. [DOI] [PMC free article] [PubMed] [Google Scholar]
- Redman S. Junctional mechanisms at group IA synapses. Prog Neurobiol. 1979;12:33–83. doi: 10.1016/0301-0082(79)90010-8. [DOI] [PubMed] [Google Scholar]
- Redman S, Walmsley B. The time course of synaptic potentials evoked in cat spinal motoneurones at identified group IA synapses. J Physiol. 1983a;343:117–133. doi: 10.1113/jphysiol.1983.sp014884. [DOI] [PMC free article] [PubMed] [Google Scholar]
- Redman S, Walmsley B. Amplitude fluctuations in synaptic potentials evoked in cat spinal motoneurones at identified group IA synapses. J Physiol. 1983b;343:135–145. doi: 10.1113/jphysiol.1983.sp014885. [DOI] [PMC free article] [PubMed] [Google Scholar]
- Sabatier MJ, To BN, Nicolini J, English AW. Effect of slope and sciatic nerve injury on ankle muscle recruitment and hindlimb kinematics during walking in the rat. J Exp Biol. 2011;214:1007–1016. doi: 10.1242/jeb.051508. [DOI] [PMC free article] [PubMed] [Google Scholar]
- Siembab VC, Smith CA, Zagoraiou L, Berrocal MC, Mentis GZ, Alvarez FJ. Target selection of proprioceptive and motor axon synapses on neonatal V1-derived IA inhibitory interneurons and Renshaw cells. J Comp Neurol. 2010;518:4675–4701. doi: 10.1002/cne.22441. [DOI] [PMC free article] [PubMed] [Google Scholar]
- Schwindt PC, Crill WE. Properties of a persistent inward current in normal and TEA-injected motoneurons. J Neurophysiol. 1980;43:1700–1724. doi: 10.1152/jn.1980.43.6.1700. [DOI] [PubMed] [Google Scholar]
- tom Dieck S, Sanmartí-Vila L, Langnaese K, Richter K, Kindler S, Soyke A, Wex H, Smalla KH, Kämpf U, Fränzer JT, Stumm M, Garner CC, Gundelfinger ED. Bassoon, a novel zinc-finger CAG/glutamine-repeat protein selectively localized at the active zone of presynaptic nerve terminals. J Cell Biol. 1998;142:499–509. doi: 10.1083/jcb.142.2.499. [DOI] [PMC free article] [PubMed] [Google Scholar]
- Ulfhake B, Kellerth JO. A quantitative light microscopic study of the dendrites of cat spinal alpha-motoneurons after intracellular staining with horseradish peroxidase. J Comp Neurol. 1981;202:571–583. doi: 10.1002/cne.902020409. [DOI] [PubMed] [Google Scholar]
- Valero-Cabré A, Navarro X. H reflex restitution and facilitation after different types of peripheral nerve injury and repair. Brain Res. 2001;919:302–312. doi: 10.1016/S0006-8993(01)03052-9. [DOI] [PubMed] [Google Scholar]
- Watt DG, Stauffer EK, Taylor A, Reinking RM, Stuart DG. Analysis of muscle receptor connections by spike-triggered averaging: 1. Spindle primary and tendon organ afferents. J Neurophysiol. 1976;39:1375–1392. doi: 10.1152/jn.1976.39.6.1375. [DOI] [PubMed] [Google Scholar]
- Webb CB, Cope TC. Influence of synaptic identity on single-IA-afferent connectivity and EPSP amplitude in the adult cat: homonymous versus heteronymous connections. J Neurophysiol. 1992;68:1046–1052. doi: 10.1152/jn.1992.68.4.1046. [DOI] [PubMed] [Google Scholar]
- Zelená J. Nerves and mechanoreceptors: the role of innervation in the development and maintenance of mammalian mechanoreceptors. Berlin: Springer; 1994. [Google Scholar]