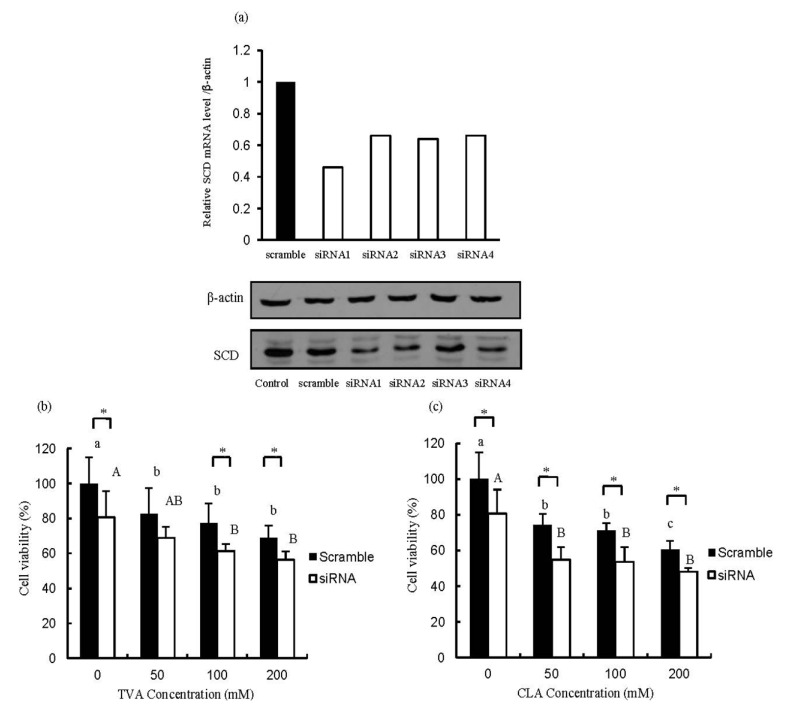
Figure 3.
Efficient suppression of stearoyl CoA desaturase (SCD) mRNA expression after siRNA transfection (a) and changes in the number of SCD-depleted MCF-7 cells after exposure to (b) TVA or (c) c9, t11-CLA. MTT data were analyzed using a one-way ANOVA. SD values are shown as error bars (n = 8). Values not labeled with the same letter are significantly different (p < 0.05). Lower cases indicate significantly different (p < 0.05) in scramble group; while the upper cases indicate significantly different (p < 0.05) in siRNA group. The asterisk indicates significantly different (p < 0.05) between scramble group and siRNA group. CCTACGCCACCAATTTCGT (scrambled), GAGAUAAGUUGGAGACGAU (siRNA1), GAUAUGCUGUGGUGCUUAA (siRNA2), GGGCATAACAGCAGGAGCT (siRNA3), and GGAGATGGAAACTA CAAGA (siRNA4).

