Abstract
Background
3′-18F-fluoro-3′-deoxy-fluorothymidine (18F-FLT), a nucleoside analog, could monitor effects of molecularly targeted therapeutics on tumor proliferation.
Methods
We tested whether 18F-FLT positron emission tomography (PET) uptake changes are associated with antitumor effects of erlotinib in A431 xenografts or cetuximab in SCC1 xenografts.
Results
Compared with pretreatment FLT PET scans, 3 days of erlotinib in A431 reduced the standardized uptake value (SUV) by 18%, whereas placebo increased SUV by 1% (p = .005). One week of cetuximab in SCC1 reduced SUV by 62%, whereas placebo reduced SUV by 16% (p = .005). FLT uptake suppression following anti–epidermal growth factor receptor (EGFR) treatment was associated with reduced tumor thymidine kinase-1 (TK1) activity. In vitro TK1 knockdown studies confirmed the importance of TK1 activity on intracellular FLT accumulation suppression.
Conclusions
18F-FLT PET imaging detects tumor responses to EGFR-inhibitors within days of starting therapy. This technique may identify patients likely to benefit from EGFR-inhibitors early in their treatment course.
Keywords: fluorodeoxythymidine (FLT), anti-EGFR inhibitor therapy, squamous cell carcinoma xenografts, cetuximab, erlotinib
Defining response to therapy by traditional anatomic imaging of tumor size requires serial observations over many months. In contrast, nucleoside analog radiopharmaceuticals that are being developed for noninvasive imaging of tumor cell proliferation have significant potential for showing tumor response within days to weeks of initiating therapy. One investigational radiopharmaceutical that is seeing increased use in cancer research is the proliferation-specific positron emission tomography (PET) ligand 3′-18F-fluoro-3′-deoxy-fluorothymidine (18F-FLT). Several clinical trials have demonstrated that 18F-FLT can be used to image a variety of tumor types, and there is a strong correlation between the extent of FLT uptake and the proliferation index in individual tumors.1–4
FLT enters cells through active and passive nucleoside transport mechanisms and is subsequently phosphorylated by thymidine kinase-1 (TK1).5,6 The resulting negative charge of FLT-monophosphate prevents efflux out of the cell, and this TK1-mediated phosphorylation reaction is the rate-limiting step involved in FLT cellular uptake/retention.7,8 Consistent with this, in vitro studies have correlated TK1 expression levels with the extent of cellular FLT retention.9,10 Although TK1 is not a specific proliferation marker, TK1 is regulated within the cell cycle,11 and the extent of FLT uptake within a tumor usually reflects the fraction of tumor cells in S-phase where TK1 expression is highest. Because TK1 expression and FLT tumor uptake should be suppressed following pharmacologic inhibition of tumor proliferation, nucleoside analogs which act as reporters of TK1 activity may be suitable for assessing the antiproliferative effects of a variety of molecularly targeted therapeutics.
Several epidermal growth factor receptor (EGFR) inhibitors have demonstrated activity, either alone or in combination with conventional cytotoxic agents, in several tumor types, including colorectal, lung, and head and neck cancer. Unfortunately, only a minority of patients benefit from these molecularly targeted agents, and development of techniques to identify those patients most likely to benefit from a specific molecular therapy could facilitate the individualization of cancer therapy. In the current study, we have applied 18F-FLT PET imaging to monitor the effects of 2 clinically approved EGFR inhibitors: erlotinib, a small molecule EGFR kinase inhibitor, and cetuximab, an anti-EGFR therapeutic monoclonal antibody. The current study demonstrates that EGFR inhibitor therapy suppresses FLT uptake as early as 3 days after initiating drug treatment and suggests that this technique could be used to identify patients who are responding to EGFR inhibitor therapy early during their course of therapy.
MATERIALS AND METHODS
Drugs and Cell Lines
Erlotinib was kindly provided by OSI Pharmaceuticals (courtesy of Dr. Ken Iwata). A stock solution of 10 mM was prepared in DMSO and stored at −20°C. Cetuximab was purchased from the Mayo Clinic pharmacy, and an isotype-matched control antibody was purchased from Sigma. Two established squamous cell carcinoma cell lines with high-level EGFR expression and known sensitivity to EGFR inhibition were used in our studies: the vulvar squamous cell line A431 (American Type Culture Collection, Manassas, Virginia) and the head and neck squamous cell line SCC-1 (provided by Paul Harari, University of Wisconsin). Both cell lines were cultured in Dulbecco’s modified Eagle’s minimal essential medium (DMEM) with 10%fetal bovine serum (FBS) and 10 mM 4-(2-hydroxyethyl)-1-piperazineethanesulfonic acid. Cells were maintained under subconfluent conditions at 37°C in an atmosphere of humidified 5% (v/v) CO2. Antibodies for western blotting were purchased from Cell Signaling: EGFR (Cat. # 2232), phospho-Y1068 EGFR (Cat. # 2236), Akt (Cat. No. 9272), mitogen-activated protein kinase (MAPK) (No. 9102), and phospho-S473 Akt (Cat. No. 9271). TK1 antibody was from QED Bioscience (Cat. No. 34003), phosphor-T202/Y204 MAPK was from Biolabs (No. 9106S), and antibody for β-actin was from Sigma (Cat. No. A5441). 3H-FLT was from Moravek Biomedicals (Cat. No. MT645).
Immunoblotting
Tumor samples from 3 placebo and 3 treated mice were evaluated for both A431 and SCC1 tumors. Frozen tumor samples were ground with a pestle in microcentrifuge tubes and lysed in detergent-containing buffer (20 mM Tris–HCl, pH 7.4, 150 mM NaCl, 1 mM ethylene glycol tetraacetic acid, 1 mM sodium fluoride (NaF), 1% NP-40, 0.5% sodium deoxycholate, 10 mM β-glycerol phosphate, 10 μg/mL aprotinin, 10 μg/mL pepstatin, 10 μg/mL leupeptin, 20 nM microcystin, 1 mM phenylmethanesulfonylfluoride (PMSF), and 1 mM sodium orthovanadate, 20 nM microcystin, 10 nM okadaic acid). Lysates were cleared of insoluble material by centrifugation. Samples were boiled in sodium dodecyl sulfate (SDS) sample buffer, 25 μg of each protein were resolved by SDS-polyacrylamide gel electrophoresis, and proteins then were transferred to Immobilon-P membranes (Millipore). Membranes were blocked with 5%milk dissolved in tris-buffered saline containing 0.02% Tween 20 (TBST) and then incubated with primary antibody diluted in the same buffer. After washing, membranes were incubated with either goat antirabbit (Cell Signaling) or goat antimouse (Pierce) antibodies conjugated to horseradish peroxidase. Blots were developed with Super Signal Chemiluminescence reagent (Pierce). Immunoblotting was performed with the phospho-specific antibodies first, and then membranes were stripped and re-probed with the relevant nonphospho-specific antibodies.
siRNA Transfection 3H-FLT Uptake
Cells were plated in 24-well plates (50,000 cells per well) and incubated overnight before changing to serum-free OptiMEM (Gibco) media. A double-stranded siRNA oligonucleotide pool specific for TK1 (Dharmacon, Cat. No. M-006787-00-0005) or a Cy3-labeled control siRNA pool specific for firefly luciferase (Dharmacon, Cat. No. D-001110-01-05) was diluted in OptiMEM media and Lipofectamine 2000 (Invitrogen) and then added to the cells. Serum was added to the media after 4 hours, and cells were incubated for an additional 48 hours before being used in experiments. Transfection efficiency was evaluated by visualization of the Cy3-labeled control siRNA by fluorescent microscopy. Transfection efficiency was ≫95%. To evaluate FLT uptake, cells were pulsed with 3H-FLT (1 μCi/ well, 5.0 Ci/mmol) for 1 hour. Cells were washed with PBS and then lysed in 0.3 N NaOH/1%SDS. Total cellular radioactivity in the cellular lysates was determined by liquid scintillation counting. In parallel, cells were processed for western blotting as described above.
Methylene Blue Assay
Cells were plated in 96-well plates (5600 cells/well) and incubated overnight in low-glucose DMEM and 10%FBS. Media was aspirated and replaced with low-glucose media containing epidermal growth factor (10 ng/ mL) and a graded concentration of Erlotinib or Cetuximab, and cells were incubated for 24 hours. Cells were fixed with 20% glutaraldyhyde and stained with 0.05% methylene blue. Methylene blue was dissolved with 3% HCl. The absorbance of each well of the microtiter plate was determined at 650 nm using SoftMax software.
TK1 Kinase Assay
TK1 kinase activity was assayed as described previously.12 Frozen tumor specimens were resuspended in Buffer B (50 mM Tris–HCl, pH 7.9, 50 mM NaF, 1 mM β-mercaptoethanol, 1 mM PMSF, 1 mM Na3VO4, 10 μg/mL aprotinin, 10 μg/mL leupeptin, 10 μg/mL pepstatin, 10 mM β-glycerol phosphate, 20 nM microcystin, and 10 nM okadaic acid) and then disrupted using a dounce homogenizer. Lysates were cleared of insoluble material by centrifugation. Equal amounts of detergent-soluble proteins were diluted in the kinase buffer (50 mM Tris–HCl, pH 7.9, 3 mM β-mercaptoethanol, 2.5 mM MgCl2, 5 mM ATP, 0.1% bovine serum albumin, 90 μM thymidine, 5 mM NaF, and 20 μCi/mL 3H-thymidine (5.0 Ci/mmol)). Reaction mixtures were incubated at 37°C for 75 minutes, and then spotted in triplicate onto Whatman DE-81 disks. The disks were washed 3 times in 4 mM ammonium formate, once in 100% ethanol, and then air dried. Radioactivity bound to the disk was quantified by liquid scintillation counting.
18F-FLT Synthesis
18F-FLT was synthesized in the Mayo PET Radiochemistry Facility as described by others using 5′-O-(4,4′-dimethoxytri-phenylmethyl)-2,3′-anhydrothymidine as a precursor.13 Following the synthesis reaction, the crude product was diluted in water, and passed through a frit (10 μm, Alltech, Deerfield, IL) and a conditioned (ethanol/water) Sep-Pak Plus C-18 solid-phase extraction cartridge (Waters, Milford, Massachusetts). After washing with water, the product was eluted with ethanol and dried for 15 minutes at 80°C. This purified 18F-FLT was then reconstituted in water and sterile filtered. The radiochemical purity was confirmed by high-pressure liquid chromatography and thin layer chromatography to be greater than 97%.
Xenograft Imaging and Analysis
All animal studies were performed with the prior approval of the Mayo Clinic Institutional Animal Care and Use Committee. Subcutaneous xenografts were established over the dorsal lateral lower rib cage. Female athymic nude mice, aged 11 to 12 weeks, were injected subcutaneously with 2 million A431 cells or SCC1 cells suspended in 100 μL of saline and matrigel. When the majority of tumors were greater than 1 cm in diameter, mice were imaged by 18F-FLT PET. Mice were not pretreated with thymidine phosphorylase because change in 18F-FLT uptake with treatment and not maximal uptake was the primary endpoint.14 Preliminary experiments demonstrated maximal tumor radio-tracer uptake between 30 and 60 minutes following an IP injection of 18F-FLT (data not shown). Therefore, in the current experiments, approximately 250 μCi 18F-FLT were injected IP, and mice were imaged within that time frame. For imaging, mice with established tumors were anesthetized with an IP injection of ketamine and xylazine. Imaging was performed on a Discovery LS PET/ CT clinical scanner (GE Medical Systems, Waukesha, Wisconsin) using a custom jig that allows imaging multiple mice simultaneously.
For each scanning session, a PET scan of 10-minute duration was acquired from which 35 images with an interslice spacing of 4.25 mm were generated. A helical CT scan was acquired sequentially with the PET scan with parameters 140 kVp, 20 mA, 4.25 mm slice interval and 5 mm slice thickness. Reconstructed PET images of each mouse were generated using filtered backprojection with a ramp filter (cutoff at the Nyquist); the PET images were corrected for attenuation, scatter, decay, deadtime, and randoms. The CT and PET DICOM data sets from the scanner were segmented such that imaging data for pairs of adjacent mice were saved in separate files. These data were then imported into the PMOD software package (PMOD Technologies, Zurich, Switzerland) for subsequent analysis. The PET, CT, and PET/CT fusion were viewed simultaneously to identify the tumor and differentiate it from nearby normal structures that were FLT-avid. The maximal radiotracer uptake in the tumor was identified, and a volume of interest (VOI) was drawn to encompass the radiotracer signal that was greater than 60% of the maximum on serial axial images that encompassed the tumor volume. The defined VOI was superimposed on the fused CT data set, which confirmed in all cases a good correlation between the tumor volume defined by PET and by CT. The integral activity encompassed by the VOI was calculated for each tumor, and this was normalized for injected activity and body weight to calculate an average standardized uptake value (SUV) in the VOI. The relative change in SUV (Δ-SUV) following treatment was calculated for each mouse with the formula:
Data were also analyzed by comparing tumor activity with muscle activity in each scan. On a single axial CT slice, a region of interest (ROI) corresponding to the muscle tissue located between the upper humerus and the lateral rib cage was outlined, and the SUV within this ROI was calculated. To normalize uptake quantification for individual mice and account for potential differences in transperitoneal absorption of radiotracer on different scans, the ratio of tumor SUV to muscle SUV was calculated for each scan and defined as the tumor-to-muscle ratio (TMR). The relative change in TMR (Δ-TMR) following treatment was calculated for each mouse with the formula:
Immunohistochemistry for Ki-67
Formalin-fixed, paraffin-embedded samples were deparaffinized prior to antigen retrieval in 1 mM EDTA, pH 8.0 at 100°C. Sections were incubated with 3% H2O2 in ethanol and then incubated with a 1:100 dilution of Ki-67 monoclonal antibody. After washing, sections were incubated with a secondary antibody conjugated with a polymer-based Hrp/DAB molecule (EnVision+, DAKO Cytomation), developed with 3,3′-diaminobenzidine, and then counterstained with modified Schmidts’s hematoxylin. Ki-67 staining was visualized by light microscopy. To determine the Ki-67 labeling index, digital images of 5 high-powered fields were obtained for each tumor, and the fraction of the area within those fields with intense Ki-67 staining was determined by image analysis using the KS400 image analysis software (Carl Zeiss, Oberkochen, Germany).
Statistical Testing
The effects of TK1 siRNA on FLT uptake was analyzed using a 2-tailed Student’s t test. The imaging data evaluating the effects of drug treatment versus placebo on FLT uptake in flank tumors were analyzed using the Wilcoxon rank-sum test.
RESULTS
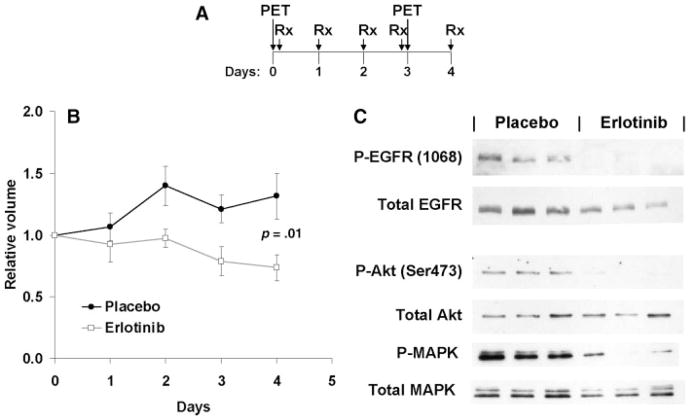
The effects of erlotinib on FLT uptake were studied in A431 vulvar squamous cell carcinoma xenografts. Mice with established flank tumors were imaged by FLT PET and then randomized to daily oral therapy with erlotinib (100 mg/kg) or vehicle control. After the fourth dose, mice were re-imaged and subsequently euthanized 24 hours later (Figure 1A). As expected, erlotinib treatment slowed tumor growth of the A431 xenografts over the course of the 4-day experiment (Figure 1B), and erlotinib was effective at suppressing EGFR autophosphorylation at Tyr1068 and downstream signaling to Akt (Figure 1C) and downstream phosphorylation of MAPK.
FIGURE 1.
Erlotinib treatment of A431 xenografts. (A) The schedule for FLT PET imaging relative to erlotinib treatment is shown. (B) The relative tumor volumes (mean ± SD) are shown for erlotinib or placebo-treated mice. (C) Western blotting with the indicated antibodies of tumors from 3 placebo- and 3 erlotinib-treated mice.
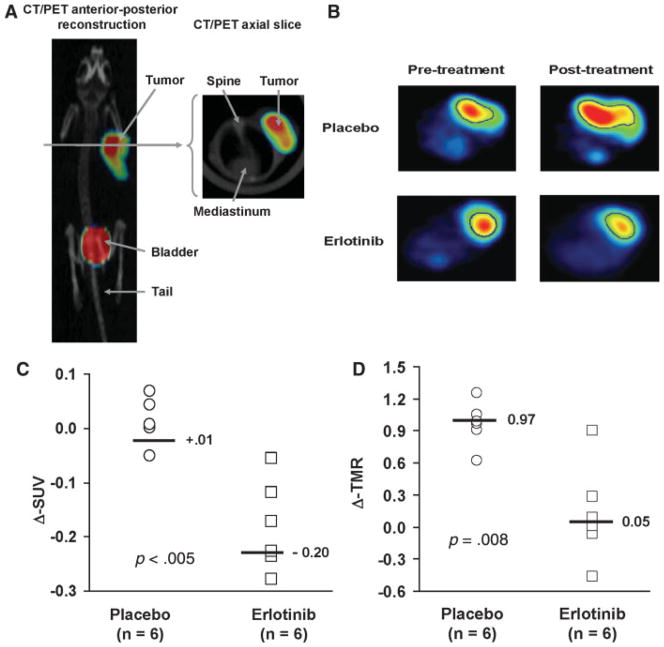
FLT PET images were obtained both before and 3 days after initiating erlotinib therapy, and representative results are shown in Figures 2A and 2B. For each imaging session, SUVs for each tumor were calculated, and the effects of treatment on FLT uptake between the pretreatment and the posttreatment imaging sessions were compared. This analysis revealed that erlotinib treatment resulted in a significant reduction in tumor FLT uptake (median Δ-SUV: −20%; Figure 2C) as compared with placebo (Δ-SUV: +1%; p = .005). To account for potential differences in absorption of FLT between mice, the imaging data were also analyzed by calculating tumor activity to muscle activity ratios (TMR) for each imaging session and then calculating the Δ-TMR for each mouse. Similar to our SUV analysis, erlotinib treatment was associated with a significantly greater reduction in TMR as compared with placebo (Figure 2D; mean Δ-TMR for placebo 0.97 vs 0.05 for erlotinib treated mice; p = .008).
FIGURE 2.
18F-FLT PET imaging of response to erlotinib. (A) A PET/CT fusion image of an animal imaged following 18F-FLT injection is shown. (B) Representative pretreatment and posttreatment axial PET images from mice treated with erlotinib or placebo. The tumor volume of interest on the image is outlined in blue. (C) Relative change in standard uptake value (Δ-SUV) for each animal imaged, and the median value for each treatment group is shown. (D) A similar analysis is shown for the relative change in tumor to muscle activity ratio (Δ-TMR).
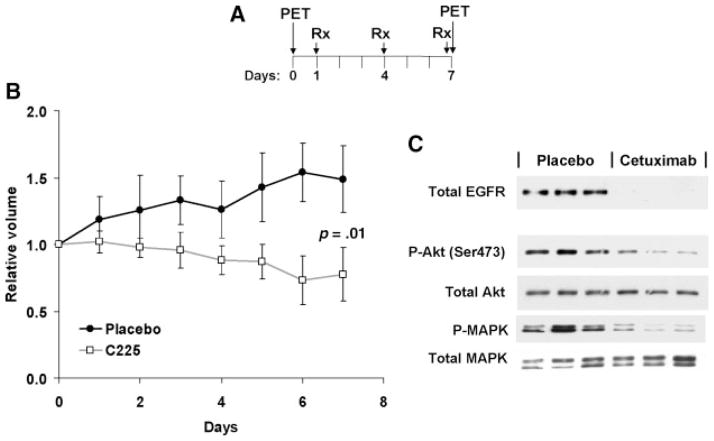
The effects of cetuximab on FLT uptake were evaluated in SCC1 head and neck squamous cell carcinoma xenografts. As with the A431 experiment, mice with established SCC1 xenografts were imaged by FLT PET and then randomized to intraperitoneal injections with cetuximab (1 mg/ mouse) or isotype-matched antibody control once every 3 days (Figure 3A). Cetuximab treatment was associated with a reduced growth rate of tumors (Figure 3B), and a marked reduction in the total levels of EGFR expression, Akt phosphorylation and MAPK phosphorylation (Figure 3C).
FIGURE 3.
Cetuximab treatment of SCC1 xenografts. (A) The schedule for FLT PET imaging relative to cetuximab treatment is shown. (B) The relative tumor volumes (mean ± SD) are shown for placebo and cetuximab-treated mice. (C) Western blotting with the indicated antibodies of tumors from 3 placebo- and 3 cetuximab-treated mice.
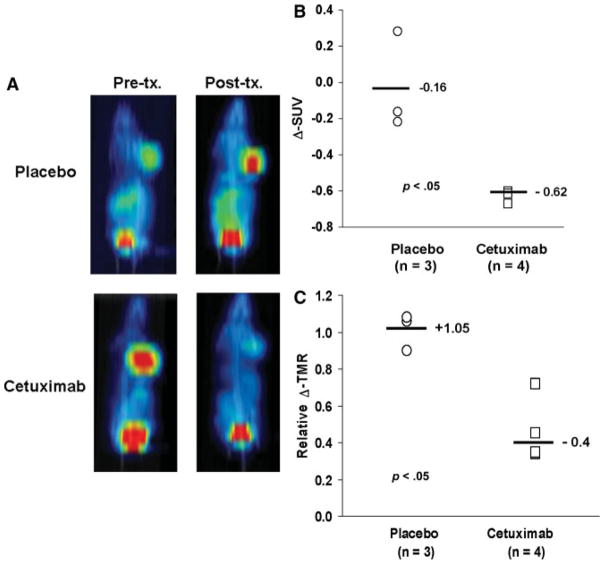
FLT PET images were obtained both before and 6 days after initiating cetuximab therapy. Similar to the results with erlotinib in A431 xenografts, cetuximab treatment markedly reduced the uptake of FLT into SCC1 xenografts (Figure 4A). An analysis of changes in 18F-FLT uptake demonstrated a median ΔSUV of −16%for placebo versus −62% for cetuximab treatment (p = .05). Similar results were obtained when the images were analyzed for the change in TMR (Figure 4C; median Δ-TMR 1.05 vs 0.40 for placebo- vs cetuximab-treated mice, respectively; p = .05).
FIGURE 4.
18F-FLT PET imaging of response to cetuximab. (A) Representative pretreatment and posttreatment coronal maximum-intensity projection PET images from mice treated with cetuximab or placebo are shown. (B) Relative change in standard uptake value (Δ-SUV) is plotted for each animal imaged and the median value for each treatment group is shown. (C) A similar analysis is shown for the relative change in tumor to muscle activity ratio (Δ-TMR).
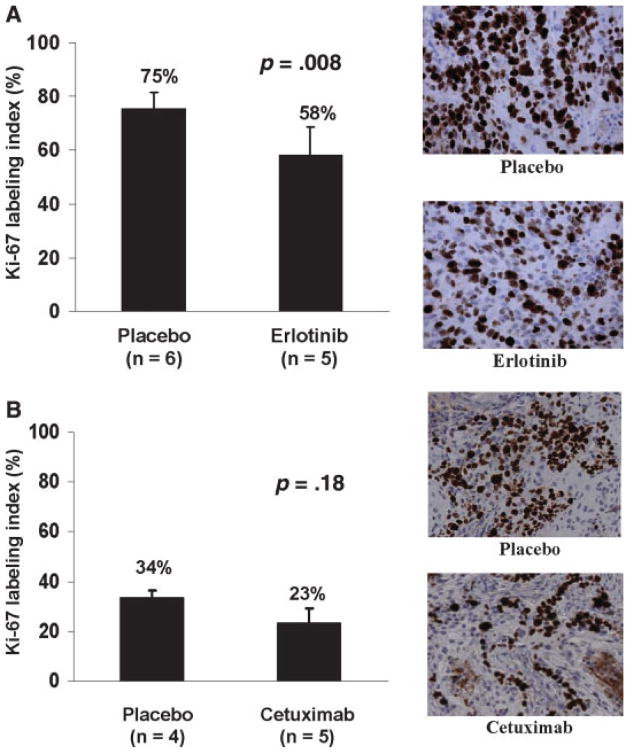
Tumor samples from mice treated in the imaging experiment were processed to assess the effects of erlotinib and cetuximab on tumor proliferation and TK1 activity in the respective tumor lines. Paraffin-embedded tumor sections were stained for Ki-67 antigen, which is a marker for actively proliferating cells. A431 tumors from control-treated animals were highly proliferative with a mean ± SD labeling index of 75% ± 6% (Figure 5A). Treatment with erlotinib resulted in a modest, but statistically significant, reduction in labeling index: 58% ± 10% (Student’s t test, p = .008). SCC-1 tumors from control-treated animals were less proliferative with a mean ± SD labeling index of 33% ± 3%, and treatment with cetuximab resulted in a similarly modest reduction in labeling index (23% ± 6%), although this difference did not reach statistical significance (Figure 5B; Student’s t test, p = .18).
FIGURE 5.
The MIB-1 labeling index for placebo and treated mice (mean SD). A) Results from A431 xenografts treated with or without erlotnib and associated representative photomicrographs. B) Results from SCC1 xenografts treated with or without cetuximab and associated representative photomicrographs.
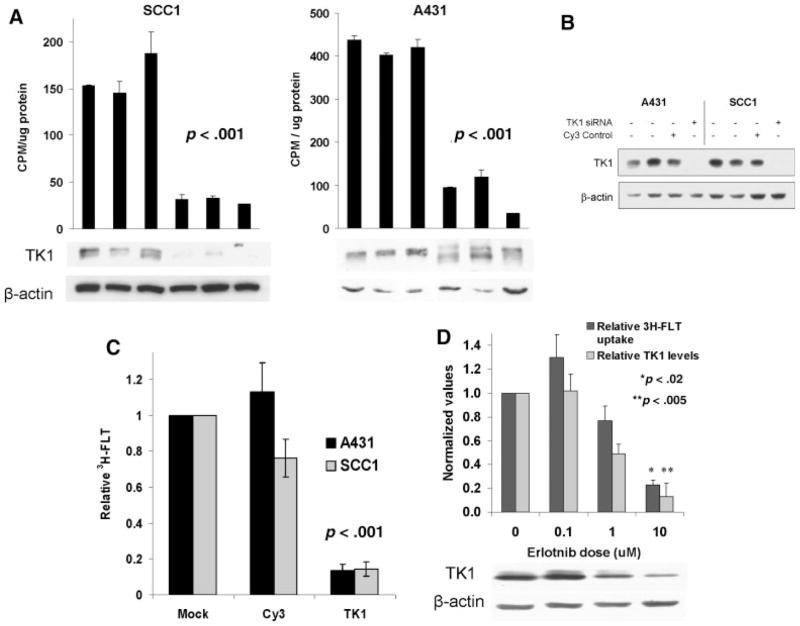
Both erlotinib and cetuximab therapy were associated with a marked suppression of TK1 kinase activity (Figure 6A). TK1 kinase activity in A431 tumors was 420 ± 18 cpm/μg protein following placebo versus 83 ± 44 cpm/μg protein following erlotinib treatment (p = .002). Similarly, TK1 kinase activity in SCC1 tumors was 162 ± 22 cpm/μg protein following placebo versus 30 ± 4 cpm/μg protein following cetuximab treatment (p < .001). Interestingly, erlotinib treatment of A431 xenografts was associated with altered electrophoretic mobility of TK1 without a significant reduction in TK1 expression, whereas cetuximab treatment was associated with marked reduction in TK1 protein levels (Figure 6A).
FIGURE 6.
Evaluation of thymidine kinase-1 activity. (A) Western blotting for TK1 expression with actin loading control. (B). Western blotting with the indicated antibodies following A431 and SCC1 cell siRNA oligonucleotide transfection for TK1 or firefly luciferase (Luc). (C) Parallel 3H-FLT evaluation of TK1 knockdown on FLT accumulation (mean ± SEM of 3 independent experiments). (D) The effects of erlotinib treatment of A431 cells on relative TK1 protein levels by Western blot, and parallel 3H-FLT uptake. Mean TK1 protein levels, normalized to β-actin, and corresponding levels of 3H-FLT uptake are shown as mean ± SEM of 3 independent experiments.
To further investigate the extent to which FLT uptake/retention is dependent on TK1 activity, siRNA specific for TK1 was used to knock down TK1 protein levels in A431 and SCC1 cells grown in vitro. Transfection with TK1 siRNA was highly efficient at suppressing TK1 protein levels (Figure 6B) and TK1 kinase activity (data not shown), whereas control luc siRNA had little to no effect on TK1 levels. In conjunction with reduced TK1 expression, TK1 siRNA treatment was associated with significant suppression of FLT accumulation in both cell lines (3H-FLT levels were 14% ± 3% of control treatment in A431 cells, p < .001; and 14% ± 4%of control treatment in SCC1 cells, p < .001; Figure 6C). Finally, within the context of EGFR inhibitor therapy, there was a direct correlation between drug-induced suppression of TK1 expression and the extent of cellular uptake of 3H-FLT in A431 cells in vitro; treatment with 10 μM erlotinib was associated with both a significant suppression of TK1 protein levels (TK1 level 13% of control treatment, p = .005; Figure 6D) and a significant reduction in 3H-FLT uptake (23% of control treatment, p = .02). Collectively, the data suggest that pharmacologic or genetic suppression of TK1 expression results in marked inhibition of FLT cellular accumulation.
DISCUSSION
Molecularly targeted cytostatic agents are finding increasing applications in cancer therapy. Often these novel therapeutic agents prevent tumor growth without inducing significant tumor regression. Unlike traditional anatomic imaging, functional imaging potentially could be used to identify those patients responding to novel cytostatic agents within days of starting treatment. In this study, treatment of mice with either a small molecule EGFR inhibitor or an anti-EGFR therapeutic antibody resulted in significant suppression of 18F-FLT tumor uptake as early as 72 hours after initiating therapy. Similar to previous studies, EGFR blockade in the A431 and SCC1 models resulted in relatively early growth suppression without significant tumor regression15,16 and demonstrated significant reduction in FLT uptake following EGFR inhibitor therapy in A431 xenografts.17 Collectively, these data support the idea that suppression of FLT accumulation within cells is a class-effect of EGFR inhibition that occurs relatively rapidly following the initiation of therapy.
Treatment with either class of EGFR inhibitor was associated with a marked suppression of TK1 activity. These data corroborate previous in vitro studies that demonstrated a correlation between cell cycle distribution, TK1 activity, and FLT uptake.9,10 Our observation that TK1 siRNA greatly attenuates FLT uptake in both A431 and SCC1 cells now provides further direct evidence that TK1 activity is crucial for FLT accumulation within cells. Consistent with this observation, the erlotinib-resistant MDA-468 breast cancer cell line demonstrates significantly less suppression of TK1 and a minimal reduction in FLT uptake as compared with A431 cells (unpublished data, Atkinson and Sarkaria). Other therapeutic agents also can alter FLT uptake into tumors. The effects of radiation on TK1 activity and FLT uptake are significantly influenced by the integrity of DNA damage checkpoint pathways,10 and nucleoside analogs, such as gemcitibine or 5-fluorouracil, can cause a paradoxical increase in TK1 activity associated with increased FLT uptake.18,19 These disparate effects on TK1 activity highlight the importance of assessing class effects of targeted therapies prior to application of FLT PET imaging in the clinical evaluation of a specific therapeutic agent. There is significant clinical interest in understanding whether changes in TK1 expression or changes in FLT uptake in response to radiation or chemotherapy may correlate with patient outcome.
EGFR inhibitors have limited single agent activity, and there is a growing appreciation that the most effective use of these agents will be in combination with radiation and/or conventional cytotoxic agents. The early suppression of FLT accumulation within tumors following the initiation of anti-EGFR therapy suggests that serial FLT PET imaging, as was done in this study, could be used to identify those patients whose tumors are responsive to EGFR inhibitor therapy prior to the initiation of combined modality therapy. Potentially, FLT PET imaging may provide a more comprehensive understanding of response to therapy than serial biopsies in heterogeneous head and neck squamous cell tumors. We are now initiating a clinical trial to test this concept with serial FLT PET imaging during a 2-week run-in of cetuximab in patients with locally advanced head and neck cancer prior to combined therapy with definitive chemoradiation. Changes in FLT uptake will be correlated with changes in TK1 expression and the Ki-67 proliferation marker. Ultimately, such an approach could be used to select only responsive patients for inclusion in cetuximab-based combination regimens.
Acknowledgments
Contract grant sponsors: Mayo Foundation and American Cancer Society; contract grant sponsor: NIH; contract grant numbers: CA104310, CA0108961, and CA25224.
The authors thank Sharon Hamblen, Daniel McConnell, and Mark Jacobson from Nuclear Medicine for their expert assistance.
References
- 1.Vesselle H, Grierson J, Muzi M, et al. In vivo validation of 3′deoxy-3′-[(18)F]fluorothymidine ([(18)F]FLT) as a proliferation imaging tracer in humans: correlation of [(18)F]FLT uptake by positron emission tomography with Ki-67 immunohistochemistry and flow cytometry in human lung tumors. Clin Cancer Res. 2002;8:3315–3323. [PubMed] [Google Scholar]
- 2.Buck AK, Schirrmeister H, Hetzel M, et al. 3-Deoxy-3-[18F]fluorothymidine-positron emission tomography for noninvasive assessment of proliferation in pulmonary nodules. Cancer Res. 2002;62:3331–3334. [PubMed] [Google Scholar]
- 3.Francis DL, Freeman A, Visvikis D, et al. In vivo imaging of cellular proliferation in colorectal cancer using positron emission tomography. Gut. 2003;52:1602–1606. doi: 10.1136/gut.52.11.1602. [DOI] [PMC free article] [PubMed] [Google Scholar]
- 4.Wagner M, Seitz U, Buck A, et al. 3′-[18F]fluoro-3′-deoxythymidine ([18F]-FLT) as positron emission tomography tracer for imaging proliferation in a murine B-cell lymphoma model and in the human disease. Cancer Res. 2003;63:2681–2687. [PubMed] [Google Scholar]
- 5.Munch-Petersen B, Cloos L, Tyrsted G, Eriksson S. Diverging substrate specificity of pure human thymidine kinases 1 and 2 against antiviral dideoxynucleosides. J Biol Chem. 1991;266:9032–9038. [PubMed] [Google Scholar]
- 6.Langen P, Kowollik G, Etzold G, Venner H, Reinert H. The phosphorylation of 3′-deoxy-3′-fluorothymidine and its incorporation into DNA in a cellfree system from tumor cells. Acta Biol Med Ger. 1972;29:483–494. [PubMed] [Google Scholar]
- 7.Shields AF, Grierson JR, Dohmen BM, et al. Imaging proliferation in vivo with [F-18]FLT and positron emission tomography. Nat Med. 1998;4:1334–1336. doi: 10.1038/3337. [DOI] [PubMed] [Google Scholar]
- 8.Schinazi RF, Peck A, Sommadossi JP. Substrate specificity of Escherichia coli thymidine phosphorylase for pyrimidine nucleosides with anti-human immunodeficiency virus activity. Biochem Pharmacol. 1992;44:199–204. doi: 10.1016/0006-2952(92)90001-y. [DOI] [PubMed] [Google Scholar]
- 9.Schwartz JL, Tamura Y, Jordan R, Grierson JR, Krohn KA. Monitoring tumor cell proliferation by targeting DNA synthetic processes with thymidine and thymidine analogs. J Nucl Med. 2003;44:2027–2032. [PubMed] [Google Scholar]
- 10.Rasey JS, Grierson JR, Wiens LW, Kolb PD, Schwartz JL. Validation of FLT uptake as a measure of thymidine kinase-1 activity in A549 carcinoma cells. J Nucl Med. 2002;43:1210–1217. [PubMed] [Google Scholar]
- 11.Wang N, He Q, Skog S, Eriksson S, Tribukait B. Investigation on cell proliferation with a new antibody against thymidine kinase 1. Anal Cell Path. 2001;23:11–19. doi: 10.1155/2001/658312. [DOI] [PMC free article] [PubMed] [Google Scholar]
- 12.Jeong MH, Jin YH, Kang EY, et al. The modulation of radiation-induced cell death by genistein in K562 cells: activation of thymidine kinase 1. Cell Res. 2004;14:295–302. doi: 10.1038/sj.cr.7290230. [DOI] [PubMed] [Google Scholar]
- 13.Machulla H-J, Blocher A, Kuntzsch M, Piert M, Wei R, Grierson J. Simplified labeling approach for synthesizing 3′-deoxy-3′-[18F]fluorothymidine ([18F]FLT) J Radioanal Nucl Chem. 2000;243:843–846. [Google Scholar]
- 14.van Waarde A, Cobben DCP, Suurmeijer AJH, et al. Selectivity of 18F-FLT and 18F-FDG for differentiating tumor from inflammation in a rodent model. J Nucl Med. 2004;45:695–700. [PubMed] [Google Scholar]
- 15.Huang SM, Harari PM. Modulation of radiation response after epidermal growth factor receptor blockade in squamous cell carcinomas: inhibition of damage repair, cell cycle kinetics, and tumor angiogenesis. Clin Cancer Res. 2000;6:2166–2174. [PubMed] [Google Scholar]
- 16.Jimeno A, Belen Rubio-Viqueira B, Amador ML, et al. Epidermal growth factor receptor dynamics influences response to epidermal growth factor receptor targeted agents. Cancer Res. 2005;65:3003–3010. doi: 10.1158/0008-5472.CAN-04-3586. [DOI] [PubMed] [Google Scholar]
- 17.Waldherr C, Mellinghoff IK, Tran C, et al. Monitoring antiproliferative responses to kinase inhibitor therapy in mice with 3′-deoxy-3′-18F-fluorothymidine PET. J Nucl Med. 2005;46:114–120. [PubMed] [Google Scholar]
- 18.Dittmann H, Dohmen BM, Kehlbach R, et al. Early changes in [18F]FLT uptake after chemotherapy: an experimental study. Eur J Nucl Med Mol Imaging. 2002;29:1462–1469. doi: 10.1007/s00259-002-0925-z. [DOI] [PubMed] [Google Scholar]
- 19.Perumal M, Pillai RG, Barthel H, et al. Redistribution of nucleoside transporters to the cell membrane provides a novel approach for imaging thymidylate synthase inhibition by positron emission tomography. Cancer Res. 2006;66:8558–8564. doi: 10.1158/0008-5472.CAN-06-0898. [DOI] [PubMed] [Google Scholar]


