

Abstract
Antrodia cinnamomea, a Taiwan-specific medicinal mushroom, can manipulate biological activities, including hepatoprotection, anti-inflammation, anti-hepatitis B virus activity, anticancer activity, etc. In this study, the anti-liver cancer activity and molecular mechanisms of eburicoic acid, the second most abundant triterpenoid from the fruiting bodies of basswood cultivated Antrodia cinnamomea was investigated using the human hepatoma Hep 3B cells. The results show that eburicoic acid effectively reduced Hep 3B cell viability within 24 hours, and the IC50 was 18.4 μM, which was equivalent to 8.7 μg/mL. Besides, eburicoic acid induced conversion of LC3-I to LC3-II and a large number of autophagosomes/autolysosomes formation. In depth investigation for the molecular mechanisms, revealed that eburicoic acid firstly promoted reactive oxygen species generation and ATP depletion, leading to endoplasmic reticulum stress, followed by elevated cytosolic calcium ion concentration and BiP expression, downregulated phosphorylation of DAPK, upregulated phosphorylation of Beclin-1, JNK, and Bcl-2, and finally induced autophagy in Hep 3B cells. These results indicate that eburicoic acid has significant anti-liver cancer effects and more distinctive mechanisms.
Keywords: Liver cancer, Antrodia cinnamomea, Eburicoic acid, Autophagy, ER stress
Introduction
Radiation, hepatitis B virus, hepatitis C virus, carcinogens such as aflatoxin, large amounts of alcohol, tobacco or chloroethylene, and excessive steroid or hormone will cause liver inflammation (Colombo and Donato, 2005; Hussain et al., 2007). Minor injuries can be repaired by the immune system or the regeneration of the liver, but if the injury persists, coupled with oxidative stress and lipid peroxidation caused by reactive oxygen species (ROS), the liver would be further deteriorated and result in liver fibrosis and cirrhosis, which may even develop into liver tumor, which is clinically referred to as hepatocellular carcinoma (3, 4).
Apoptosis, autophagy and necrosis are the three modes of cell death. The cell death mode is determined by the stimulation and cell characterization, and shows a great difference in morphology. The characteristics of apoptosis include chromatin condensation, nucleus fragmentation, cell shrinkage, the decline of mitochondrial membrane potential, the translocation of phosphatidylserine from the inner to the outer membrane, membrane blebbing and the formation of apoptotic bodies (Kerr et al., 1972; Kroemer and Reed, 2000). The process of autophagy begins with the generation of bilayer membrane phagophore in the cytoplasm; it gradually extends and encapsulates proteins and organelles within the vesicles, and forms autophagosome which will fuse with lysosome to form autolysosome, then degrades the proteins and organelles by lysosomal hydrolases (Mizushima et al., 2008). Necrosis is a process in which the cytoplasm expands rapidly and leads to cell membrane rupture, which thereby releases intracellular enzymes and cytokine, and eventually results in inflammation which may spread to adjacent cells (Krysko et al., 2008).
Proteins must go through a series of post-translational modifications and be fully folded in order to be transported from the endoplasmic reticulum (ER). Protein with incomplete or incorrect folding will remain in the endoplasmic reticulum or be degraded by the proteasome in the cytoplasm (Kaufman, 2002). Many physiological and pathological circumstances such as ATP depletion, ROS generation, deficiency in endoplasmic reticulum calcium ion and viral infection may cause the disorders of protein folding in the endoplasmic reticulum, in which proteins with incomplete folding will accumulate on the endoplasmic reticulum surface, and cause ER stress. In order to resist ER stress, cells will start a series of reactions to adapt to the circumstance and regulate the ER stress, which include the promotion of protein degradation, the inhibition of protein translation, and the activation of relevant genes. However, if the ER stress persists, apoptosis or autophagy would be induced, which will eventually lead to cell death (Verfaillie et al., 2010).
Antrodia cinnamomea is a unique mushroom which only grows in the mountains 450-2000 meters above sea level, on the heartwood wall of decadent trunks or the dark and damp surfaces of dead Cinnamomum kanehirai Hays (Chen et al., 2001; Wu et al., 1997). The surface of the fruit bodies contains small and dense pores, and is smooth and slightly glossy; the color of the surface is orange or red due to its age and physiological state, the color of the back is dark brown. It is hard, with a mild aroma of camphor and a very bitter taste (Chang and Chou, 1995). The physiological effects of Antrodia cinnamomea include liver protection, neuroprotection, anti-hepatitis B virus, anti-cancer, antibacteria, antiinflammatory, antioxidation, antigenotoxic, anti-angiogenesis, blood pressure lowering, blood lipid lowering, immune regulation and skin whitening. Currently known active ingredients of Antrodia cinnamomea include polysaccharide, benzenoid, triterpenoid, steroid, etc. (Ao et al., 2009), and it received more attention due to the fine anti-cancer effect of triterpenoids (Laszczyk, 2009). Among the three artificial cultivation of Antrodia cinnamomea, basswood cultivation has the highest content of triterpenoids, followed by solid culture, then liquid fermentation, which is almost free of triterpenoids; therefore, because of its triterpenoids, basswood cultivation is the most valuable. The dehydroeburicoic acid content was the highest among all (approximately 0.96% of total dry weight), the eburicoic acid content the second (approximately 0.48% of total dry weight) (Kuo and Lin, 2011); the high content of the two acids showed great potential in purifying and developing medicine.
Materials and Methods
Materials and Chemicals
The dry powder of fruiting bodies of basswood cultivated Antrodia cinnamomea (BCRC930103) was supplied from PO-ZO Co., Ltd (Taipei, Taiwan). Eburicoic acid was purified from the Antrodia cinnamomea by Professor Yueh-Hsiung Kuo (Tsuzuki Institute for Traditional Medicine, China Medical University, Taichung, Taiwan). Dulbecco's modified Eagle's medium, fetal bovine serum, non-essential amino acids, antibiotic-antimycotic, dihydrodichlorofluo rescein diacetate, fluo 3 acetoxymethyl ester, and Alexa Fluor® 488 anti-rabbit IgG antibody were purchased from Invitrogen (Carlsbad, CA, US). Anti-β-Actin-antibody, anti-Bcl-2-antibody, anti-BiP-antibody, anti-DAPK1-antibody, anti-JNK-antibody, anti-mouse IgG HRP-linked antibody, anti-phospho-Bcl-2-antibody (Ser70), anti-phospho-JNK-antibody (Thr183/Tyr185), and anti-rabbit IgG HRP-linked antibody were purchased from Cell Signaling Technology (Beverly, MA, US). Anti-Beclin-1-antibody, anti-LC3B-antibody, and anti-phospho-DAPK1-antibody (Ser308) were purchased from GeneTex (Irvine, CA, US). Anti-phospho-Beclin-1-antibody (Thr119) was purchased from Abgent (San Diego, CA, US). ADP/ATP ratio assay kit and LDH cytotoxicity assay kit were purchased from BioChain Institute (Hayward, CA, US). All other chemicals were obtained from Sigma-Aldrich (St. Louis, MO, US) with analytical or reagent grade products.
Cell Culture and Treatment
The human hepatoma Hep 3B cell line was obtained from Professor Ming-Shi Shiao (Medical Research and Education, Taipei Veterans General Hospital, Taipei, Taiwan). Hep 3B cells were cultured in Dulbecco's modified Eagle's medium which was supplemented with 10% fetal bovine serum, 1.5 g/L sodium bicarbonate, 1% non-essential amino acids, and 1% antibioticantimycotic at 37°C, 5% CO2 and 90% relative humidity. Eburicoic acid was diluted in dimethyl sulfoxide (DMSO) before addition to cultures. Negative control cultures were treated with 0.3% DMSO.
MTT assay
The cells (5 × 10³ cells/100 μL/well) were seeded in 96-well plates for 24 h. After 24 h of incubation, the cells were treated with 100 μL medium containing 0, 10, 20, and 30 μM eburicoic acid for 12, 24, and 48 h. At the end of the stipulated period, 100 μL 3-(4,5-cimethylthiazol-2-yl)-2,5-diphenyl tetrazolium bromide (MTT) solution was added to each well (0.5 mg/mL) at 37°C for 4 h of incubation. The resulting formazan was dissolved in 100 μL DMSO and the absorbance recorded at 570 nm using PoweWave HT Bio-Tek microplate spectrophotometer (Winooski, VT, US). (Mosmann, 1983)
LDH leakage assay
The cells (1 × 10⁴ cells/200 μL/well) were seeded in 96-well plates for 24 h. After 24 h of incubation, the cells were treated with 200 μL medium containing 0, 10, 20, and 30 μM eburicoic acid and lysis solution (as positive control) for 24 h. After 24 h of treating, the plates were centrifugated at 250 g for 10 min, and then remove 100 μL supernatant and transfer into corresponding cells of new 96-well plates. Following this, 45 μL assay mixture which contains lactate, nicotinamide adenine dinucleotide, iodonitrotetrazolium, and diaphorase was added to each well, protected from light, and incubated for 60 min. The absorbance was recorded at 490 nm using PoweWave HT Bio-Tek microplate spectrophotometer (Winooski, VT, US). (Decker and Lohmann-Matthes, 1988)
Immunofluorescence
The cells (1.75 × 10⁴ cells/350 μL/well) were seeded in 4-well slides for 24 h. After 24 h of incubation, the cells were treated with 350 μL medium containing 0, 10, 20, and 30 μM eburicoic acid for 24 h. After 24 h of treating, the cells were washed and fixed by 4% paraformaldehyde for 20 min, and then washed twice. After washing the cells were blocked for 1 h by 5% bovine serum albumin and 0.1% Triton™ X-100. Then the cells were incubated with anti-LC3B antibody (1:5000) overnight. After two washes, the cells were stained by Alexa Fluor® 488 anti-rabbit IgG antibody (1:1000) for 1 h and protected from light. After washing, the slides were mounted and examined under a TCS SP5 II Leica confocal fluorescence microscopy (Solms, Germany). (Kaminskyy et al., 2011)
Bioluminescence
The cells (5 × 10³ cells/100 μL/well) were seeded in 96-well plates for 24 h. After 24 h of incubation, the cells were treated with 100 μL medium containing 0, 10, 20, and 30 μM eburicoic acid for 24 h. After 24 h of treating, 90 μL lysis solution which contains luciferin and luciferase was added to each well and incubated for 10 min. The luminescence was integrated for 5 sec using DTX-880 Beckman Coulter microplate reader (Brea, CA, US). (Crouch et al., 1993)
Flow cytometry
The cells (3 × 10⁵ cells/6 mL/dish) were seeded in 6 cm dishes for 24 h. After 24 h of incubation, the cells were treated with 6 mL medium containing 0, 10, 20, and 30 μM eburicoic acid for 30 min to detect Ca2+, 2 h to detect ROS, 24 h to detect autophagosome, and 48 h to detect hypodiploid phase. At the end of the stipulated period, the cells were harvested and washed. For the detection of Ca2+ and ROS, the cells were separately stained by 4 μM fluo 3 acetoxymethyl ester (Fluo 3-AM) and 5 μM dihydrodichlorofluorescein diacetate (H2DCF-DA) at 37°C for 30 min. For the detection of autophagosome, the cells were permeabilized with 0.25 mg/mL digitonin for 5 min. Following this, the cells were washed twice, pelleted by centrifugation at 1000 g, and incubated with anti-LC3B antibody (1:2000) for 30 min. After two washes, the cells were stained by Alexa Fluor® 488 anti-rabbit IgG antibody (1:500) for 1 h and protected from light. For the detection of hypodiploid phase, the cells were fixed by 70% ethanol at -20°C overnight and then washed. The resulting solution was incubated with 10 μg/mL propidium iodide (PI), 100 μg/mL RNase A, and 0.1% TritonTM X-100 for 30 min. All above cells were washed and filtered before analyzed by FACScan Becton-Dickinson flow cytometer (Hercules, CA, US). 10000 cells per sample were collected, and the mean fluorescence intensity (MFI) and percentage of hypodiploid phase detected by FL1-H (530 ± 15 nm) and FL2-A (585 ± 21 nm) respectively were analyzed using WinMDI 2.8 software. (Kaminskyy et al., 2011; Wallen et al., 1982; Zachwieja et al., 2005)
Western blotting
The cells (5 × 10⁵ cells/10 mL/dish) were seeded in 10 cm dishes for 24 h. After 24 h of incubation, the cells were treated with 10 mL medium containing 0, 10, 20, and 30 μM eburicoic acid for 24 h. After 24 h of treating, total cell extracts were prepared in protein extraction solution which contains 1 mM phenylmeth anesulfonylfluoride, 1 mM ethylenediaminetetraacetic acid, 1 μM pepstatin A, 1 μM leupeptin, and 0.1 μM aprotinin. The cell lysates were sonicated and cleared by centrifugation, and the protein concentration in the lysates was measured by Lowry's method (Bradford, 1976). 50 μg protein was loaded over 8, 10, or 12% sodium dodecyl sulfate-polyacrylamide gel electrophoresis gels, transferred to polyvinylidene fluoride membranes, blotted with specific primary antibodies respectively, and then labeled by horseradish peroxidase-conjugated secondary antibody according to the manufacturer's instructions. The membranes were performed using the enhanced chemiluminescence and EC3 300 Corning UVP biospectrum AC system (Corning, NY, US), and the relative density of each band after normalization for β-actin was analyzed using Image J 1.45 software. (Wu et al., 2004)
Statistical Analysis
All experiments were performed in triplicate and presented as mean ± standard deviation. Statistical analyses were performed using one-way analysis of variance and Duncan's multiple comparison tests with IBM SPSS Statistics 19 software.
Results
Eburicoic Acid Reduced Hep 3B Cell Viability
After treating Hep 3B cells with 0, 10, 20, and 30 μM eburicoic acid for 12, 24, and 48 h respectively, cell viability was analyzed by MTT assay. Figure 1 showed that after being treated with 10, 20, and 30 μM eburicoic acid respectively for 12 h, compared to the negative control (0.3% DMSO, cell survival rate set at 100%), the cell survival rates were 82.4 ± 4.5, 68.4 ± 6.5, and 52.4 ± 2.9% respectively; at 24 h of treatment, cell survival rates decreased to 56.1 ± 1.2, 48.8 ± 2.5, and 42.2 ± 2.2% respectively; at 48 h of treatment, cell survival rates increased to 60.0 ± 2.0, 55.9 ± 3.8, and 53.5 ± 3.5%. In addition, the half maximal inhibitory concentration (IC50) treated for 24 h was 18.4 μM.
Figure 1.
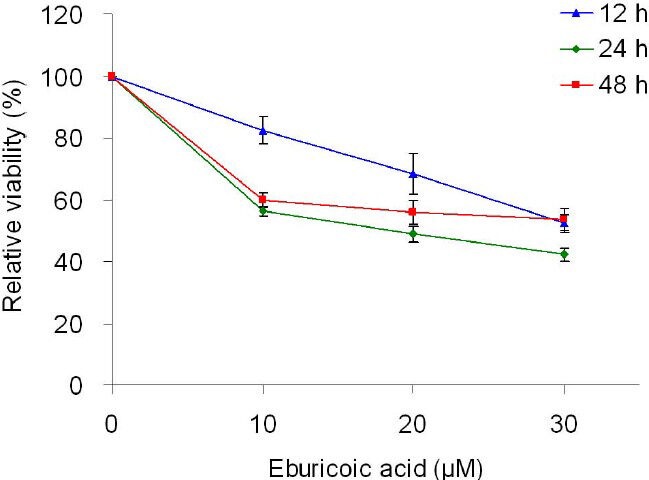
Effect of eburicoic acid on cell viability in Hep 3B cells After incubation of the cells with 0, 10, 20, and 30 μM eburicoic acid for 12, 24, and 48 h, cell viability was determined by MTT assay. Data are expressed as percentage of negative control (0.3% DMSO).
Eburicoic Acid Increased Hep 3B Cell Granularity
After treating Hep 3B cells with 0, 10, 20, and 30 μM eburicoic acid respectively for 24 h, cell morphology was observed by inverted phase contrast microscope, and cell size and granules were analyzed by flow cytometry. The qualitative results shown in Figure 2 indicated that the amount of suspended cells increased as the eburicoic acid dose increased; the internal granules increased significantly even in that of the attached cells, but the size and shape of the cells had no significant difference. We further discovered from the quantitative results shown that although the cell size (forward scatter) had no significant difference when the eburicoic acid dose increased in Figure 3A, cell granules (side scatter) increased significantly (the maximum 1.40 times greater than the minimum) and had a dose dependent effect in Figure 3B, which was consistent with the results observed by the microscope.
Figure 2.
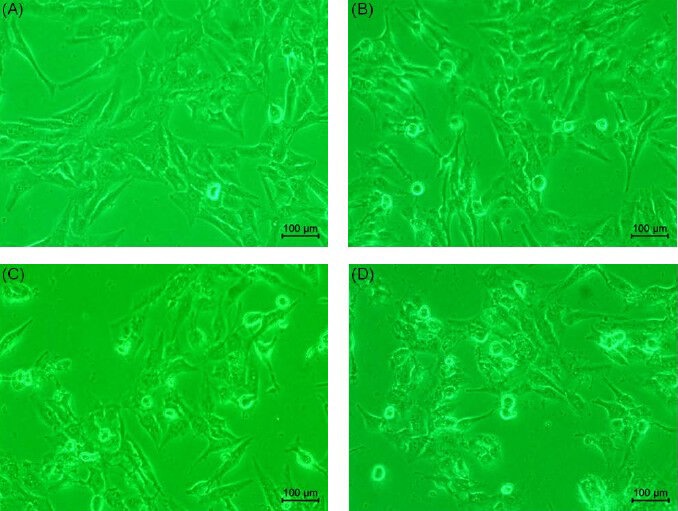
Effect of eburicoic acid on cell morphology in Hep 3B cells After incubation of the cells with (A) 0, (B) 10, (C) 20, and (D) 30 μM eburicoic acid for 24 h, cell morphology was observed by inverted phase-contrast microscope.
Figure 3.
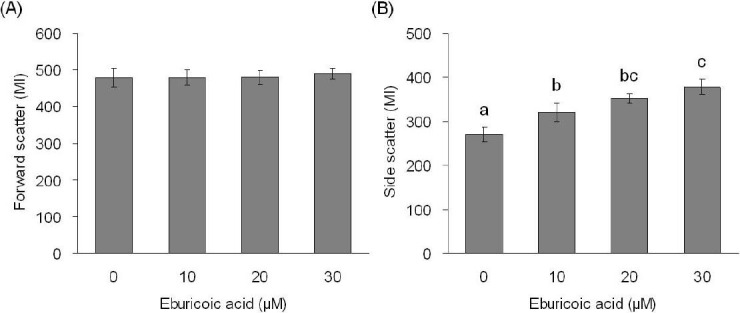
Effect of eburicoic acid on cell size and granularity in Hep 3B cells
After incubation of the cells with 0, 10, 20, and 30 μM eburicoic acid for 24 h, cell (A) size and (B) granularity were analyzed by flow cytometry. Different letters (a-c) represent statistically significant differences among treatments (p < 0.05).
Eburicoic Acid Could not Induced Apoptosis or Necrosis Obviously in Hep 3B Cells
After treating Hep 3B cells with 0, 10, 20, and 30 μM eburicoic acid respectively for 48 h, the proportion of hypodiploid was analyzed by flow cytometry. Figure 4 showed that after being treated with 0, 10, 20, and 30 μM eburicoic acid respectively for 48 h, the proportion of hypodiploid were all very low (0.31%, 0.60%, 0.87%, and 1.08%, respectively). After treating Hep 3B cells with 0, 10, 20, and 30 μM eburicoic acid and lysis solution respectively for 24 h, the degree of cell damage was analyzed by LDH leakage assay. Figure 5 showed that after being treated with 10, 20, and 30 μM eburicoic acid respectively for 24 h, compared with the positive control (lysis solution, lactate dehydrogenase leakage rate set at 100%) and negative control (0.3% DMSO, lactate dehydrogenase leakage rate set at 0%), the lactate dehydrogenase leakage rates were 12.8 ± 4.3, 10.0 ± 5.0, and 12.3 ± 1.6% respectively, which were all low.
Figure 4.
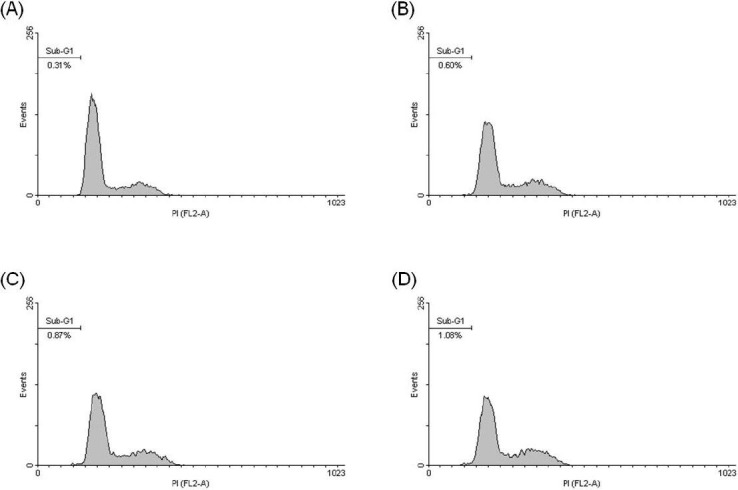
Effect of eburicoic acid on percentage of hypodiploid phase in Hep 3B cells
After incubation of the cells with (A) 0, (B) 10, (C) 20, and (D) 30 μM eburicoic acid for 48 h, percentage of hypodiploid phase (sub-G1 phase) was analyzed by flow cytometry.
Figure 5.
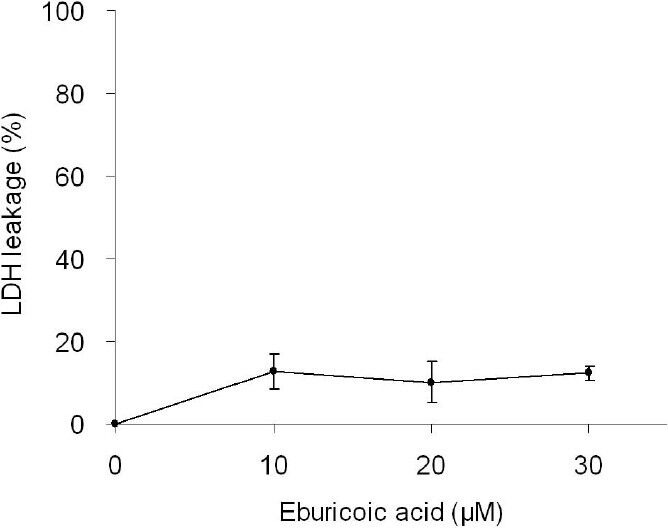
Effect of eburicoic acid on degree of cell disruption in Hep 3B cells
After incubation of the cells with 0, 10, 20, and 30 μM eburicoic acid and lysis solution for 24 h, degree of cell disruption was determined by LDH leakage assay. Data are expressed as percentage between positive control (lysis solution) and negative control (0.3% DMSO).
Eburicoic Acid Induced Autophagy in Hep 3B Cells
After treating Hep 3B cells with 0, 10, 20, and 30 μM eburicoic acid respectively for 24 h, LC3 distribution was observed with confocal immunofluorescence microscopy, and the autophagosome formation volume was analyzed by flow cytometry. We discovered from the qualitative results shown in Figure 6 that as the eburicoic acid dose increased, the green fluorescences (the LC3-II accumulated at the surface of autophagosomes or autolysosomes) also increased. We further discovered from the quantitative results of Figure 7 that as the eburicoic acid dose increased, the fluorescence intensity enhanced to the right, the autophagosome and autophagic lysosomal content also increased significantly (the maximum 1.85 times greater than the minimum) and had a dose dependent effect, which was consistent with the results observed with immunofluorescence microscopy.
Figure 6.
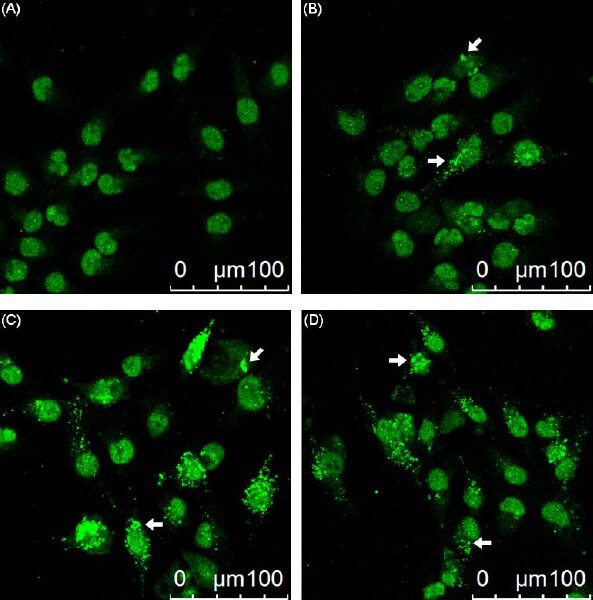
Effect of eburicoic acid on LC3 distribution in Hep 3B cells After incubation of the cells with (A) 0, (B) 10, (C) 20, and (D) 30 μM eburicoic acid for 24 h, LC3 distribution was observed by immunofluorescence. Arrows indicated the autophagosomes/autolysosomes.
Figure 7.
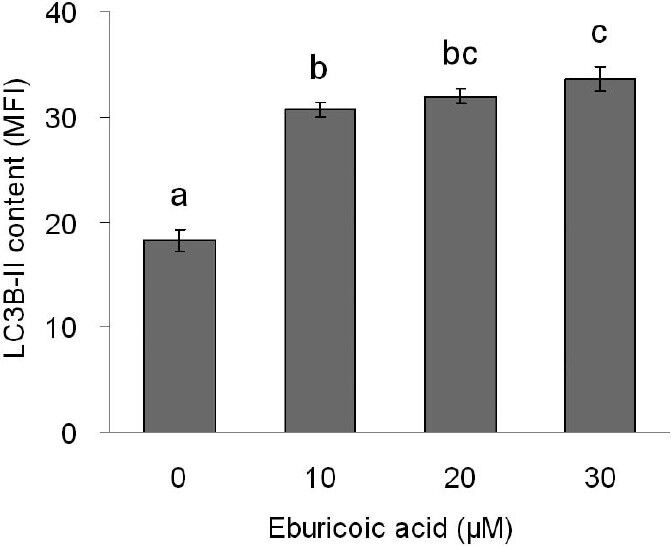
Effect of eburicoic acid on amount of autophagosome formation in Hep 3B cells
After incubation of the cells with 0, 10, 20, and 30 μM eburicoic acid for 24 h, amount of autophagosome formation was analyzed by flow cytometry. Different letters (a-c) represent statistically significant differences among treatments (p < 0.05).
Eburicoic Acid Promoted ROS Generation and ATP Depletion in Hep 3B Cells
After treating Hep 3B cells with 0, 10, 20, and 30 μM eburicoic acid respectively for 2 h, ROS generation was analyzed by flow cytometry; in addition, after treating Hep 3B cells with the same concentrations of eburicoic acid for 24 h, ATP level was analyzed with bioluminescence. Figure 8 showed that as the eburicoic acid dose increased, the fluorescence intensity enhanced to the right, the ROS generation in cells increased significantly (the maximum 1.75 times greater than the minimum) and had a dose dependent effect. Figure 9 showed that as the eburicoic acid dose increased, the ATP level in cells decreased significantly (the minimum 0.78 lower than the maximum) and had a dose dependent effect.
Figure 8.
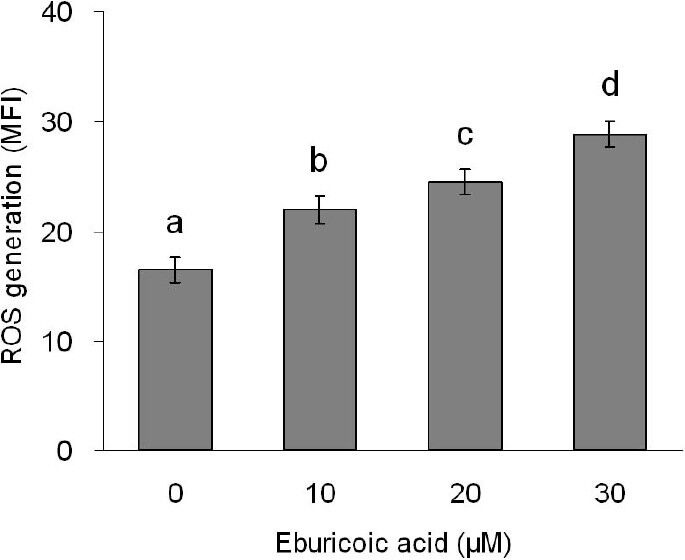
Effect of eburicoic acid on ROS generation in Hep 3B cells
After incubation of the cells with 0, 10, 20, and 30 μM eburicoic acid for 2 h, ROS generation was analyzed by flow cytometry. Different letters (a-d) represent statistically significant differences among treatments (p < 0.05).
Figure 9.
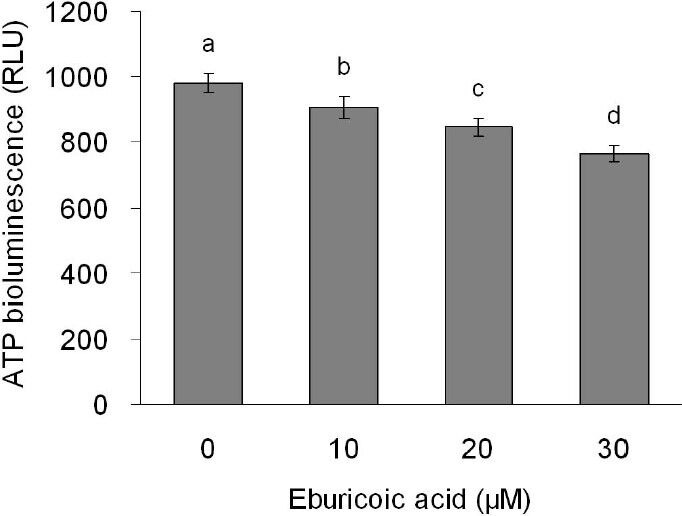
Effect of eburicoic acid on ATP level in Hep 3B cells
After incubation of the cells with 0, 10, 20, and 30 μM eburicoic acid for 24 h, ATP level was determined by bioluminescence. Different letters (a-d) represent statistically significant differences among treatments (p < 0.05).
Eburicoic Acid Induced Autophagy through the ER Stress Pathway in Hep 3B Cells
After treating Hep 3B cells with 0, 10, 20, and 30 μM eburicoic acid respectively for 30 minutes, calcium ion flux was analyzed by flow cytometry; in addition, after treating Hep 3B cells with the same conditions of eburicoic acid for 24 h, calcium ion signal-related protein expression was analyzed by Western blot. Figure 10 showed that as the eburicoic acid dose increased, the fluorescence intensity enhanced to the right, calcium ion released from the endoplasmic reticulum to the cytoplasm increased significantly (the maximum 2.23 times greater than the minimum) and had a dose dependent effect. Figure 11 showed that after being treated with 10, 20, and 30 μM eburicoic acid respectively for 24 h, the p-DAPK1 (Ser308) expressions were respectively 0.92, 0.69, and 0.64 times greater than that of the negative control (0.3% DMSO), which expressions were all less than the negative control; the p-Beclin-1 (Thr119) expressions were respectively 1.29, 1.16, and 1.02 times greater than that of the negative control; the LC3B-II expressions were 1.54, 1.99, and 2.07 times greater than that of the negative control. All expressions were more significant than that of the negative control. After treating Hep 3B cells with 0, 10, 20 and 30 μM eburicoic acid respectively for 24 h, unfolded protein response-related protein expression was analyzed by Western blot. Figure 12 showed that after being treated with 10, 20, and 30 μM eburicoic acid respectively for 24 h, the BiP expressions were respectively 1.47, 1.21, and 1.49 times greater than that of the negative control (0.3% DMSO); the p-JNK2/3 (Tyr185) expressions were respectively 1.77, 1.93, and 1.80 times greater than that of the negative control; the p-JNK1 (Thr183) expressions were respectively 1.36, 1.49, and 1.88 times greater than that of the negative control; the p-Bcl-2 (Ser70) expressions were respectively 2.12, 2.33, and 2.17 times greater than that of the negative control. All expressions were more significant than that of the negative control.
Figure 10.
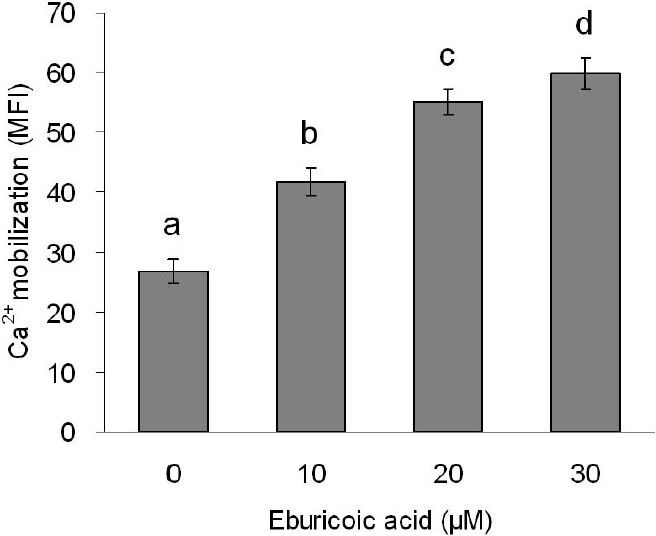
Effect of eburicoic acid on Ca2+ mobilization in Hep 3B cells
After incubation of the cells with 0, 10, 20, and 30 μM eburicoic acid for 30 min, Ca2+ mobilization was analyzed by flow cytometry. Different letters (a-d) represent statistically significant differences among treatments (p < 0.05).
Figure 11.
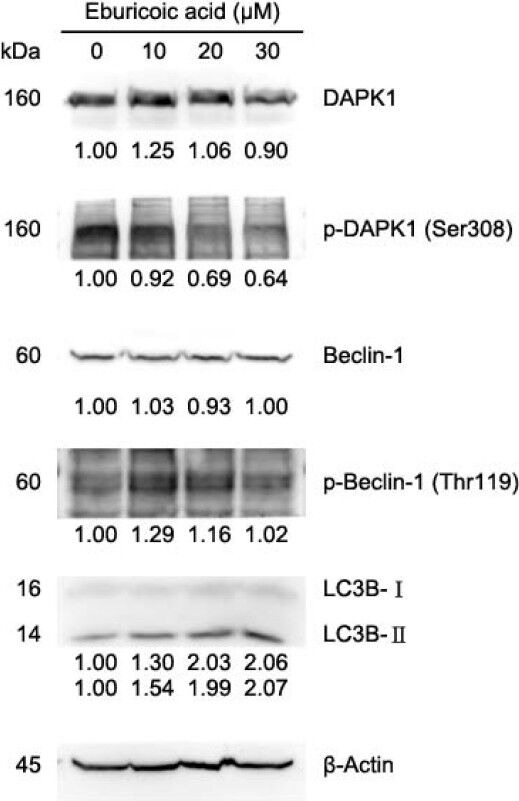
Effect of eburicoic acid on expression of Ca2+ signaling-related proteins and LC3 in Hep 3B cells
After incubation of the cells with 0, 10, 20, and 30 μM eburicoic acid for 24 h, expression of Ca2+ signaling-related proteins and LC3 were assessed by Western blotting. Protein levels are expressed as multiple of negative control (0.3% DMSO) by β-Actin-normalized densitometry and shown on bottom of each band.
Figure 12.
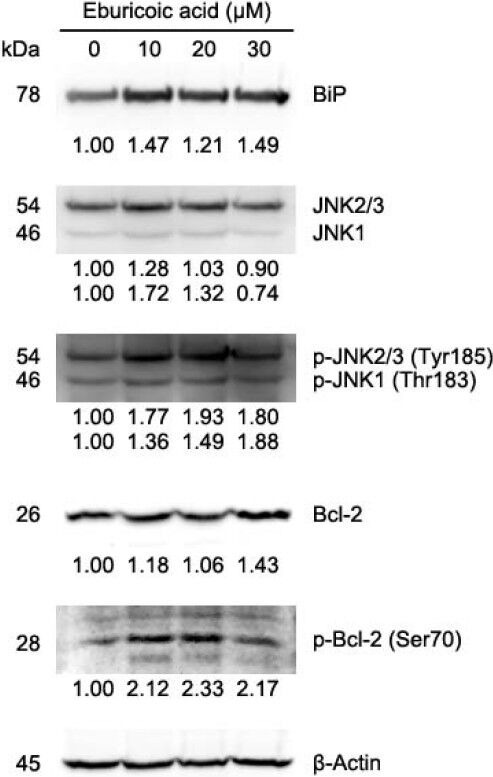
Effect of eburicoic acid on expression of unfolded protein response-related proteins in Hep 3B cells
After incubation of the cells with 0, 10, 20, and 30 μM eburicoic acid for 24 h, expression of unfolded protein response-related proteins were assessed by Western blotting. Protein levels are expressed as multiple of negative control (0.3% DMSO) by β-Actin-normalized densitometry and shown on bottom of each band.
Discussion
The results of the cell viability analysis showed that eburicoic acid could effectively inhibit human hepatoma Hep 3B cells survival, and showed a dose dependent relationship. The IC50 at 24 h was only 18.4 μM, which was equivalent to 8.7 μg/mL; this showed a significant inhibitory effect on liver cancer cell proliferation. It is worth noting that although cells treated with eburicoic acid for 24 h could only survive less than 12 h, cells treated with eburicoic acid for 48 h could survive more than 24 h; the results showed that the cell viability did not have a time dependent effect, and the efficacy could not be sustained to 48 h.
According to the results of cell morphology observation and analysis, eburicoic acid could cause the declination of the adhesion of human hepatoma Hep 3B cells and the increase of granules; it did not affect the size and shape of the cells; it was consistent with the characteristics of autophagy, but not with apoptosis (smaller cells, unchanged granules) and necrosis (larger and rounder cells) characteristics. We discovered from the analysis of hypodiploid proportion and cell damage degree that, compared with the high inhibitory effect of MTT assay, the hypodiploid proportion and lactate dehydrogenase leakage rate were both low, which showed that eburicoic acid could not effectively cause DNA fragmentation and cell bursting in Hep 3B cells; this proved that neither apoptosis nor necrosis was the main cell death mode, which was consistent with the results of cell morphology observation. The results of autophagosome formation observation and analysis showed that eburicoic acid could converse LC3-I to LC3-II, and produce a large number of autophagosomes and autolysosomes, which was also consistent with the results of cell morphology observation. We concluded from the results above that the major cell death mode of eburicoic acid-induced Hep 3B is autophagy rather than apoptosis or necrosis.
Shown by the results of ROS production and ATP level analysis, eburicoic acid could increase the ROS generation in human hepatoma Hep 3B cells, and also reduce the ATP level of the cells, which suggested that endoplasmic reticulum may be damaged by oxidation and be in a hypoxic state. Shown by the results of the calcium ion signal analysis, eburicoic acid may cause calcium ion to release from the endoplasmic reticulum to the cytoplasm and dephosphorylate DAPK; when DAPK is activated, it could further phosphorylate Beclin-1. In addition, shown by the results of unfolded protein response analysis, eburicoic acid may cause the BiP and IRE1 of the endoplasmic reticulum to dissociate, and accelerate IRE1 to form dimers in order to phosphorylate downstream JNK; when JNK is activated, it could further phosphorylate Bcl-2. The phosphorylation of Beclin-1 and Bcl-2 would separate the two proteins; the separated Beclin-1 may bind with the class III PI3K on isolation membrane, and eventually lead to autophagy. It is worth noting that as the eburicoic acid dose increased, the expression of p-Beclin-1 (Thr119), p-JNK2/3 (Tyr185), p-JNK1 (Thr183) and p-Bcl-2 (Ser70) first increased then declined (however still more significant than that of the negative control), presumably because a higher concentration of eburicoic acid could induce a faster and more intense autophagy, and autophagosome would degrade the upper stream proteins mentioned above, which would therefore result in a negative feedback.
Persisting endoplasmic reticulum pressure will cause apoptosis or autophagy and eventually lead to cell death; the cell death mode, on the other hand, depends on factors such as cell types, growth conditions, and drug structures. After comparing the protein expressions of apoptosis and autophagy, we discovered that apoptosis would inhibit Bcl-2 and Bcl-XL while autophagy could activate Bcl-2 and Bcl-XL, which happened to be opposite effects (Zhou et al., 2011). Therefore, Bcl-2 and Bcl-XL expression change is likely to be the key that defines the death modes of cells under ER stress. Previous studies have shown that the ethyl acetate extract of Antrodia cinnamomea fruit body can induce human hepatoma Hep 3B cell apoptosis by the ER stress pathway, increase the calcium ion concentration and calpain activity in the cytoplasm, and reduce Bcl-XL expression (Kuo et al., 2006). We discovered in this study that eburicoic acid could cause ER stress in Hep 3B cells, and also increase calcium ion concentration in the cytoplasm; these results were consistent with the previous studies. However, eburicoic acid could not induce apoptosis in Hep 3B cells; instead it caused autophagy, and also increased Bcl-2 expression. The reason cell death modes differ may be due to the difference between Bcl-2 and Bcl-XL expression. Other studies have indicated that the antcin B and antcin H in Antrodia cinnamomea fruit bodies can induce human colon cancer HT-29 cell apoptosis, and also promote PARP cleavage and reduce Bcl-2 expression (Yeh et al., 2009). Therefore, the mechanism of the ethyl acetate extract of Antrodia cinnamomea fruit bodies inhibiting Hep 3B cells may not only be affected by eburicoic acid, but also by many other pure substances, such as apoptosis lead by the combination of antcin B and antcin H and a wide variety of active substances; this showed that the anti-cancer mechanism of Antrodia cinnamomea fruit bodies is very diverse.
In conclusion, eburicoic acid firstly promoted ROS generation and ATP depletion, leading to ER stress, followed by elevated cytosolic calcium ion concentration and BiP expression, downregulated phosphorylation of DAPK, upregulated phosphorylation of Beclin-1, JNK, and Bcl-2, and finally induced autophagy in Hep 3B cells. The integrated mechanisms are shown in Figure 13. These results indicate that eburicoic acid has significant anti-liver cancer effects and more distinctive mechanisms. Coupled with these findings and the high content of eburicoic acid in the fruiting bodies of basswood cultivated Antrodia cinnamomea, eburicoic acid has the potential for mass production and to assist cancer therapy.
Figure 13.
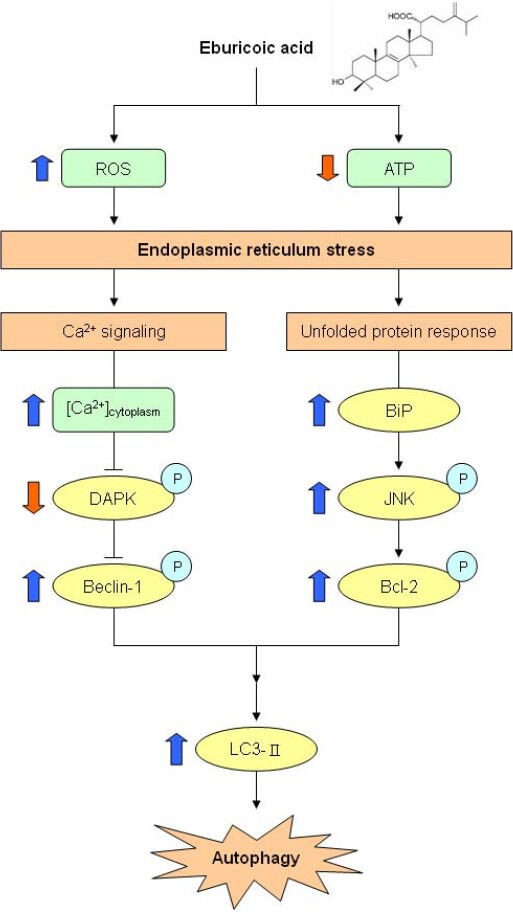
Proposed model of eburicoic acid induced apoptosis in human hepatoma Hep 3B cells
The thick arrows indicated the expression changes in our results.
Previous studies have indicated that eburicoic acid can inhibit ROS generation in human neutrophils and monocytes to attain immunomodulatory effects (Shen et al., 2003), promote human leukemia HL-60 cells DNA fragmentation, increase caspase-3 activity and PARP cleavage, and cause apoptosis (León et al., 2004). The results in this study, however, showed that eburicoic acid could promote ROS generation in human hepatoma Hep 3B cells, which was inconsistent with the previous studies. This showed that eburicoic acid may cause different responses in different cell lines, but does not necessarily have inhibitory effects in other cancer types; even if there were inhibitory effects, the anti-cancer mechanism may still be very different. Therefore, the anti-cancer effects and mechanisms of eburicoic acid on other cancer types are worth researching. Moreover, eburicoic acid performed great inhibitory effects on Hep 3B cell activity, which could also be further studied with animal models. By implanting Hep 3B cells into nude mice, liver cancer could be induced; by tube feeding different doses of eburicoic acid, the absorption effect of eburicoic acid in animals, metabolism, and liver cancer inhibitory effects could be investigated. We expect this study to provide reference for future human trials and drug development.
Abbreviations Used
ADP, adenosine-5’-diphosphate; ATP, adenosine-5’-triphosphate; Bcl-2, B-cell lymphoma 2; BCRC, bioresource collection and research center; Bip, immunoglobulin heavy chain-binding protein; DAPK, death associated protein kinase; DMSO, dimethyl sulfoxide; DNA, deoxyribonucleic acid; ER, endoplasmic reticulum; FL1-H, fluorescence 1 height; FL2-A, fluorescence 2 area; Fluo3-AM, fluo 3 acetoxymethyl ester; H2DCF-DA, dihydrodichlorofluorescein diacetate; JNK, c-Jun N-terminal kinase; LC3, microtubule-associated protein light chain 3; LDH, lactate dehydrogenase; MFI, mean fluorescence intensity; MI, mean intensity; MTT, 3-(4,5-cimethylthiazol-2-yl)-2,5-diphenyl tetrazolium bromide; PI, propidium iodide; RLU, relative luminescence units; RNase A, ribonuclease A; ROS, reactive oxygen species.
Acknowledgements
This study was supported by grants from the National Science Council (NSC 100-2313-B-002-036), Taiwan.
References
- 1.Ao Z.H, Xu Z.H, Lu Z.M, Xu H.Y, Zhang X.M, Dou W.F. Niuchangchih (Antrodia camphorata) and its potential in treating liver diseases. J Ethnopharmacol. 2009;121:194–212. doi: 10.1016/j.jep.2008.10.039. [DOI] [PubMed] [Google Scholar]
- 2.Bradford M.M. A rapid and sensitive method for the quantitation of microgram quantities of protein ultilizing the principle of protein-dye binding. Anal Biochem. 1976;72:248–254. doi: 10.1016/0003-2697(76)90527-3. [DOI] [PubMed] [Google Scholar]
- 3.Chang T.T, Chou W.W. Antrodia cinnamomea sp. nov. on Cinnamomum kanehirai in Taiwan. Mycol. Res. 1995;99:756–758. [Google Scholar]
- 4.Chen J.C, Lin W.H, Chen C.N, Sheu S.J, Huang S.J, Chen Y.L. Development of Antrodia camphorata mycelium with submerged culture. Fung Sci. 2001;16:7–22. [Google Scholar]
- 5.Colombo M, Donato M.F. Prevention of hepatocellular carcinoma. Semin Liver Dis. 2005;25:155–161. doi: 10.1055/s-2005-871195. [DOI] [PubMed] [Google Scholar]
- 6.Crouch S.P, Kozlowski R, Slater K.J, Fletcher J. The use of ATP bioluminescence as a measure of cell proliferation and cytotoxicity. J. Immunol. Methods. 1993;160:81–88. doi: 10.1016/0022-1759(93)90011-u. [DOI] [PubMed] [Google Scholar]
- 7.Decker T, Lohmann-Matthes M.L. A quick and simple method for the quantitation of lactate dehydrogenase release in measurements of cellular cytotoxicity and tumor necrosis factor (TNF) activity. J Immunol Methods. 1988;15:61–69. doi: 10.1016/0022-1759(88)90310-9. [DOI] [PubMed] [Google Scholar]
- 8.Hussain S.P, Schwank J, Staib F, Wang X.W, Harris C.C. TP53 mutations and hepatocellular carcinoma: insights into the etiology and pathogenesis of liver cancer. Oncogene. 2007;26:2166–2176. doi: 10.1038/sj.onc.1210279. [DOI] [PubMed] [Google Scholar]
- 9.Kaminskyy V, Abdi A, Zhivotovsky B. A quantitative assay for the monitoring of autophagosome accumulation in different phases of the cell cycle. Autophagy. 2011;7:83–90. doi: 10.4161/auto.7.1.13893. [DOI] [PubMed] [Google Scholar]
- 10.Kaufman R.J. The cellular response to accumulation of unfolded proteins in the endoplasmic reticulum. Faseb J. 2002;16:A891. [Google Scholar]
- 11.Kerr J.F, Wyllie A.H, Currie A.R. Apoptosis: a basic biological phenomenon with wide-ranging implications in tissue kinetics. Br J Cancer. 1972;26:239–257. doi: 10.1038/bjc.1972.33. [DOI] [PMC free article] [PubMed] [Google Scholar]
- 12.Kroemer G, Reed J.C. Mitochondrial control of cell death. Nat Med. 2000;6:513–519. doi: 10.1038/74994. [DOI] [PubMed] [Google Scholar]
- 13.Krysko D.V, Vanden Berghe T, D’Herde K, Vandenabeele P. Apoptosis and necrosis: detection, discrimination and phagocytosis. Methods. 2008;44:205–221. doi: 10.1016/j.ymeth.2007.12.001. [DOI] [PubMed] [Google Scholar]
- 14.Kuo P.L, Hsu Y.L, Cho C.Y, Ng L.T, Kuo Y.H, Lin C.C. Apoptotic effects of Antrodia cinnamomea fruiting bodies extract are mediated through calcium and calpain-dependent pathways in Hep 3B cells. Food Chem Toxicol. 2006;44:1316–1326. doi: 10.1016/j.fct.2006.02.009. [DOI] [PubMed] [Google Scholar]
- 15.Kuo Y.H, Lin B.F. Compounds from Antrodia camphorata. Official gazette of the United States patent and trademark office patents. 2011 [Google Scholar]
- 16.Laszczyk M.N. Pentacyclic triterpenes of the lupane, oleananeand ursane group as tools in cancer therapy. Planta Med. 2009;75:1549–1560. doi: 10.1055/s-0029-1186102. [DOI] [PubMed] [Google Scholar]
- 17.León F, Quintana J, Rivera A, Estévez F, Bermejo J. Lanostanoid triterpenes from Laetiporus sulphureus and apoptosis induction on HL-60 human myeloid leukemia cells. J. Nat Prod. 2004;67:2008–2011. doi: 10.1021/np049762o. [DOI] [PubMed] [Google Scholar]
- 18.Mizushima N, Levine B, Cuervo A.M, Klionsky D.J. Autophagy fights disease through cellular self-digestion. Nature. 2008;451:1069–1075. doi: 10.1038/nature06639. [DOI] [PMC free article] [PubMed] [Google Scholar]
- 19.Mosmann T. Rapid colorimetric assay for cellular growth and survival: application to proliferation and cytotoxicity assays. J Immunol Methods. 1983;65:55–63. doi: 10.1016/0022-1759(83)90303-4. [DOI] [PubMed] [Google Scholar]
- 20.Shen Y.C, Chen C.F, Wang Y.H, Chang T.T, Chou C.J. Evaluation of the immuno-modulating activity of some active principles isolated from the fruiting bodies of Antrodia camphorata. Chinese Pharm J. 2003;55:313–318. [Google Scholar]
- 21.Thuerauf D.J, Marcinko M, Gude N, Rubio M, Sussman M.A, Glembotski C.C. Activation of the unfolded protein response in infarcted mouse heart and hypoxic cultured cardiac myocytes. Circ. Res. 2006;99:275–282. doi: 10.1161/01.RES.0000233317.70421.03. [DOI] [PubMed] [Google Scholar]
- 22.van der Vlies D, Makkinje M, Jansens A, Braakman I, Verkleij A.J, Wirtz K.W, Post J.A. Oxidation of ER resident proteins upon oxidative stress: effects of altering cellular redox/antioxidant status and implications for protein maturation. Antioxid Redox Sign. 2003;5:381–387. doi: 10.1089/152308603768295113. [DOI] [PubMed] [Google Scholar]
- 23.Verfaillie T, Salazar M, Velasco G, Agostinis P. Linking ER stress to autophagy: potential implications for cancer therapy. Int J Cell Biol 2010. 2010 doi: 10.1155/2010/930509. 930509. [DOI] [PMC free article] [PubMed] [Google Scholar]
- 24.Wallen C.A, Higashikubo R, Dethlefsen L.A. Comparison of two flow cytometric assays for cellular RNA─acridine orange and propidium iodide. Cytometry. 1982;3:155–160. doi: 10.1002/cyto.990030303. [DOI] [PubMed] [Google Scholar]
- 25.Wu C.C, Chung J.G, Tsai S.J, Yang J.H, Sheen L.Y. Differential effects of allyl sulfides from garlic essential oil on cell cycle regulation in human liver tumor cells. Food Chem. Toxicol. 2004;42:1937–1947. doi: 10.1016/j.fct.2004.07.008. [DOI] [PubMed] [Google Scholar]
- 26.Wu S.H, Ryvarden L, Chang T.T. Antrodia camphorata (“niu-chang-chih”), new combination of a medicinal fungus in Taiwan. Bot. Bull. Acad. Sinica. 1997;38:273–275. [Google Scholar]
- 27.Yeh C.T, Rao Y.K, Yao C.J, Yeh C.F, Li C.H, Chuang S.E, Luong J.H.T, Lai G.M, Tzeng Y.M. Cytotoxic triterpenes from Antrodia camphorata and their mode of action in HT-29 human colon cancer cells. Cancer Lett. 2009;285:73–79. doi: 10.1016/j.canlet.2009.05.002. [DOI] [PubMed] [Google Scholar]
- 28.Zachwieja J, Zaniew M, Bobkowski W, Stefaniak E, Warzywoda A, Ostalska-Nowicka D, Dobrowolska-Zachwieja A, Lewandowska-Stachowiak M, Siwinska A. Beneficial in vitro effect of N-acetyl-cysteine on oxidative stress and apoptosis. Pediatr Nephrol. 2005;20:725–731. doi: 10.1007/s00467-004-1806-4. [DOI] [PubMed] [Google Scholar]
- 29.Zhou F, Yang Y, Xing D. Bcl-2 and Bcl-xL play important roles in the crosstalk between autophagy and apoptosis. FEBS J. 2011;278:403–413. doi: 10.1111/j.1742-4658.2010.07965.x. [DOI] [PubMed] [Google Scholar]