Abstract
Bupleurum falcatum L. has been used traditionally as a medicinal herb in Korean medicine. The hexane fraction of BF (HFBF), which was profiled with Direct Analysis in Real Time-Mass Spectrometry (DART-MS), activates the secretion of glucagon-like peptide-1 (GLP-1) in NCI-H716 cells significantly. We performed a microarray analysis and GLP-1 ELISA assay, as well as calcium imaging experiments with inhibitors, to investigate the mechanism of action of the HFBF. Through the microarray analysis, it was found that the ITPR2 gene that encodes the inositol 1,4,5-trisphosphate (IP3) receptor is up-regulated and the HFBF induces cell depolarization by inhibiting the voltage-gated channel expression in NCI-H716 cells. In addition, we found that the intracellular calcium in NCI-H716 cells, with Gallein, U73122, and 2APB as inhibitors, was decreased. These results suggest that the HFBF activates the GLP-1 secretion through the Gβγ pathways in the enteroendocrine L cells after treatment with the HFBF.
1. Introduction
Bupleurum falcatum L. (BF) has been used traditionally as a medical herb [1]. It is used for the preparation of herbal remedies and also used as an ingredient in herbal tea and traditional fermented beverages. BF is also known for its therapeutic effects in the treatment of diabetes [1]. Despite its outstanding effects during clinical trials on diabetes mellitus, its mode of action has not been examined. To study the effects of a herbal sample, BF was extracted and fractionated as described in [2, 3]. The hexane fractions of Bupleurum falcatum L. (HFBF) samples were used to treat enteroendocrine NCI-H716 cells and subsequently a GLP-1 ELISA was performed. The microarray was also examined using isolated RNA from HFBF treated NCI-H716 cells.
The NCI-H716 cell line, the human intestinal cell, is widely used to study glucagon-like peptide-1 (GLP-1) secretion [4, 5]. GLP-1 is an incretin hormone that is released by enteroendocrine L cells in the gastrointestinal tract (GI) and has received considerable interest because of its ability to amplify insulin secretion in pancreatic β-cells [6]. GLP-1 is secreted within minutes of nutrient ingestion and boosts the disposal of ingested nutrients.
Seven-transmembrane receptor guanine nucleotide-binding protein (G protein) coupled receptor (GPCR), also known as a G protein-linked receptor, is composed of Gα, Gβ, and Gγ. Both Gα and Gβγ are related to the GPCR signaling pathway. The Gα subunit is related to the cyclic AMP (cAMP), protein kinase A (PKA), and phosphodiesterases (PDEs). In addition, the Gβγ subunit activates the phospholipase C β (PLC β) that separates the phospholipid phosphatidylinositol 4,5-bisphosphate (PIP2) into diacyl glycerol (DAG) and inositol 1,4,5-trisphosphate (IP3). IP3 then disperses through the cytosol to bind to IP3 receptors, particularly in the calcium channels in the smooth endoplasmic reticulum (ER). This leads to the increase of Ca2+ concentration in the cytosol and causes a cascade of intracellular changes and activities. Also, Ca2+ and DAG together activate the protein kinase C (PKC). Hormone secretion such as GLP-1 is highly related to the intracellular Ca2+ signaling, which is generally related to the two processes. One is the Ca2+ influx due to the depolarization and transmembrane potassium channels. The other is Ca2+ release from the intracellular calcium storage area including the endoplasmic reticulum [7].
The G protein-gated ion channels are specific ion channels located in the plasma membrane that are activated by a family of associated proteins. These ion channels allow for the selective movement of certain ions across the plasma membrane in cells. Incretin hormones modulate voltage-gated potassium (Kv) channels [2, 3]. Incretin hormones like GLP-1 also activate the closure of ATP-sensitive potassium channels resulting in membrane depolarization and the activation of voltage-dependent Ca2+ channels resulting in the increase in intracellular Ca2+. GLP-1 stimulates insulin secretion through the modulation of the ATP-dependent potassium channel, increasing the Ca2+ influx and releasing Ca2+ from intracellular stores [8].
In this study, we demonstrate that HFBF induces GLP-1 secretion via the GPCR signaling pathway, especially through the Gβγ-mediated pathway. This study provides the important information of the HFBF effects to promote GLP-1 secretion and the possibility that the medical herb can be used as a therapeutic agent of diabetes mellitus.
2. Materials and Methods
2.1. Preparation of Bupleurum falcatum L. Extracts
The herbal extracts and fractions were purchased from Kyung-Hee Oriental Herbal Medicine Research Center. The BF samples were prepared as described in [9, 10]. Briefly, the rind parts of BF were extracted with distilled water (DW) and filtration, evaporation, and freeze drying were performed in order. The extracts were successively partitioned with organic solvents of different polarities to yield the n-hexane (HX) fractions.
2.2. Culture of NCI-H716 Cells
Enteroendocrine NCI-H716 cells were purchased from the Korean Cell Line Bank (KCLB, South Korea) and cultured in RPMI 1640 (Welgene, South Korea) with 10% FBS (Welgene, South Korea), penicillin, and streptomycin. To perform the endocrine differentiation, NCI-H716 cells were incubated in the Matrigel- (BD Bioscience, USA) coated 12-well plates, 1 × 10⁶ cells per well with high glucose DMEM (Welgene, South Korea) with 10% FBS, penicillin, and streptomycin. 48 hours later, the media were removed and the plates were washed with PBS, and then the cells were starved with low glucose DMEM (Welgene, South Korea). After 12 hours, the media were removed and the plates were washed again with PBS. 900 μL of 1 mM calcium chloride PBS was added to each well and 100 μL of each sample was (10x) treated for 1 hour in a CO2 incubator.
2.3. DART-MS Analysis of the Hexane Fraction of Bupleurum falcatum L.
A DART ion source (Ion Sense, Saugus, USA) combined with JMS-T100TD was used in the positive ion mode. Analysis conditions were set as needle voltage 3200 V, electrode 1, 2 voltage 100 V, helium gas flow 3 L/min, temperature 250°C, the first orifice lens 15 V, and ring lens voltage 5 V. Analyzed molecular weight peaks were normalized with polyethylene glycol 600 (PEG 600) [10, 11].
2.4. Cell Viability Assay
The 1 × 10⁴ NCI-H716 cells were seeded in 96-well plate after matrigel coating. After two days of differentiation and starvation overnight, BFHF were treated with three concentrations: 10 μg/mL, 100 μg/mL, and 1000 μg/mL. MTT(3-(4,5-dimethythiazol-2-yl)-2,5-Diphenyl tetrazolium bromide) was obtained from Invitrogen (M6494, USA). Before treatment, it was dissolved as a 1 mg/mL stock and treated with cells. After 2 hours, the supernatants were sucked and 100 μL DMSO was added. After shaking for 20 minutes, read plate with wavelength of 570 nm.
2.5. GLP-1 Secretion Study
Three days before the experiments, the cells were seeded at 1 × 10⁶ cells/well into 12-well culture plates precoated with Matrigel (BD Biosciences, USA). One day before the experiments, serum starvation was carried out with a DMEM low glucose medium for 20 hours. On the day of the experiments, the supernatants were replaced by PBS containing 1 mM CaCl2. Cells were incubated for 1 hour at 37°C with the different fractions of BF, and the GLP-1 was measured using a GLP-1 ELISA Kit (Millipore, USA). The data was normalized with total protein concentrations corresponding to each sample well.
2.6. Calcium Imaging
Differentiated NCI-H716 cells grown on cover glass were incubated overnight. Cytosolic free calcium [Ca2+] was measured using fura-2 fluorescence dye. NCI-H716 cells grown on a matrigel-coated cover-slide bottom dish were washed three times with PBS and incubated in the dark for 30 min at room temperature with fura-2AM (final concentration 1 μM) in PBS. The cells were again washed with PBS three times and analyzed by being illuminated with alternating light of 340 and 380 nm from a rotating filter wheel.
2.7. RNA Isolation
Experiments were carried out in similar GLP-1 secretion study processes and we used 100 μg/mL of the HFBF. Three days before the experiments, the cells were seeded at 1 × 10⁷ cells/well into 6-well culture plates precoated with Matrigel (BD Biosciences, USA). Other procedures were performed in the same way as described in the GLP-1 assay. Total RNA was extracted by using Hybrid-RTM (GeneAll Biotechnology, Korea) according to the manufacturer's instructions. The microarray of each total RNA sample (200 ng) was labeled and amplified using a Low Input Quick Amp Labeling Kit (Agilent Technologies, USA) [10], and the Cy3-labeled aRNAs were resuspended in 50 μL of hybridization solution (Agilent Technologies, USA). After the aRNAs were placed on an Agilent SurePrint G3 Human GE 8 × 60 K Array (Agilent Technologies, USA) and covered by a Gasket 8-plex slide (Agilent Technologies, USA), the slides were hybridized for 17 hours in a 65°C oven. The hybridized slides were washed in 2 × saline-sodium citrate (SSC), 0.1% sodium dodecyl sulfate (SDS) for 2 min, 1 × SSC for 3 min, and then 0.2 × SSC for 2 min at room temperature. The slides were centrifuged at 3000 rpm for 20 sec to dry.
2.8. Microarray of NCI-H716 Cells
Each total RNA sample (200 ng) was labeled and amplified using a Low Input Quick Amp Labeling Kit (Agilent Technologies, CA). The Cy3-labeled aRNAs were resuspended in 50 μL of hybridization solution (Agilent Technologies, CA). After the labeled aRNAs were placed on an Agilent SurePrint G3 Human GE 8 × 60 K array (Agilent Technologies, CA) and covered by a Gasket 8-plex slide (Agilent technologies, CA), the slides were hybridized for 17 hours in a 65°C oven. The hybridized slides were washed in 2 × saline-sodium citrate (SSC), 0.1% sodium dodecyl sulfate (SDS) for 2 min, 1 × SSC for 3 min, and then 0.2 × SSC for 2 min at room temperature. The slides were centrifuged at 3000 rpm for 20 sec to dry.
2.9. Data Analysis
The arrays were analyzed through the use of an Agilent scanner and the associated software and gene expression levels were estimated with the Feature Extraction v10.7.3.1 (Agilent Technologies, USA). Relative signal intensities for each gene were generated using the Robust Multiarray Average Algorithm. The data were processed according to a quantile normalization method using the GeneSpring GX 11.5.1 (Agilent Technologies, USA). This normalization method used for making the distribution of intensities for each array in the set of arrays was the same. The normalization and log transformed intensity values were analyzed using the GeneSpring GX 11.5.1 (Agilent Technologies, USA). Fold change filters included the requirement that the genes are present in at least 2-fold of the controls for upregulated genes and less than 0.5-fold of the controls for downregulated genes.
2.10. Oral Glucose Tolerance Test
The db/db mouse was purchased from DBL (Korea). The db/db mouse (n = 5) was fasted for 16 hours and then orally administered at the volume of 5 g/kg glucose solution [12]. HFBF was treated at the volume of 100 mg/kg before treatment of the glucose. Blood samples, were obtained through the tail vein for 6 time points: 0 (before the HFBF administration), 10, 20, 40, 90, and 120 min after the glucose injection for the determination of blood glucose levels. Blood samples were obtained before gavage (time 0) and 10, 20, 40, 9, and 120 min after gavage for determination of blood glucose by ACCU-CHEK Performa System (Roche, South San Francisco, CA) [13].
2.11. Statistical Analysis
Each ELISA and calcium imaging set of data represents at least two separate experiments and each experiment was performed in triplicate. The significance of the data was analyzed with Prism 5 software with one-way ANOVA and Bonferroni tests to compare each set of data. Bars show the SEMs of the means of the three assays.
3. Results
3.1. DART-MS Analysis of Hexane Fraction of Bupleurum falcatum L.
DART-MS was performed to profile the HFBF (Figure 1). Among the several prominent peaks, isosinensetin (sinensetin) was identified as the second highest peak at m/z 194 ([MH]+ = 373.11704). DART-MS results show isosinensetin is a candidate for the active compound of the HFBF which contributes to the GLP-1 secretion effect. A study using isosinensetin may increase the potential of the HFBF as a therapeutic agent for type 2 diabetes mellitus.
Figure 1.
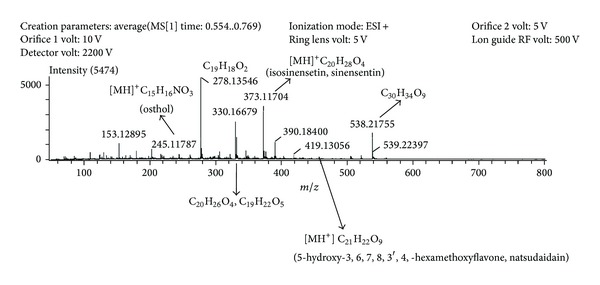
DART-MS profiling of HFBF.
3.2. HFBF Activates Secretion of GLP-1 in NCI-H716 Cells without Cytotoxicity
To confirm the GLP-1 secretion effect due to the HFBF treatment, a GLP-1 assay was conducted. The extracts were diluted with distilled water and were successively partitioned with organic solvents of different polarities as described in the Materials and Methods section. For GLP-1, an ELISA was conducted using a BF fraction including butanol, ethyl acetate, dichloromethane, and hexane. The HFBF activated GLP-1 secretion at higher levels compared to the other extracts (data not shown). As shown in Figure 2(a), GLP-1 secretion was significantly increased in a dose dependent manner compared to the control; DMSO was used as a negative control and 2 mM Quinine was used as a positive control. 1% DMSO was used as a negative control because the entire compound dissolved in it. The HFBF increased GLP-1 secretion by almost 25-fold compared to the negative control. Figure 2(b) shows HFBF has no cytotoxicity to the NCI-H716 cells.
Figure 2.
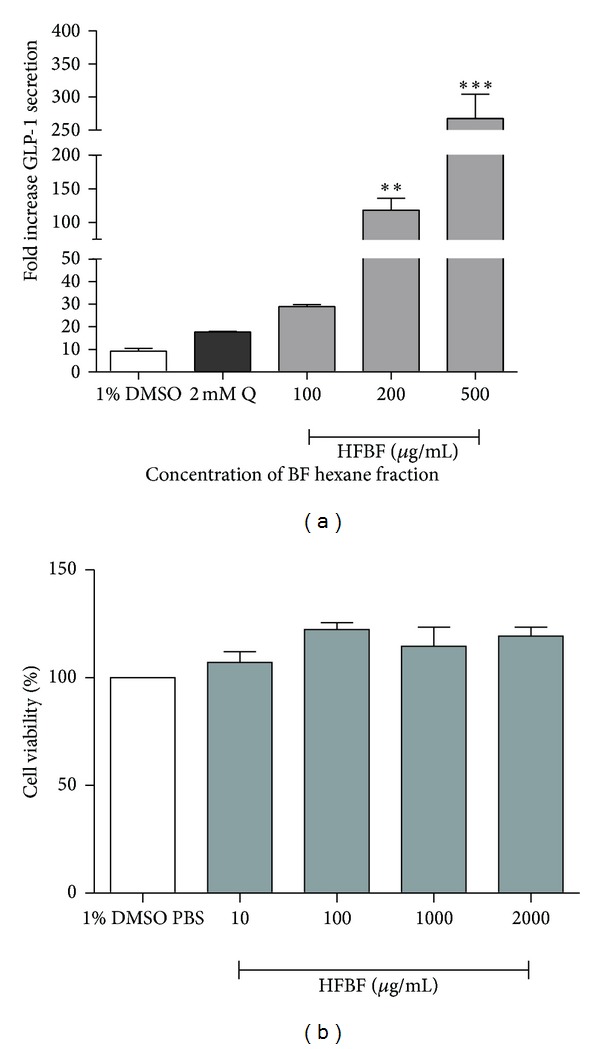
HFBF induced the secretion of GLP-1 in enteroendocrine cells without cell damage. BF extracted was fractionated with n-hexane (HX). (a) HFBF was treated with 100, 200, and 500 μg/mL each to the differentiated NCI-H716 cells. GLP-1 secretion was compared with the negative control and positive control. 1% DMSO used as negative control and 2 mM Quinine (Q) used as positive control. Experiments were conducted in triplicate and normalized with protein contents. (b) The effect of HFBF on the cell viability was measured by MTT test. All concentrations of HFBF had no toxicity to the NCI-H716 cell. Statistical significance was determined by a one-way ANOVA and the values are means ± SEM; *P < 0.05, **P < 0.001, ***P < 0.0005.
3.3. Hexane Fraction of Bupleurum falcatum L. Induces GLP-1 Secretion through GPCR Pathways
Microarray data demonstrated the HFBF activates GLP-1 secretion through GPCR signaling pathways in NCI-H716 cells. GPCR stimulates G protein that is composed of α, β, and γ subunits. Gα and Gβγ act independently through different signaling pathways. As shown in Table 1, the ADCY1 gene that encodes AC is downregulated and PDE-related genes including PDE8B, PDE8A, PDE7B, PDE4D, PDE4D, PDE4D, PDE4C, PDE4B, PDE4A, and PDE2A are also downregulated. The ITPR2 that encodes the inositol 1,4,5-trisphosphate receptor is upregulated (Table 1). To verify the activated pathway of the HFBF, an inhibition study was conducted. Lactisole, which is known as an inhibitor of sweet and umami taste receptors, was also used as an inhibitor of the Gα pathway [14]. There is no significant result in the inhibition study of GLP-1 secretion using lactisole (Figure 3). The HFBF seems to activate GLP-1 secretion through the Gβγ-mediated pathway particularly with the activation of PLC. The upregulation of the ITPR2 gene and downregulation of PDE and AC demonstrate that the HFBF stimulates GLP-1 secretion through the Gβγ-mediated pathway [8, 15].
Table 1.
List of genes related to the GPCR signaling pathway which is regulated after HFBF treatment.
| Probe name | Description | Gene symbol | P value | Fold change |
|---|---|---|---|---|
| Inositol 1,4,5-trisphosphate | ||||
| A_33_P3298128 | Inositol 1,4,5-trisphosphate receptor, type 2 (ITPR2), mRNA [NM_002223] | ITPR2 | 0.004 | 1.66 |
|
| ||||
| Adenylate cyclase | ||||
| A_23_P126313 | Adenylate cyclase 10 (soluble) (ADCY10), transcript variant 1, mRNA [NM_018417] | ADCY1 | 0.262 | −0.30 |
|
| ||||
| Phosphodiesterase | ||||
| A_24_P197537 | Phosphodiesterase 8B (PDE8B), transcript variant 1, mRNA [NM_003719] | PDE8B | 0.7777 | −0.04 |
| A_33_P3244951 | Phosphodiesterase 8A (PDE8A), transcript variant 1, mRNA [NM_002605] | PDE8A | 0.397 | −0.14 |
| A_33_P3301940 | Phosphodiesterase 7B (PDE7B), mRNA [NM_018945] | PDE7B | 0.238 | −0.22 |
| A_33_P3240552 | Phosphodiesterase 4D, cAMP-specific [Source: HGNC Symbol; Acc: 8783] [ENST00000509355] | PDE4D | 0.474 | −0.08 |
| A_33_P3389649 | Phosphodiesterase 4D, cAMP-specific (PDE4D), transcript variant 4, mRNA [NM_001197218] | PDE4D | 0.167 | −0.23 |
| A_33_P3389653 | Phosphodiesterase 4D, cAMP-specific (PDE4D), transcript variant 3, mRNA [NM_001165899] | PDE4D | 0.289 | −0.15 |
| A_33_P3759611 | Phosphodiesterase 4C, cAMP-specific (PDE4C), transcript variant 1, mRNA [NM_000923] | PDE4C | 0.110 | −0.32 |
| A_23_P74278 | Phosphodiesterase 4B, cAMP-specific (PDE4B), transcript variant d, mRNA [NM_001037341] | PDE4B | 0.039 | −0.20 |
| A_24_P322474 | Phosphodiesterase 4A, cAMP-specific (PDE4A), transcript variant 4, mRNA [NM_006202] | PDE4A | 0.336 | −0.23 |
| A_23_P401106 | Phosphodiesterase 2A, cGMP-stimulated (PDE2A), transcript variant 1, mRNA [NM_002599] | PDE2A | 0.511 | −0.06 |
Figure 3.
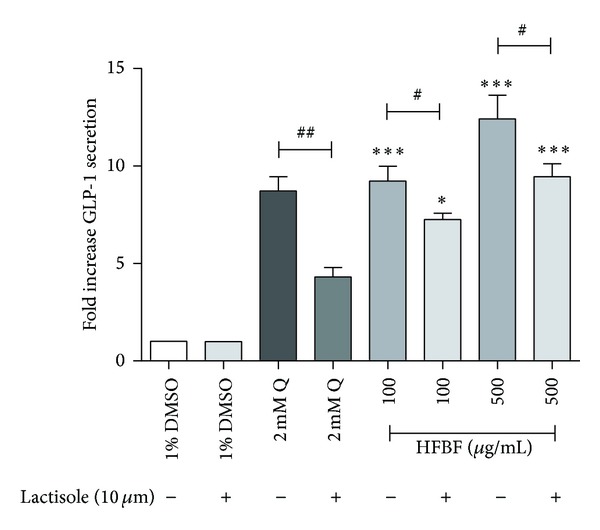
Inhibition study of GLP-1 secretion using lactisole. To test the inhibitory effect of the lactisole, lactisole was treated to the NCI-H716 cells. The BF hexane fraction (HFBF) was treated with 100, 200, and 500 μg/mL each to the differentiated NCI-H716 cells. GLP-1 secretion was compared with the negative control and positive control. 1% DMSO used as negative control and 2 mM Quinine (Q) used as positive control. Statistical significance was determined by a one-way ANOVA and the values are means ± SEM; *P < 0.05 and ***P < 0.0001 versus 1% DMSO. # P < 0.05 and ## P < 0.001 lactisole and HFBF treated group versus only HFBF treated group.
3.4. HFBF Induced Downregulation of Potassium Voltage-Gated Channels
The cell creates electrical signal through several types of ion channels such as potassium voltage-gated channels that are important to create membrane depolarization [16, 17]. KCNC3, KCNA6, KCNQ2, KCNE1, KCNN1, and KCTD19 genes encode potassium voltage-gated channels and are downregulated by the HFBF (Table 2). The HFBF seems to induce GLP-1 secretion by changing membrane potential via the potassium voltage-gated channels. HFBF has effects on making cell depolarization and inhibiting the expression of potassium voltage-gated channels by the downregulation of KCNC3, KCNA6, KCNQ2, KCNE1, KCNN1,and KCTD19 genes. This change of membrane potential may cause the secretion of hormones in enteroendocrine cells [18].
Table 2.
Alteration of genes related to the potassium channel.
| Probe name | Description | Gene symbol | P-value | Fold change |
|---|---|---|---|---|
| A_33_P3338793 | Potassium voltage-gated channel, S+C38haw-related subfamily, member 3 (KCNC3), mRNA [NM_004977] | KCNC3 | 0.004 | −0.93 |
| A_33_P3415012 | Potassium voltage-gated channel, shaker-related subfamily, member 6 (KCNA6), mRNA [NM_002235] | KCNA6 | 0.004 | −0.59 |
| A_33_P3395823 | Potassium voltage-gated channel, KQT-like subfamily, member 2 (KCNQ2), transcript variant 5, mRNA [NM_172109] | KCNQ2 | 0.001 | −0.74 |
| A_23_P154855 | Potassium voltage-gated channel, Isk-related family, member 1 (KCNE1), transcript variant 2, mRNA [NM_000219] | KCNE1 | 0.014 | −0.72 |
| A_23_P119573 | Potassium intermediate/small conductance calcium-activated channel, subfamily N, member 1 (KCNN1), mRNA [NM_002248] | KCNN1 | 0.034 | −0.85 |
| A_33_P3255131 | Potassium channel tetramerisation domain containing 19 (KCTD19), mRNA [NM_001100915] | KCTD19 | 0.011 | −0.91 |
3.5. HFBF Induced GLP-1 Secretion through G βγ Pathway
Lactisole is used as an inhibitor of sweet taste receptors that are known as a Gα pathway [19]. We treated lactisole to the NCI-H716 cell to verify the signaling pathway of the HFBF. As shown in Figure 3, lactisole showed no effect on blocking GLP-1 secretion during the treatment of the HFBF. This means the HFBF activates GLP-1 secretion but not through the Gα pathway. Thus, we performed calcium imaging experiments using Gallein, 2APB, and U73122 as other Gβγ signaling pathway inhibitors [19, 20].
Intracellular Ca2+ is closely related to the GPCR signaling pathway [21]. Intracellular Ca2+ ion is produced naturally in the cell after the activation of GPCR. To confirm the signaling pathway of GLP-1 secretion, a Gβγ pathway inhibitor was treated. As shown in Figure 4(a), Gallein which is an inhibitor of the Gβγ subunit was treated to the NCI-H716 cell. Compared to the cells treated with only the HFBF, the Gallein-treated cells showed decreased intracellular calcium concentration. U73122, which is an inhibitor of PLCβ2 activity, and 2APB, which is an inhibitor of both IP3 receptors and TRP channel treated cells, showed decreased intracellular calcium release in a dose dependent manner (Figures 4(b) and 4(c)). All of these results indicate the effect the HFBF has on GLP-1 secretion via the G protein βγ pathway.
Figure 4.
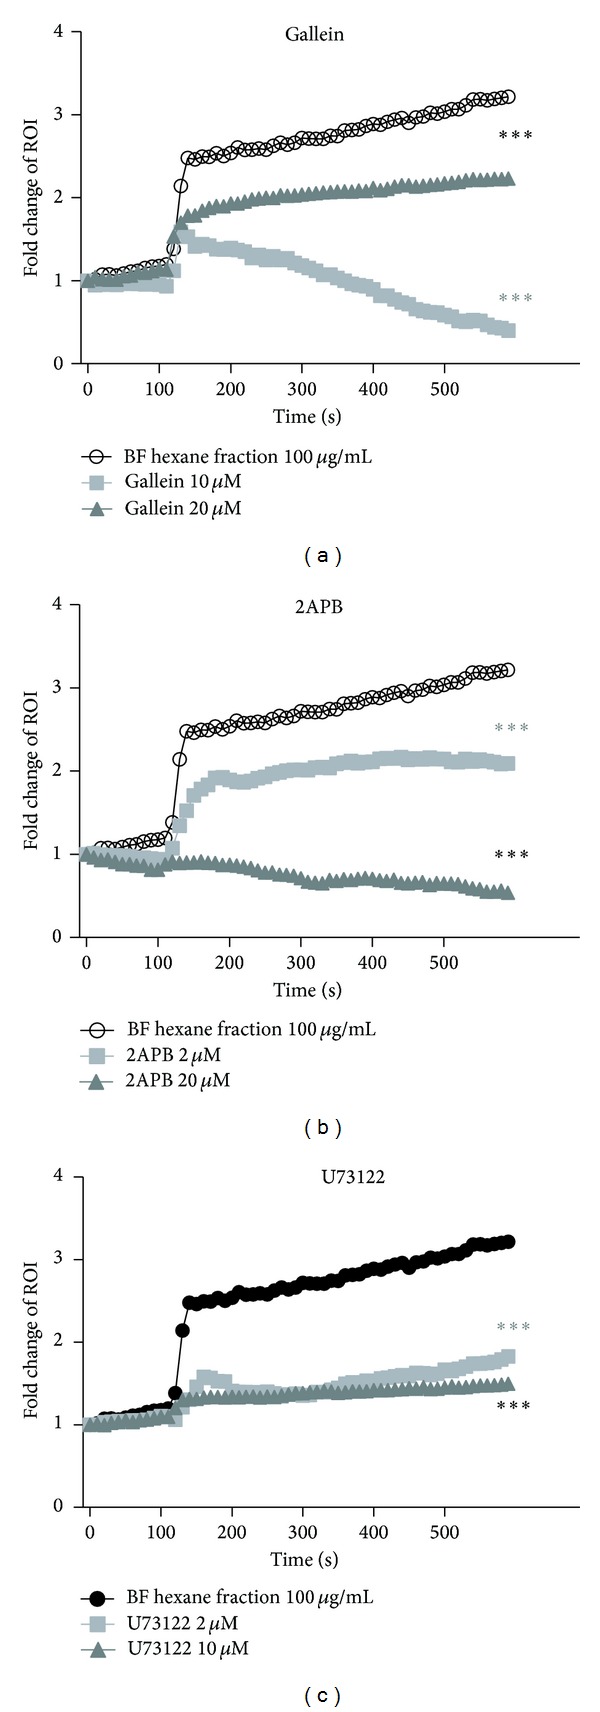
HFBF stimulates GLP-1 secretion through Gβγ pathway. Treatment of BF hexane fraction at 100 seconds into the medium increased the concentration of Ca2+ in cytosol. With BF hexane fraction, inhibitors were treated. (a) Gallein which is an inhibitor of Gβγ subunit-dependent signaling pathway reduced GLP-1 secretion dose dependently. (b) 2APB inhibits the IP3-induced Ca2+ release. 2APB also reduced GLP-1 secretion dose dependently. (c) U73122 is an inhibitor of PLC-dependent processes. With this inhibitor, concentration of Ca2+ showed less change despite treatment of BF hexane fraction. Data are means of intensity of the NCI-H716 cells (n = 10). ***P < 0.0001 versus BF hexane fraction 100 μg/mL.
3.6. Hexane Fraction of Bupleurum falcatum L. Decreases Blood Glucose Level in db/db Mouse
As shown in Figure 5, HFBF regulated the blood glucose level of db/db mouse. db/db mouse is a model of diabetes because it has no leptin receptor activity. It is point mutation in the gene for the leptin receptor. After glucose administration, blood glucose level increased time dependently before 20 min. However, HFBF administration group significantly shows the decreased glucose level compared to PBS-control group.
Figure 5.
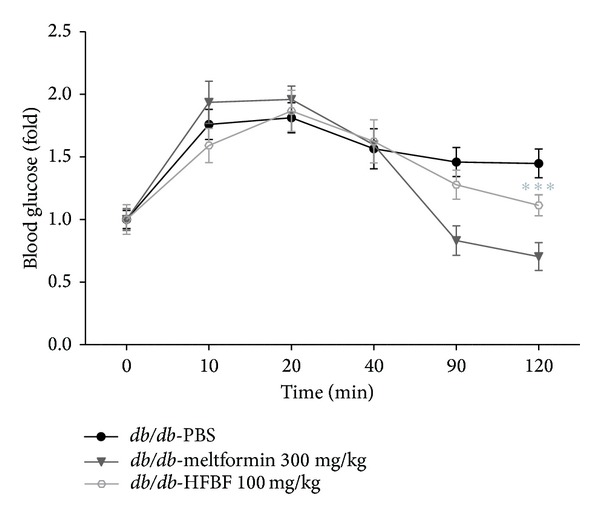
Oral glucose tolerance test of HFBF. To test regulatory effect of HFBF, HFBF treated orally to the db/db mouse. Metformin was used as a positive control. To compare with PBS-treated control group, 300 mg/kg of Metformin and 100 mg/kg of HFBF were orally treated just before the glucose administration. Mouse blood sample was collected from tail vein at 0 (before the HFBF treatment) and after 10, 20, 40, 90, and 120 minutes. Statistical significance was determined by student's t-test and the values are means ± SEM; ***P < 0.0001.
4. Discussion
This investigation suggests that HFBF stimulates GLP-1 secretion through the Gβγ-mediated pathway. Glucagon-like peptide-1 (GLP-1) is an incretin hormone which regulates insulin secretion, appetite, and gut motility [4]. Lately, new drugs that help to release GLP-1 secretion or block the degradation of GLP-1 are issued because GLP-1 regulates the secretion of insulin in pancreatic β-cells. The major source of GLP-1 is the intestinal L cell that secretes GLP-1 as a gut hormone. In this investigation, HFBF shows the antidiabetic effect in cellular level by secreting GLP-1 secretion. HFBF was treated to NCI-H716 cells with three concentrations: 100, 200, and 500 μg/mL. GLP-1 secretion was increased dose dependently. All concentrations of HFBF increased GLP-1 secretion and had significance. We supposed that the HFBF increases the GLP-1 secretion through sweet taste or bitter taste receptor signal pathway in enteroendocrine NCI-H716 cells. To verify this hypothesis. Lactisole was used as an inhibitor of sweet taste receptor, exactly, human T1R3. Sweet taste receptor is the heterodimer consisting of T1R2 and T1R3. After treatment of HFBF with lactisole, there is no significant effect comparing to the only HFBF treatment (Figure 3). G protein-coupled receptor is also composed of Gβγ subunit that is related to phospholipase C β2 (PLC β2), diacyl glycerol (DAG), and inositol 1, 4, 5-triphosphate (IP3) and increases intracellular calcium. Gallein, 2APB, and U73122 are inhibitors of Gβγ pathways [19, 20]. They inhibit Gβγ subunit, PLC β2, and IP3 receptor. The activated Gβγ activates PLC β2 and then divides PIP2 into DAG and IP3. DAG regulates protein kinase C (PKC) and triggers phosphorylation of PKC. IP3 is recruited to IP3 receptor in ER membrane and, as a result, releases calcium flow into cytoplasm. In Figure 4, Gallein decreased intracellular calcium concentration. U73122 and 2APB also showed decreased intracellular calcium release in a dose dependent manner. To verify the signaling pathway of GLP-1 secretion through the HFBF treatment, we performed microarray analyses. Microarray data show the HFBF activated GLP-1 secretion through the GPCR signaling pathway. HFBF and then following membrane depolarization. The data from the inhibition studies showed the HFBF activates the GPCR signaling pathway, especially the Gβγ-mediated pathway, for the release of GLP-1. GLP-1 is one of target molecules for the treatment of Type 2 diabetes mellitus because it activates the GLP-1 receptor on the cell and then mediates insulin secretion. HFBF also showed regulatory effect of blood glucose level in db/db mouse OGTT experiments. This investigation suggests that HFBF stimulates GLP-1 secretion through Gβγ-mediated signaling pathway. The overall conclusion from the results is that the HFBF could be used as a possible medication for Type 2 diabetes mellitus patients via activation of Gβγ-mediated pathway.
Acknowledgment
This research was supported by Basic Science Research Program through the National Research Foundation of Korea (NRF) funded by the Ministry of Education, Science and Technology (NRF-2013R1A1A2004960).
Conflict of Interests
The authors declare that there is no conflict of interests regarding the publication of this paper.
Authors' Contribution
Min-Hee Shin and Eun-Kyeong Choi contributed equally to this work.
References
- 1.Sakurai MH, Matsumoto T, Kiyohara H, Yamada H. B-cell proliferation activity of pectic polysaccharide from a medicinal herb, the roots of Bupleurum falcatum L. and its structural requirement. Immunology. 1999;97(3):540–547. doi: 10.1046/j.1365-2567.1999.00774.x. [DOI] [PMC free article] [PubMed] [Google Scholar]
- 2.Kim K-S, Lee J-Y, Lee S-Y, et al. Comparative transcriptomic analysis of the multi-targeted effects of the herbal extracts against Escherichia coli O157:H7. Biochip Journal. 2012;6(4):379–390. [Google Scholar]
- 3.Dascal N. Signalling via the G protein-activated K+ channels. Cellular Signalling. 1997;9(8):551–573. doi: 10.1016/s0898-6568(97)00095-8. [DOI] [PubMed] [Google Scholar]
- 4.Jang HJ, Kokrashvili Z, Theodorakis MJ, et al. Gut-expressed gustducin and taste receptors regulate secretion of glucagon-like peptide-1. Proceedings of the National Academy of Sciences of the United States of America. 2007;104(38):15069–15074. doi: 10.1073/pnas.0706890104. [DOI] [PMC free article] [PubMed] [Google Scholar]
- 5.Reimer RA, Darimont C, Gremlich S, Nicolas-Métral V, Rüegg UT, Macé K. A human cellular model for studying the regulation of glucagon-like peptide-1 secretion. Endocrinology. 2001;142(10):4522–4528. doi: 10.1210/endo.142.10.8415. [DOI] [PubMed] [Google Scholar]
- 6.Le Nevé B, Daniel H. Selected tetrapeptides lead to a GLP-1 release from the human enteroendocrine cell line NCI-H716. Regulatory Peptides. 2011;167(1):14–20. doi: 10.1016/j.regpep.2010.10.010. [DOI] [PubMed] [Google Scholar]
- 7.Choi E-K, Kim K-S, Yang HJ, et al. Hexane fraction of Citrus aurantium L. stimulates glucagon-like peptide-1 (GLP-1) secretion via membrane depolarization in NCI-H716 cells. Biochip Journal. 2012;6(1):41–47. [Google Scholar]
- 8.Shin M-H, Suh H-W, Lee K-B, et al. Gentiana scabra extracts stimulate glucagon-like peptide-1 secretion via G protein-coupled receptor pathway. Biochip Journal. 2012;6(2):114–119. [Google Scholar]
- 9.Kim K-S, Yang HJ, Choi E-K, et al. The effects of complex herbal medicine composed of Cornus fructus, Dioscoreae rhizoma, Aurantii fructus, and Mori folium in obese type-2 diabetes mice model. Orient Pharm Exp Med. 2013;13(1):69–75. [Google Scholar]
- 10.Kim K-S, Cha NH, Kim K-W, et al. Transcriptomic analysis of the bitter taste receptor-mediated glucagon-like peptide-1 stimulation effect of quinine . Biochip Journal. 2013;74:386–392. [Google Scholar]
- 11.Kim H, Kim KS, Shin MH, et al. Aqueous extracts of Anemarrhena asphodeloides stimulate glucagon-like pepetide-1 secretion in enteroendocrine NCI-H716 cells. Biochip Journal. 2013;7(2):188–193. [Google Scholar]
- 12.Parks RJ, Howlett SE. H-89 decreases the gain of excitation-contraction coupling and attenuates calcium sparks in the absence of beta-adrenergic stimulation. European Journal of Pharmacology. 2012;691(1–3):163–172. doi: 10.1016/j.ejphar.2012.07.012. [DOI] [PubMed] [Google Scholar]
- 13.Baggio LL, Drucker DJ. Biology of incretins: GLP-1 and GIP. Gastroenterology. 2007;132(6):2131–2157. doi: 10.1053/j.gastro.2007.03.054. [DOI] [PubMed] [Google Scholar]
- 14.Kuhn C, Bufe B, Winnig M, et al. Bitter taste receptors for saccharin and acesulfame K. The Journal of Neuroscience. 2004;24(45):10260–10265. doi: 10.1523/JNEUROSCI.1225-04.2004. [DOI] [PMC free article] [PubMed] [Google Scholar]
- 15.Mizuta K, Mizuta F, Xu D, Masaki E, Panettieri RA, Jr., Emala CW. Gi-coupled γ-aminobutyric acid-B receptors cross-regulate phospholipase C and calcium in airway smooth muscle. The American Journal of Respiratory Cell and Molecular Biology. 2011;45(6):1232–1238. doi: 10.1165/rcmb.2011-0088OC. [DOI] [PMC free article] [PubMed] [Google Scholar]
- 16.Kim SJ, Widenmaier SB, Choi WS, et al. Pancreatic [beta]-cell prosurvival effects of the incretin hormones involve post-translational modification of Kv2.1 delayed rectifier channels. Cell Death and Differentiation. 2012;19(2):333–344. doi: 10.1038/cdd.2011.102. [DOI] [PMC free article] [PubMed] [Google Scholar]
- 17.Martin SC, Yule DI, Dunne MJ, Gallacher DV, Petersen OH. Vasopressin directly closes ATP-sensitive potassium channels evoking membrane depolarization and an increase in the free intracellular Ca2+ concentration in insulin-secreting cells. EMBO Journal. 1989;8(12):3595–3599. doi: 10.1002/j.1460-2075.1989.tb08532.x. [DOI] [PMC free article] [PubMed] [Google Scholar]
- 18.Flatt PR, Barnett CR, Shibier O, Swanston-Flatt SK. Direct and indirect actions of nutrients in the regulation of insulin secretion from the pancreatic beta cells. Proceedings of the Nutrition Society. 1991;50(3):559–566. doi: 10.1079/pns19910069. [DOI] [PubMed] [Google Scholar]
- 19.Jin W, Lo T-M, Loh HH, Thayer SA. U73122 inhibits phospholipase C-dependent calcium mobilization in neuronal cells. Brain Research. 1994;642(1-2):237–243. doi: 10.1016/0006-8993(94)90927-x. [DOI] [PubMed] [Google Scholar]
- 20.Deshpande DA, Wang WCH, McIlmoyle EL, et al. Bitter taste receptors on airway smooth muscle bronchodilate by localized calcium signaling and reverse obstruction. Nature Medicine. 2010;16(11):1299–1304. doi: 10.1038/nm.2237. [DOI] [PMC free article] [PubMed] [Google Scholar]
- 21.Emkey R, Rankl NB. Screening G protein-coupled receptors: measurement of intracellular calcium using the fluorometric imaging plate reader. Methods in Molecular Biology. 2009;565:145–158. doi: 10.1007/978-1-60327-258-2_7. [DOI] [PubMed] [Google Scholar]


