

Abstract
Background and purpose
Decisions on life-sustaining treatments and the use of do-not-resuscitate (DNR) orders can affect early mortality after stroke. We investigated the variation in early DNR utilization after stroke among hospitals in California, and the impact of this variation on mortality-based hospital classifications.
Methods
Using the California State Inpatient Database from 2005–2011, ischemic stroke admissions for patients age ≥50 were identified. Cases were categorized by the presence/absence of DNR orders within the first 24 hours of admission. Multilevel logistic regression models with a random hospital intercept were used to predict inpatient mortality after adjusting for comorbidities, vascular risk factors and demographics. Hospital mortality rank order was assigned based on this model and compared to the results of a second model that included DNR status.
Results
From 355 hospitals, 252,368 cases were identified, including 33,672 (13.3%) with early DNR. Hospital-level adjusted utilization of DNR varied widely (quintile 1, 2.2% vs. quintile 5, 23.2%). Hospitals with higher early DNR utilization had higher inpatient mortality, as inpatient mortality more than doubled from quintile 1 (4.2%) to quintile 5 (8.7%). Failure to adjust for DNR orders resulted in substantial hospital reclassification across the rank spectrum, including among high mortality hospitals.
Conclusions
There is wide variation in the hospital-level proportion of ischemic stroke patients with early DNR orders; this variation affects hospital mortality estimates. Unless the circumstances of early DNR orders are better understood, mortality-based hospital comparisons may not reliably identify hospitals providing a lower quality of care.
Key words for indexing: stroke, outcomes research, mortality, do-not-resuscitate orders
Introduction
Early mortality after ischemic stroke is currently used as a publicly reported measure of hospital-based quality of care by some reporting systems,1 and a 30-day risk-adjusted mortality model for stroke is under development by the Center for Medicare and Medicaid Services (CMS). The justification behind the CMS model and others is that higher mortality is indicative of lower quality of care. This rationale may fail to adequately account for variation in patient preferences as most early deaths after ischemic stroke are related to patient or family preferences to withhold or withdraw potential life-sustaining interventions, such as artificial hydration and nutrition or mechanical ventilation.2, 3
Do not resuscitate (DNR) orders placed early in an ischemic stroke hospitalization are associated with a higher risk of mortality after stroke.4, 5 Early DNR orders could be reflective of excessive physician pessimism regarding possible outcomes after severe stroke, and in this setting the quality of care may in fact be suboptimal. In contrast, early DNR orders (and other limitations on intensity of treatment) could also be indicative of pre-existing patient or family preferences for limitations of life sustaining treatment or for prioritizing comfort over length of life when facing possibility disability. In this scenario, use of DNR orders and other limitations in life sustaining treatment would reflect appropriate matching of treatment plan to patient goals and would be considered high quality, patient-centered care. Since the exact circumstances in which DNR orders are utilized in individual stroke patients are not available in the administrative datasets used for hospital mortality measures (such as the proposed CMS measure), it is unclear whether an important predictor of early stroke mortality (DNR order utilization) is associated with higher or lower quality of care.
In this study, we investigated the variation in early DNR utilization at the hospital level and the extent to which a proposed metric of hospital quality (inpatient stroke mortality) is affected by accounting for differences in early DNR utilization.
Methods
We performed a study of all inpatient discharges for the state of California from 2005–2011 from the State Inpatient Database (SID) Healthcare Cost and Utilization Project (HCUP), Agency for Healthcare Research and Quality. SID captures all inpatient discharges within a given year. California was selected for this analysis because of its large population, large number of hospitals, and reporting of whether early DNR orders (within the first 24 hours of admission) were present.
Inclusion and exclusion criteria
Hospital visits were included in this study if patients were 50 years of age or older and the primary discharge diagnosis was an ischemic stroke diagnosis (ICD-9-CM 433.x1, 434.x1, 436). This algorithm has a positive predictive value of 88% and sensitivity of 74% for identifying ischemic stroke.6, 7 Hospitals were excluded if they had an average DNR proportion greater than 50% and an in-hospital case fatality greater than 80%, as these facilities were inferred to be hospices (5 facilities, 212 total discharges). We also excluded low-volume facilities with less than 10 total ischemic stroke hospitalizations during the study period (16 facilities, 49 total discharges).
Primary outcome and covariate definitions
The primary outcome was whether a patient died during their hospitalization. The primary exposure variable was whether an order to limit resuscitation efforts was written within the first 24 hours of admission (early DNR).8, 9 The database does not differentiate between DNR orders which are newly placed during the hospitalization and those in place at the time of admission, and therefore both of these scenarios would be coded as “early DNR.” A small number of individuals were excluded (0.02% of the sample) because no data was recorded on whether an early DNR order was present. Comorbidities were determined using the components of the modified Charlson definition and life-sustaining treatments based on standardized definitions.10, 11 Vascular risk factors were defined using the HCUP single-level clinical classification system (CCS).12 Whether a patient had a prior ischemic stroke, intracerebral hemorrhage (ICD-9-CM 431.xx), or transient ischemic attack (435.xx) at any time during the study period was determined by linking visit-level data using HCUP revisit variables.13
Statistical analysis
Descriptive statistics were presented to characterize the population of visits, both overall and by early DNR status. Formal unadjusted statistical comparisons by DNR status were not presented due to the large sample size and high likelihood of statistically significant but clinically unimportant differences. For each hospital, the mean proportion of ischemic stroke visits with an early DNR order was calculated and summarized at the hospital level by quintiles. To determine whether this variation was due to variation in patient characteristics, we built a multi-level logistic regression model with early DNR status as the independent variable and patient demographics, vascular risk factors, all Charlson comorbidities and prior cerebrovascular events as dependent variables and a random hospital-level intercept. The proportion of variance accounted for at the hospital level was calculated using the inter-class correlation coefficient (ICC).
Mortality modeling and hospital classification
Our mortality model was designed to generally reflect CMS mortality models, however two main differences in the datasets necessitated some modification. First, our dataset includes all stroke admissions and is not limited to the Medicare fee-for-service population; consequently, we adjusted for insurance status. Second, our dataset only includes hospitalization data and does not include outpatient data or data on whether a patient was consistently in California. To account for the fact that some of the risk adjustors included in the CMS models may be less reliably measured in the context of a single hospital claim, we adjusted for comorbidities by including all individual level Charlson comorbidities11 which are reliably measured in hospital discharge data, following the approach of Lichtman et al.14
Our baseline mortality model used multilevel logistic regression to predict the primary outcome (inpatient mortality) while including patient-level risk adjustors (age, sex, race, primary insurance, all individual level Charlson comorbidities, vascular risk factors, prior cerebrovascular events) whether a patient was transferred in and a random hospital-level intercept (non-DNR model). The random hospital intercept can be interpreted as the effect of an individual hospital on mortality, independently of all other risk adjustors. To determine how hospital effects change when accounting for DNR status, we repeated our baseline model by including an indicator variable for early DNR order at the patient level (DNR model). Hospital intercepts were then ranked on both models and compared using descriptive statistics. To identify the highest and lowest performing hospitals, we identified “Above Average”, “Average” and “Below Average” hospitals through both models using various cut points, specifically the highest and lowest performing 2.5%, 5%, and 10% of hospitals in each model. We then determined the degree to which hospital classification changed between the two models. While this approach is conceptually similar, it is not exactly the same as the CMS approach for other disease processes (which compares the 95% confidence interval for hospital mortality to an average value); we opted for this approach to better understand the degree of hospital reclassification as not all approaches to hospital classification rely on the CMS cutpoints.1, 15
Results
Between 2005 and 2011, we identified a total of 252,368 admissions for ischemic stroke at 355 hospitals. Overall in-hospital case fatality was 5.9 %. A total of 13.3% of patients admitted to California hospitals had a DNR order placed within the first 24 hours of hospital admission. The proportion of hospitalizations with early DNR orders was generally similar over time, from 13.5% in 2005 to 13.1% in 2011.
Patients with early DNR orders generally tended to be older, more likely to be white, and more likely to be female when compared to patients without early DNR orders (Table 1). Co-morbid medical conditions that might affect early mortality also tended to be more common among patients with early DNR orders, including a history of myocardial infarction, congestive heart failure, dementia, chronic obstructive pulmonary disease, kidney disease, and cancer (including metastatic disease).
Table 1.
Description of study population. For categorical variables each cell reports the number of patients in each group and the percentage of the total within that column. For continuous variables, each cell reports the mean value, with the standard deviation in parentheses.
| No DNR (n = 218,696) |
DNR (n = 33,672) |
Total (n = 252,368) |
|
|---|---|---|---|
| Demographics | |||
| Age | 73.0 (11.5) | 82.6 ( 8.9) | 74.3 (11.7) |
| Female | 112,469 (51.4%) | 22,261 (66.1%) | 134,730 (53.4%) |
| Race | |||
| White | 123,808 (56.6%) | 25,970 (77.1%) | 149,778 (59.3%) |
| Black | 20,959 (9.6%) | 1,334 (4.0%) | 22,293 (8.8%) |
| Hispanic | 39,806 (18.2%) | 3,261 (9.7%) | 43,067 (17.1%) |
| Asian | 20,878 (9.5%) | 1,752 (5.2%) | 22,630 (9.0%) |
| Other | 13,245 (6.1%) | 1,355 (4.0%) | 14,600 (5.8%) |
| Insurance | |||
| Medicare | 147,220 (67.3%) | 29,780 (88.4%) | 177,000 (70.1%) |
| Medicaid | 21,023 (9.6%) | 950 (2.8%) | 21,973 (8.7%) |
| Private Insurance | 37,349 (17.1%) | 2,463 (7.3%) | 39,812 (15.8%) |
| Other | 13,104 (6.0%) | 479 (1.4%) | 13,583 (5.4%) |
| LOS | 5.4 (7.3) | 5.2 (6.4) | 5.3 (7.1) |
| Transfer | 10,042 (4.6%) | 1,608 (4.8%) | 11,650 (4.6%) |
| Inpatient Mortality | 8,515 (3.9%) | 6,458 (19.2%) | 14,973 (5.9%) |
| Vascular Risk Factors | |||
| Hypertension | 182,284 (83.4%) | 26,890 (79.9%) | 209,174 (82.9%) |
| Hyperlipidemia | 106,611 (48.7%) | 13,048 (38.8%) | 119,659 (47.4%) |
| Diabetes | 83,282 (38.1%) | 9,847 (29.2%) | 93,129 (36.9%) |
| Atrial Fibrillation | 50,175 (22.9%) | 13,972 (41.5%) | 64,147 (25.4%) |
| Comorbidities | |||
| MI | 19,315 (8.8%) | 4,230 (12.6%) | 23,545 (9.3%) |
| PVD | 19,182 (8.8%) | 3,808 (11.3%) | 22,990 (9.1%) |
| CHF | 32,629 (14.9%) | 8,492 (25.2%) | 41,121 (16.3%) |
| Dementia | 11,699 (5.3%) | 4,486 (13.3%) | 16,185 (6.4%) |
| COPD | 33,059 (15.1%) | 6,365 (18.9%) | 39,424 (15.6%) |
| Renal Disease | 29,379 (13.4%) | 5,889 (17.5%) | 35,268 (14.0%) |
| Prior Stroke | 27,912 (12.8%) | 4,914 (14.6%) | 32,826 (13.0%) |
| Prior TIA | 7,311 (3.3%) | 1,312 (3.9%) | 8,623 (3.4%) |
| Prior ICH | 6,843 (3.1%) | 899 (2.7%) | 7,742 (3.1%) |
| Procedures | |||
| PEG | 10,223 (4.7%) | 1,780 (5.3%) | 12,003 (4.8%) |
| Tracheostomy | 1,297 (0.6%) | 81 (0.2%) | 1,378 (0.5%) |
| Intubation | 8,449 (3.9%) | 1,779 (5.3%) | 10,228 (4.1%) |
| Dialysis | 4,238 (1.9%) | 521 (1.5%) | 4,759 (1.9%) |
DNR=do not resuscitate, LOS=length of stay in days, MI=myocardial infarction, PVD=peripheral vascular disease, CHF=congestive heart failure, COPD=chronic obstructive pulmonary disease, TIA=transient ischemic attack, ICH=intracerebral hemorrhage, PEG=percutaneous endoscopic gastrostomy.
Inpatient mortality was higher in patients with early DNR orders (19.2% vs. 3.9%, p < 0.001). Utilization of certain life-sustaining interventions, including gastrostomy tube placement and intubation, were seen more commonly in the early DNR population.
Variation in the use of DNR orders and association with inpatient mortality
Substantial inter-hospital variability was seen in the utilization of early DNR orders (Figure 1). In an unadjusted analysis, utilization ranged from 2.1% of hospitalizations (quintile 1) to 32.0% of hospitalizations (quintile 5). After adjusting for patient-level factors, variation was somewhat more constrained, ranging from 2.2% (quintile 1) to 23.2% (quintile 5). The intra-class correlations were 0.26 (unadjusted) and 0.24 (adjusted), meaning that between 24% and 26% of the variance seen in early DNR utilization was explained at the hospital level. Hospitals with higher early DNR utilization had higher unadjusted inpatient mortality than hospitals with lower early DNR utilization, as mortality more than doubled from quintile 1 (4.2%) to quintile 5 (8.7%).
Figure 1.
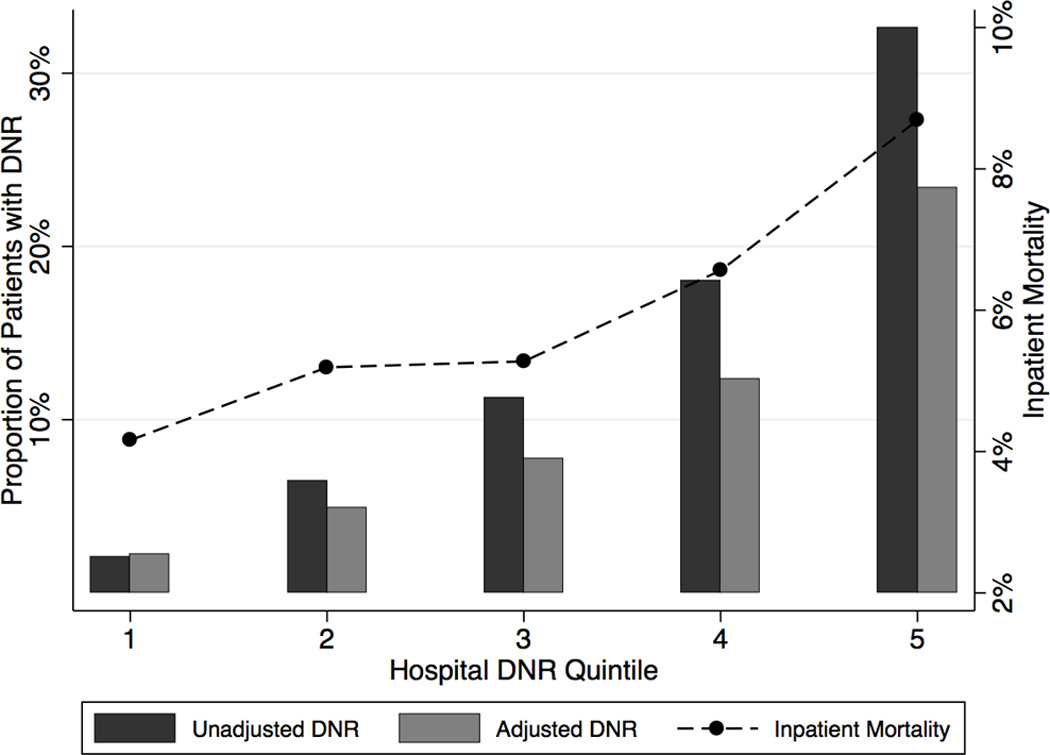
Variation in use of DNR orders and associated inpatient mortality. Darker bars represent the unadjusted proportion of patients with a DNR order across hospital DNR quintiles; lighter bars represent the proportion after adjusting for demographics, vascular risk factors, comorbidities, prior vascular events and transfer status relative to the leftmost y-axis. The dashed line represents mean unadjusted inpatient mortality across quintiles relative to the rightmost y-axis.
Effect of DNR orders on mortality estimates and hospital rankings
In the DNR model, DNR status was a strong predictor of mortality, with an odds ratio of 4.71 (95% CI 4.51–4.90). As a consequence, the DNR model tended to have a lower estimate of adjusted hospital mortality when compared to the baseline non-DNR model. Relative decreases of 10% or more were observed in 190 hospitals, by 20% or more in 37 hospitals, and by 30% or more in 7 hospitals (maximum relative change −42%, maximum absolute change −1.9%). The DNR model resulted in relative increases in mortality estimates of 10% or more in 84 hospitals, by 20% or more in 32 hospitals, and by 30% or more in 3 hospitals (maximum relative change +43%, maximum absolute change +2.5%).
Across the rank spectrum, hospital rank varied between the two predictive models (Figure 2). Using a classification scheme that identifies high-performing and low-performing hospitals by their presence in the highest or lowest 2.5% of hospital mortality, the DNR model would result in reclassification of 6/355 hospitals (1.7%) compared to classification on the baseline, non-DNR model. Classification schemes that identified the highest and lowest 5% or 10% of hospitals would result in reclassification of 18/356 (5.0%) and 56/356 (15.8%) of hospitals on the DNR-model compared to the non-DNR model, respectively (Table 2). Focusing on the subset of hospitals categorized as “below average” using the non-DNR model, 22% (2/9) would be reclassified using the 2.5% threshold, 28% (5/18) would be reclassified using the 5% threshold, and 36% (13/36) using the 10% threshold in the DNR model.
Figure 2.

Comparison of hospital ranking with and without adjustment for DNR status. Each dot represents an individual hospital. The y-axis represents the hospital’s ranking assigned from the non-DNR model and the x-axis represents the hospital’s ranking on the model including DNR.
Table 2.
Summary of hospital reclassification using various thresholds for identifying high and low-performing hospitals.
| DNR Model | |||||
|---|---|---|---|---|---|
| Below Average |
Average | Above Average |
Total | ||
| Cut point 2.5%/95%/2.5% | |||||
| Non-DNR Model | Below Average | 7 | 2 | 0 | 9 |
| Average | 2 | 335 | 1 | 338 | |
| Above Average | 0 | 1 | 7 | 8 | |
| Total | 9 | 338 | 8 | 355 | |
| Cut point 5%/90%/5% | |||||
| Non-DNR Model | Below Average | 13 | 5 | 0 | 18 |
| Average | 5 | 311 | 4 | 320 | |
| Above Average | 0 | 4 | 13 | 17 | |
| Total | 18 | 320 | 17 | 355 | |
| Cut point 10%/80%/10% | |||||
| Non-DNR Model | Below Average | 23 | 13 | 0 | 36 |
| Average | 13 | 256 | 15 | 284 | |
| Above Average | 0 | 15 | 20 | 35 | |
| Total | 36 | 284 | 35 | 355 | |
Discussion
Failure to account for DNR status can lead to considerable differences in estimates of adjusted inpatient mortality in ischemic stroke. Our data suggest that the difference in these estimates will impact hospital classification in public reporting systems that are based on adjusted mortality. The degree of reclassification is not trivial as we found that approximately 20–40% of hospitals classified as “low performing” in the baseline-non-DNR model were re-classified as average once DNR orders were taken into account. A major goal of public reporting is to identify lower performing hospitals so that improvement efforts can be undertaken; given the association we found between early DNR status and mortality, unless one assumes that DNR status is a marker of low quality care, the system may not be accomplishing this objective.
More broadly, our findings further call into question whether adjusted hospital-level ischemic stroke mortality is a valid measure of quality of care and the widespread use of publicly reporting hospital performance until the factors that drive stroke mortality are better understood. Stroke may be different from other conditions for which CMS publicly reports mortality (e.g., congestive heart failure) in several important ways. First, stroke is responsible for a large burden of disability,16 and many stroke patients and their families opt against high-intensity care focused on improving survival when facing survival with severe disability and delayed death.17, 18 These differences imply that early mortality after stroke is not always the worst outcome from a patient perspective and that hospital responses to public reporting could potentially disincentivize patient-centered, preference-sensitive care.
Second, high-quality evidence-based acute stroke care (e.g., early thrombolytic administration, use of statins) is more strongly linked to disability reduction or secondary prevention as opposed to mortality. This study and other data show that even small changes in the intensity of care following stroke may result in a substantial impact on mortality – as much as 40% of mortality was attributed to withdrawal of life-sustaining interventions in one study.3 Given that attempts to improve evidence-based process measures may have more modest effects on early stroke mortality than even small changes in use of life sustaining treatments, institutions may make conscious or unconscious efforts to increase the intensity of care provided to stroke patients, at the cost of patient-centeredness. Similar unintended consequences have been observed in other contexts when faced with problematic incentives.19, 20
Beyond the implications for national hospital comparisons and whether mortality (with or without accounting for DNR status) is a valid marker of quality of care, this study raises other issues. Among hospitals in California, there is wide variation in the proportion of hospitalized ischemic stroke patients with early DNR orders, consistent with other studies of DNR utilization. This difference in DNR use is associated with concomitant wide variation in inpatient stroke mortality, resulting in these questions: Is excess mortality occurring at high DNR utilizing, high mortality hospitals? Or alternatively, are limitations on intensity of care not being established frequently enough at low DNR utilizing, low mortality hospitals? Is it even possible to define “acceptable” and “unacceptable” levels of hospital-based mortality, without understanding patient preferences regarding DNR status and use of life-sustaining interventions?21 Future research is needed to develop a more detailed understanding of the patients that receive DNR orders and how DNR orders (and care limitations more broadly) are currently used in stroke care to begin addressing these questions. Additionally, more work is needed to understand why hospitals account for 25% of the variance in DNR orders, in order to determine if this is due to hospital-level processes or cultures, provider-specific factors, or local/regional variability in patient preferences for life-sustaining treatments.22
The use of DNR orders does not preclude high quality care or utilization of high intensity interventions following stroke.3, 23 A specific designation as care being palliative or “comfort only” was not available in our dataset, but given the number of DNR patients who underwent life-sustaining interventions (e.g., PEG placement), it does not appear that early DNR utilization in ischemic stroke should be considered a direct proxy for palliative care. In patients with intracerebral hemorrhage, most patients in whom life-sustaining measures were withdrawn also had early DNR orders; however, most DNR patients did not ultimately have life sustaining measures withdrawn or withheld.24 It is imperative that future work more thoroughly investigates the association between stroke mortality and decisions regarding the intensity of care after stroke, including DNR orders. Ideally, such work would clarify the circumstances regarding DNR status and life-sustaining measure utilization following stroke and determine whether patient preferences were incorporated into decision-making. Assessing the quality of decision-making25 may help explain practice variation in some disease processes (such as coronary artery disease), and given the association between early stroke mortality and life-sustaining intervention use, it may explain some variation in outcomes as well.
Our study has several limitations. Information on stroke severity was not available in this dataset, though this is also a key limitation in current stroke mortality measures under development.26 In this study, DNR orders are likely acting as proxies for stroke severity to some extent, since patients with severe stroke are more likely to have DNR orders. However, it is likely that the DNR effect observed here is, at least, in part independent of the effect of severity for two reasons. First, the magnitude of hospital reclassification when accounting for DNR utilization is greater than the magnitude of reclassification associated with accounting for stroke severity.26 Second, DNR utilization varies considerably more widely at the hospital level than does stroke severity.27 The models that we employed are an approximation of the model under development by CMS, so some differences in risk adjustment methodologies are possible. We also used inpatient mortality as opposed to a 30-day time horizon for mortality that will be utilized by CMS, since we did not have access to data beyond the incident hospitalization; it is unclear how these different timeframes would affect our results.
Summary/Conclusions
There is likely to be considerable hospital reclassification in publicly reported measures that judge hospital quality based on early stroke mortality without accounting for DNR orders. Given the variable potential meanings and implications of DNR orders, models that incorporate DNR orders without an assessment of concordance with patient preferences would also be limited in their ability to assess treatment quality. Therefore, use of stroke mortality as a hospital level quality measure should be reconsidered until the relationship of care limitations, quality of care and mortality is better understood.
Acknowledgments
Sources of funding:
Dr. Kelly: Donald W. Reynolds Foundation; Dr. Zahuranec: NIH grant K23 AG038731; Dr. Morgenstern: NIH grants R01 NS038916 and R01 NS062675; Dr. Burke: NIH grant K08 NS082597.
Footnotes
Conflicts/disclosures:
The authors report no conflicts of interest.
References
- 1.Kelly A, Thompson JP, Tuttle D, Benesch C, Holloway RG. Public reporting of quality data for stroke: Is it measuring quality? Stroke. 2008;39:3367–3371. doi: 10.1161/STROKEAHA.108.518738. [DOI] [PMC free article] [PubMed] [Google Scholar]
- 2.Jaren O, Selwa L. Causes of mortality on a university hospital neurology service. Neurologist. 2006;12:245–248. doi: 10.1097/01.nrl.0000240859.97587.48. [DOI] [PubMed] [Google Scholar]
- 3.Kelly AG, Hoskins KD, Holloway RG. Early stroke mortality, patient preferences, and the withdrawal of care bias. Neurology. 2012;79:941–944. doi: 10.1212/WNL.0b013e318266fc40. [DOI] [PMC free article] [PubMed] [Google Scholar]
- 4.Shepardson LB, Justice AC, Harper DL, Rosenthal GE. Associations between the use of do-not-resuscitate orders and length of stay in patients with stroke. Med Care. 1998;36:AS57–AS67. doi: 10.1097/00005650-199808001-00007. [DOI] [PubMed] [Google Scholar]
- 5.Shepardson LB, Youngner SJ, Speroff T, O'Brien RG, Smyth KA, Rosenthal GE. Variation in the use of do-not-resuscitate orders in patients with stroke. Arch Intern Med. 1997;157:1841–1847. [PubMed] [Google Scholar]
- 6.Goldstein LB. Accuracy of icd-9-cm coding for the identification of patients with acute ischemic stroke: Effect of modifier codes. Stroke. 1998;29:1602–1604. doi: 10.1161/01.str.29.8.1602. [DOI] [PubMed] [Google Scholar]
- 7.Tirschwell DL, Longstreth WT., Jr Validating administrative data in stroke research. Stroke. 2002;33:2465–2470. doi: 10.1161/01.str.0000032240.28636.bd. [DOI] [PubMed] [Google Scholar]
- 8.The california hospital discharge data reporting manual. 3rd Ed. Sacramento, CA: Office of Statewide Planning and Development; pp. 1999–2000. [Google Scholar]
- 9.Bardach N, Zhao S, Pantilat S, Johnston SC. Adjustment for do-not-resuscitate orders reverses the apparent in-hospital mortality advantage for minorities. Am J Med. 2005;118:400–408. doi: 10.1016/j.amjmed.2005.01.008. [DOI] [PubMed] [Google Scholar]
- 10.Barnato AE, Farrell MH, Chang CC, Lave JR, Roberts MS, Angus DC. Development and validation of hospital "end-of-life" treatment intensity measures. Med Care. 2009;47:1098–1105. doi: 10.1097/MLR.0b013e3181993191. [DOI] [PMC free article] [PubMed] [Google Scholar]
- 11.Quan H, Sundararajan V, Halfon P, Fong A, Burnand B, Luthi JC, et al. Coding algorithms for defining comorbidities in icd-9-cm and icd-10 administrative data. Med Care. 2005;43:1130–1139. doi: 10.1097/01.mlr.0000182534.19832.83. [DOI] [PubMed] [Google Scholar]
- 12.Healthcare cost and utilization project clinical classification software (ccs) for icd-9-cm and icd-10 administrative data. Agency for Healthcare Research and Quality; [Accessed June 12, 2012]. http://www.hcup-us.ahrq.gov/toolssoftware/ccs/ccs.jsp. [Google Scholar]
- 13.Healthcare cost and utilization project supplemental variables for revisit analyses. Agency for Healthcare Research and Quality; [Accessed June 12, 2012]. http://www.hcup-us.ahrq.gov/toolssoftware/revisit/revisit.jsp. [Google Scholar]
- 14.Lichtman JH, Jones SB, Wang Y, Watanabe E, Leifheit-Limson E, Goldstein LB. Outcomes after ischemic stroke for hospitals with and without joint commission-certified primary stroke centers. Neurology. 2011;76:1976–1982. doi: 10.1212/WNL.0b013e31821e54f3. [DOI] [PMC free article] [PubMed] [Google Scholar]
- 15. [Accessed December 13, 2013];How we ranked the best hospitals 2013–14. U.S. News and World Report. http://health.usnews.com/health-news/best-hospitals/articles/2013/07/16/how-we-ranked-the-best-hospitals-2013-14-an-faq.
- 16.Go AS, Mozaffarian D, Roger VL, Benjamin EJ, Berry JD, Borden WB, et al. Heart disease and stroke statistics--2013 update: A report from the american heart association. Circulation. 2013;127:e6–e245. doi: 10.1161/CIR.0b013e31828124ad. [DOI] [PMC free article] [PubMed] [Google Scholar]
- 17.Hanger HC, Fogarty B, Wilkinson TJ, Sainsbury R. Stroke patients' views on stroke outcomes: Death versus disability. Clinical rehabilitation. 2000;14:417–424. doi: 10.1191/0269215500cr330oa. [DOI] [PubMed] [Google Scholar]
- 18.Fried TR, Bradley EH, Towle VR, Allore H. Understanding the treatment preferences of seriously ill patients. N Engl J Med. 2002;346:1061–1066. doi: 10.1056/NEJMsa012528. [DOI] [PubMed] [Google Scholar]
- 19.Werner RM, Asch DA. The unintended consequences of publicly reporting quality information. Jama. 2005;293:1239–1244. doi: 10.1001/jama.293.10.1239. [DOI] [PubMed] [Google Scholar]
- 20.Werner RM, Asch DA, Polsky D. Racial profiling: The unintended consequences of coronary artery bypass graft report cards. Circulation. 2005;111:1257–1263. doi: 10.1161/01.CIR.0000157729.59754.09. [DOI] [PubMed] [Google Scholar]
- 21.Downar J, Luk T, Sibbald RW, Santini T, Mikhael J, Berman H, et al. Why do patients agree to a "do not resuscitate" or "full code" order? Perspectives of medical inpatients. J Gen Intern Med. 2011;26:582–587. doi: 10.1007/s11606-010-1616-2. [DOI] [PMC free article] [PubMed] [Google Scholar]
- 22.Zingmond DS, Wenger NS. Regional and institutional variation in the initiation of early do-not-resuscitate orders. Arch Intern Med. 2005;165:1705–1712. doi: 10.1001/archinte.165.15.1705. [DOI] [PubMed] [Google Scholar]
- 23.Reeves MJ, Myers LJ, Williams LS, Phipps MS, Bravata DM. Do-not-resuscitate orders, quality of care, and outcomes in veterans with acute ischemic stroke. Neurology. 2012;79:1990–1996. doi: 10.1212/WNL.0b013e3182735ced. [DOI] [PubMed] [Google Scholar]
- 24.Zahuranec DB, Morgenstern LB, Sanchez BN, Resnicow K, White DB, Hemphill JC., 3rd Do-not-resuscitate orders and predictive models after intracerebral hemorrhage. Neurology. 2010;75:626–633. doi: 10.1212/WNL.0b013e3181ed9cc9. [DOI] [PMC free article] [PubMed] [Google Scholar]
- 25.Krumholz HM. Variations in health care, patient preferences, and high-quality decision making. Jama. 2013;310:151–152. doi: 10.1001/jama.2013.7835. [DOI] [PMC free article] [PubMed] [Google Scholar]
- 26.Fonarow GC, Pan W, Saver JL, Smith EE, Reeves MJ, Broderick JP, et al. Comparison of 30-day mortality models for profiling hospital performance in acute ischemic stroke with vs without adjustment for stroke severity. Jama. 2012;308:257–264. doi: 10.1001/jama.2012.7870. [DOI] [PubMed] [Google Scholar]
- 27.Fonarow GC, Smith EE, Reeves MJ, Pan W, Olson D, Hernandez AF, et al. Hospital-level variation in mortality and rehospitalization for medicare beneficiaries with acute ischemic stroke. Stroke. 2011;42:159–166. doi: 10.1161/STROKEAHA.110.601831. [DOI] [PubMed] [Google Scholar]