

Abstract
Aiming to identify novel genetic variants and to confirm previously identified genetic variants associated with bone mineral density (BMD), we conducted a three-stage genome-wide association (GWA) meta-analysis in 27 061 study subjects. Stage 1 meta-analyzed seven GWA samples and 11 140 subjects for BMDs at the lumbar spine, hip and femoral neck, followed by a Stage 2 in silico replication of 33 SNPs in 9258 subjects, and by a Stage 3 de novo validation of three SNPs in 6663 subjects. Combining evidence from all the stages, we have identified two novel loci that have not been reported previously at the genome-wide significance (GWS; 5.0 × 10⁻⁸) level: 14q24.2 (rs227425, P-value 3.98 × 10⁻¹³, SMOC1) in the combined sample of males and females and 21q22.13 (rs170183, P-value 4.15 × 10⁻⁹, CLDN14) in the female-specific sample. The two newly identified SNPs were also significant in the GEnetic Factors for OSteoporosis consortium (GEFOS, n = 32 960) summary results. We have also independently confirmed 13 previously reported loci at the GWS level: 1p36.12 (ZBTB40), 1p31.3 (GPR177), 4p16.3 (FGFRL1), 4q22.1 (MEPE), 5q14.3 (MEF2C), 6q25.1 (C6orf97, ESR1), 7q21.3 (FLJ42280, SHFM1), 7q31.31 (FAM3C, WNT16), 8q24.12 (TNFRSF11B), 11p15.3 (SOX6), 11q13.4 (LRP5), 13q14.11 (AKAP11) and 16q24 (FOXL1). Gene expression analysis in osteogenic cells implied potential functional association of the two candidate genes (SMOC1 and CLDN14) in bone metabolism. Our findings independently confirm previously identified biological pathways underlying bone metabolism and contribute to the discovery of novel pathways, thus providing valuable insights into the intervention and treatment of osteoporosis.
INTRODUCTION
Osteoporosis is the most common metabolic skeletal disorder in humans. It predisposes people to fragility fracture particularly at the hip and confers substantial morbidity and mortality (1), affecting over 200 million people worldwide (2).
Osteoporosis is mainly characterized by low bone mineral density (BMD), which is highly heritable with heritability ranging from 0.5 to 0.8 (3). To date, genome-wide association studies (GWASs) and their meta-analyses have identified over 50 loci associated with variations in BMD (4–12). Cumulatively, however, genetic loci identified through GWAS account for no more than 6% of total BMD phenotypic variation (6). Therefore, there is little doubt that additional novel loci await to be uncovered. We here report a new multistage genome-wide association meta-analysis of samples of diverse ancestries and of imputed sequence variants with the 1000 genomes project (1KG) reference panels (13).
RESULTS
This study of meta-analysis comprises three stages (Fig. 1). Stage 1 incorporated seven GWAS samples encompassing 11 140 individuals of diverse ancestries (Supplementary Material, Table S1). The majority (7738; 69.5%) of the individuals were women. Principal component analysis (PCA) was applied to each individual sample (14), and no population outliers were observed. Imputation with the 1KG reference panels generated 5 842 825 SNPs that were qualified for analysis (Supplementary Material, Table S2). After adjusting phenotypes by PCA in each individual study (14), overall genomic control inflation factors were small or modest in both individual GWAS and meta-analysis for each of the spine (SPN-), total hip (HIP-) and femoral neck (FNK-) BMD traits (λ = 0.99–1.06, Supplementary Material, Table S2), implying the limited effects of potential population stratification. A logarithmic quantile–quantile plot of the meta-analysis test statistics showed a marked deviation in the tail of the distribution, both in the gender combined and female-specific samples, implying the possible existence of true associations in these samples (Fig. 2). In the combined sample, a total of 281 SNPs from 10 genomic loci were associated with BMD at the genome-wide significance (GWS; 5.0 × 10⁻⁸) level (Supplementary Material, Table S3). Another 102 SNPs from 18 additional loci yielded P-values between 1.0 × 10⁻⁶ and 5.0 × 10⁻⁸, which was defined as a borderline association (Supplementary Material, Table S4). In the female-specific sample, 45 SNPs from four loci were associated with BMD at the GWS level (Supplementary Material, Table S3); all of these loci overlapped with those identified with the combined sample. Another seven SNPs from an additional four loci were associated at the borderline level (Supplementary Material, Table S4). In the male-specific sample, only one SNP (rs77687936 in 9q21.33) was associated with HIP-BMD at the borderline level (P = 1.88 × 10⁻⁷, Supplementary Material, Table S4). In total, 303 SNPs from 10 different genomic regions were associated with BMD at the GWS level, and 138 from an additional 23 regions fell into the borderline level.
Figure 1.

Diagram workflow of the study design. This study of meta-analysis comprises three stages. In the first stage, seven genome-wide association study (GWAS) samples were analyzed for a meta-analysis. In the second stage, a set of significant SNPs were selected from Stage 1 and subjected to in silico analysis in three additional samples. Novel SNPs significant (or nearly significant) at the GWS level from joint analysis of the above stages were followed up by Stage 3 de novo genotyping in two additional samples. BMD: bone mineral density.
Figure 2.
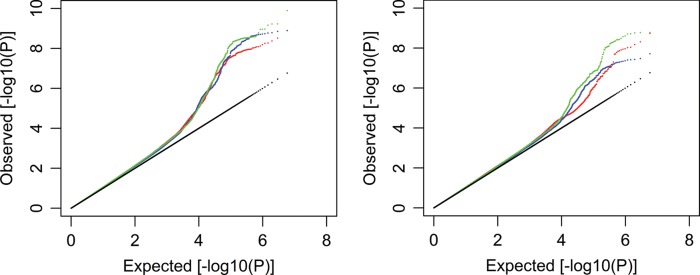
Stage 1 logarithmic quantile–quantile (QQ) plot of GWAS results. A logarithmic QQ plots for BMDs in the combined sample (left) and in the female-specific sample (right). For each sample, results were plotted for the hip (red), femoral neck (blue) and spine (green) BMDs.
To validate the findings of Stage 1, one SNP (generally the one with the strongest signal, with a few exceptions in which the consistency of effect directions was also considered) from each of the 33 (10 GWS plus 23 borderline) regions was selected and subjected to Stage 2 in silico analysis in another three independent GWAS samples encompassing 9258 individuals (Supplementary Material, Tables S1 and S5). In the joint analyses of Stages 1 and 2, 9 of the 10 SNPs attaining GWS level in Stage 1 retained significance at the GWS level, whereas the last SNP rs11696050 was filtered out. Of the 23 borderline SNPs, the signals at five SNPs (rs525592, rs6827815, rs9533095, rs1463104 and rs227425) emerged as being significant at the GWS level, and that of rs170183 nearly reached the GWS level in the female-specific sample (P = 6.16 × 10⁻⁸). No significant, or nearly significant, associations were identified in the male-specific samples. In total, 15 SNPs were identified as being significant, or nearly significant (rs170183), at the GWS level by the joint analysis of Stages 1 and 2.
Twelve of these 15 SNPs reside in genomic regions that had previously been reported to be associated with variations in BMD at the GWS level (4,7,8,11). Of the remaining three SNPs, two reside in genomic regions 14q24.2 (rs227425) and 21q22.13 (rs170183), respectively, which had not been previously reported at the GWS level; the third SNP, rs6827815, resides in 4p16.3 which was independently reported by the GEnetic Factors for osteoporosis consortium (GEFOS) during the preparation of this manuscript (6). To validate these three SNPs (rs227425, rs170183 and rs6827815), they were de novo genotyped in a Stage 3 replication study of two additional independent samples encompassing 6663 subjects of European- and East Asian-ancestries. All the three SNPs showed evidence of association after Bonferroni correction of multiple testing (0.05/3 ≈ 0.02) in the Stage 3 meta-analysis, though rs170183 did not reach the nominal level in Asian subjects (Supplementary Material, Table S6). They remained to be significant at the GWS level in the joint analyses of the three stages (Tables 1 and 2).
Table 1.
New SNPs identified at the GWS level
| Locus | SNP | Alleles | Freq | Gene | Sample | Stage | Sample size | HIP |
FNK |
SPN |
|||||||||
|---|---|---|---|---|---|---|---|---|---|---|---|---|---|---|---|---|---|---|---|
| Beta | Fixed | Random | I2 | Beta | Fixed | Random | I2 | Beta | Fixed | Random | I2 | ||||||||
| 14q24.2 | rs227425 | G/T | EUR:0.53 | SMOC1 | Combined | 1 | 10 917 | −1.33 | 8.32E−4 | 3.15E−3 | 29.1 | −0.84 | 0.04 | 0.11 | 47.5 | −2.05 | 2.69E−7 | 2.69E−7 | 0.0 |
| ASI:0.48 | 2 | 8469 | −0.79 | 0.26 | 0.26 | 0.0 | −0.81 | 0.25 | 0.40 | 40.4 | −2.09 | 5.16E−4 | 0.03 | 0.0 | |||||
| AFR:0.70 | 1 + 2 | 19 386 | −1.19 | 6.35E−4 | 1.39E−3 | 20.4 | −0.81 | 0.02 | 0.06 | 39.1 | −2.06 | 7.41E−10 | 2.20E−9 | 0.0 | |||||
| 3 | 6663 | −2.44 | 5.98E−4 | 0.13 | 85.0 | −2.37 | 8.54E−4 | 0.03 | 70.6 | −2.73 | 1.20E−4 | 1.20E−4 | 19.4 | ||||||
| 1 + 2 + 3 | 26 049 | −1.50 | 2.03E−6 | 3.24E−4 | 43.1 | −1.19 | 1.63E−4 | 5.37E−3 | 46.8 | −2.20 | 3.98E−13 | 8.30E−13 | 0.0 | ||||||
| 21q22.13 | rs170183 | G/A | EUR:0.53 | CLDN14 | Female | 1 | 7360 | 1.99 | 3.71E−7 | 1.13E−5 | 0.0 | 1.81 | 4.44E−6 | 4.44E−6 | 0.0 | 1.50 | 3.25E−4 | 3.25E−4 | 0.0 |
| ASI:0.41 | 2 | 1399 | 1.89 | 0.06 | 0.06 | 0.0 | 1.32 | 0.07 | 0.07 | 22.4 | 2.09 | 0.04 | 0.04 | 0.0 | |||||
| AFR:0.13 | 1 + 2 | 8759 | 1.98 | 6.16E−8 | 4.44E−7 | 0.0 | 1.67 | 1.70E−6 | 1.70E−6 | 0.0 | 1.51 | 3.66E−5 | 3.66E−5 | 0.0 | |||||
| 3 | 3841 | 1.76 | 0.01 | 0.01 | 0.0 | 1.81 | 0.01 | 0.01 | 0.0 | 1.20 | 0.09 | 0.09 | 0.0 | ||||||
| 1 + 2 + 3 | 12 600 | 1.92 | 4.15E−9 | 4.15E−9 | 0.0 | 1.70 | 5.88E−8 | 5.88E−8 | 0.0 | 1.43 | 1.17E−5 | 1.17E−5 | 0.0 | ||||||
We used METAL (15) to perform fixed-effects meta-analysis, which performed on normally transformed quantiles from individual study P-values, and weighted by square root of sample size. Random-effects meta-analysis was performed with the procedure meta.summaries within the R package rmeta. Beta: regression coefficient for transformed quantiles on the first allele (G); Fixed: fixed-effects model P-value; Random: random-effects model P-value; I2: heterogeneity measure; HIP: hip BMD; FNK: femoral neck BMD; SPN, spine BMD; EUR, European; ASI, Asian; AFR, African. P-values of genome-wide significance were marked in bold.
Table 2.
Previous loci replicated in the current study at the GWS level
| Region | SNP | Nearby gene | Dis.(kb) | Trait | Stage | N | P-value |
|---|---|---|---|---|---|---|---|
| 1p36.12 | rs34920465 | ZBTB40 | 78.0 | SPN | 1 | 11 030 | 6.01E−10 |
| 2 | 8469 | 5.62E−5 | |||||
| 1 + 2 | 19 609 | 2.67E−13 | |||||
| 1p31.3 | rs1430740 | GPR177 | 8.2 | SPN | 1 | 11 026 | 8.46E−9 |
| 2 | 6070 | 3.50E−4 | |||||
| 1 + 2 | 17 096 | 1.43E−11 | |||||
| 4p16.3 | rs6827815 | FGFRL1 | 6.3 | FNK | 1 | 11 125 | 6.01E−7 |
| 2 | 9161 | 3.48E−3 | |||||
| 1 + 2 | 20 286 | 9.89E−9 | |||||
| 3 | 6663 | 1.17E−4 | |||||
| 1 + 2 + 3 | 26 949 | 5.19E−12 | |||||
| 4q22.1 | rs1463104 | MEPE | 31.7 | SPN | 1 | 11 026 | 7.08E−7 |
| 2 | 7303 | 6.64E−4 | |||||
| 1 + 2 | 18 329 | 2.04E−9 | |||||
| 5q14.3 | rs6894139 | MEF2C | 148.5 | FNK | 1 | 11 125 | 2.02E−9 |
| 2 | 6762 | 2.55E−10 | |||||
| 1 + 2 | 17 887 | 6.86E−18 | |||||
| 6q25.1 | rs1871859 | C6orf97 | 0.0 | SPN | 1 | 11 029 | 1.27E−10 |
| 2 | 6070 | 9.10E−4 | |||||
| 1 + 2 | 17 099 | 9.29E−13 | |||||
| 7q21.3 | rs10429035 | FLJ42280 | 0.0 | HIP | 1 | 10 444 | 4.24E−9 |
| 2 | 1882 | 9.70E−5 | |||||
| 1 + 2 | 12 326 | 4.18E−12 | |||||
| 7q31.31 | rs10242100 | WNT16 | 2.2 | HIP | 1 | 10 444 | 4.63E−8 |
| 2 | 2399 | 8.81E−4 | |||||
| 1 + 2 | 12 843 | 1.94E−10 | |||||
| 8q24.12 | rs4424296 | TNFRSF11B | 48.9 | SPN | 1 | 11 029 | 5.94E−10 |
| 2 | 6070 | 3.00E−5 | |||||
| 1 + 2 | 17 099 | 8.68E−14 | |||||
| 11p15 | rs7108738 | SOX6 | 277.9 | FNK | 1 | 11 125 | 6.73E−9 |
| 2 | 9161 | 2.86E−8 | |||||
| 1 + 2 | 20 286 | 1.03E−15 | |||||
| 11q13.4 | rs525592 | LRP5 | 0.0 | SPN | 1 | 11 029 | 9.04E−7 |
| 2 | 6070 | 6.74E−6 | |||||
| 1 + 2 | 17 099 | 3.44E−11 | |||||
| 13q14.11 | rs9533095 | TNFSF11 | 179.2 | SPN | 1 | 11 029 | 8.32E−8 |
| 2 | 8469 | 2.95E−9 | |||||
| 1 + 2 | 19 498 | 1.98E−15 | |||||
| 16q24.1 | rs71390846 | FOXL1 | 99.4 | HIP | 1 | 10 444 | 1.29E−9 |
| 2 | 1882 | 0.055 | |||||
| 1 + 2 | 12 326 | 2.36E−10 |
During preparation of this manuscript, the GEFOS released genome-wide association summary results in samples of as many as 17 discovery GWAS samples and 32 960 subjects (6). We checked the replicability of the two newly identified SNPs (rs227425 and rs170183) in the GEFOS results. Two samples (FHS and IFS) in Stage 1 and two in Stage 2 [Rotterdam study (RS) and AOGC] of the present study overlapped with the GEFOS samples; therefore, the GEFOS summary results could not be readily used as independent replication. We were able to obtain replication data of three of the GEFOS remaining samples: two (n = 1479 and 2762, respectively) from the TwinsUK cohort and the third from the Amish family osteoporosis study (AFOS, n = 918). The results were listed in Supplementary Material, Table S7. One of the TwinsUK samples successfully replicated rs227425 (P = 0.02) at 0.05 level. Both TwinsUK samples replicated the effect direction of rs170183, though neither P-value was significant. The AFOS sample (475/918 female/combined subjects) replicated neither P-value nor direction at both SNPs, likely due to the relatively small sample size, among other things. To incorporate the entire GEFOS results, we performed two alternative analyses. In the first analysis, we analyzed associations in the GEFOS remaining samples. In the second analysis, we analyzed associations in the remaining samples of the present study, and then integrated the GEFOS summary results as a whole. For the first analysis, though association signals at the GEFOS remaining non-overlapped samples were not publicly available, we could derive them analytically given signals at combined samples (overlapped plus remaining) and at overlapped samples (Supplementary Material). In Supplementary Material, Table S8, we derived the P-values at rs227425 and rs170183 were 0.18 and 1.41 × 10⁻³ in the GEFOS remaining samples, respectively, both having the same effect direction as that in the present study. In this sense, rs170183 was successfully replicated by the GEFOS remaining samples. Though rs227425 was not replicated at P = 0.05, its effect direction was indeed consistent. For the second analysis, after removing four overlapped samples (FHS, n = 3747; IFS, n = 1488; RS, n = 4904; AOGC, n = 1955; total n = 12 094) from the present study, P-values at rs227425 and rs170183 were 1.34 × 10⁻¹⁰ and 3.74 × 10⁻⁶ (Supplementary Material, Table S9). P-values in the GEFOS samples were 1.24 × 10⁻³ and 5.90 × 10⁻⁴. Therefore, both SNPs were successfully replicated by the GEFOS. Though rs170183 was not significant at the GWS level in the present study without the four overlapped samples, including the GEFOS signal (with all the GEFOS samples) did reached a GWS signal (P = 4.62 × 10⁻⁸).
For the two familial samples (FHS and IFS), we used the method that we developed previously to test association (16). Here, we verified the analyses by two alternative methods. The first method was Chen and Abecasis (17), which gave nearly identical P-values to our previous analyses (Supplementary Material, Table S10). The second method was the transition disequilibrium test (TDT) implemented in PLINK (18). Signals at both SNPs by TDT got weaker (Supplementary Material, Table S10), implying that TDT was possibly low-powered, as is generally expected (16,17).
rs227425 was associated with SPN-BMD at the GWS level (P = 3.98 × 10⁻¹³, Table 1); the associations for both HIP-BMD (P = 2.03 × 10⁻⁶) and FNK-BMD (P = 1.63 × 10⁻⁴) were also suggestively significant. Allele G at this imputed SNP has a frequency between 0.48 (East Asian) and 0.70 (African) and tended to decrease BMDs (Fig. 3). This SNP is located in an intron of the SMOC1 (secreted modular calcium-binding protein 1) gene (Supplementary Material, Fig. S1) in 14q24.2. Though several other genes, including SRSF5, SLC10A1 and SLC8A3, also reside in this region, SMOC1 is of particular interest because of its known regulatory function on bone development. This gene encodes a glycoprotein with a calcium-dependent conformation (19). It acts as a regulator of osteoblast differentiation of bone marrow-derived mesenchymal stem cells (20), and is essential for ocular and limb development (21). Its regulatory mechanism also involves antagonism of activities of bone morphogenetic protein (18).
Figure 3.

Forest plots for the two newly identified SNPs. Regression coefficient (beta) and its 95% confidence interval (CI) were presented as un-transformed estimates from individual studies.
The association of the imputed SNP rs170183 in 21q22.13 was only found in the female-specific sample, most convincingly with HIP-BMD (P = 4.15 × 10⁻⁹, Tables 1), but also with FNK-BMD (P = 5.88 × 10⁻⁸) and SPN-BMD (P = 1.17 × 10⁻⁵). There was no evidence of association in the male-specific sample (HIP-BMD P = 0.26). Allele G at this SNP increased BMD (Fig. 3). This region has been previously reported to be associated with hip (P = 3.90 × 10⁻⁴) and spine (P = 7.70 × 10⁻³) BMDs in a female-specific sample through two SNPs (rs219779 and rs219780), though neither of the signals achieved GWS in that study (22). In the present study, the signals at both SNPs were weak (rs219779 P = 0.04; rs219780 P = 0.07, for HIP-BMD). Though the two SNPs were in strong LD with each other (r2 = 0.75), neither of them was strongly correlated with rs170183 (rs219779 r2 = 0.24; rs219780 r2 = 0.17). The association of rs170183 conditioning on both rs219779 and rs219780 remained significant (Stage 1 P = 3.45 × 10⁻⁵), implying that rs170183 may represent a largely independent signal from what was reported previously (22). It is located in an intron of the CLDN14 (claudin 14) gene (Supplementary Material, Fig. S2), which was previously proposed as a candidate gene (22). The product of CLDN14 is an integral membrane protein and a component of tight junction strands (23). It has been reported to be associated with levels of urinary calcium and serum parathyroid hormone (22), and may therefore regulate bone development through its regulatory effect on calcium metabolism.
The 13 previously reported loci that were replicated in the current study at the GWS level included the following: 1p36.12 (ZBTB40), 1p31.3 (GPR177), 4p16.3 (IDUA, FGFRL1), 4q22.1 (MEPE), 5q14.3 (MEF2C), 6q25.1 (ESR1, C6orf97), 7q21.3 (FLJ42280), 7q31.31 (WNT16, FAM3C), 8q24.12 (TNFRSF11B), 11p15 (SOX6), 11q13.4 (LRP5), 13q14.11 (AKAP11) and 16q24.1 (FOXL1) (Table 2). Among these loci, 4p16.3 is of particular interest. rs6827815 in this loci was strongly associated with FNK-BMD (P = 5.19 × 10⁻¹²) and HIP-BMD (P = 4.38 × 10⁻⁹). Its association with SPN-BMD was also suggestively significant (P = 2.44 × 10⁻⁴). The region was recently reported to be associated with variations in BMD by another SNP (rs3755955) (6), which showed association in the current study as well (stage 1 P = 1.80 × 10⁻⁶ for FNK-BMD). The signals at both rs6827815 and rs3755955 were likely to be derived from the same source due to their strong LD pattern (r2 = 0.97). rs6827815 is located in the intergenic region between IDUA (iduronidase, 1.1 kb) and FGFRL1 (fibroblast growth factor receptor-like 1, 6.3 kb). Despite being located in the same haplotype block with IDUA, rs6827815 is also in strong LD with multiple SNPs within FGFRL1 (Supplementary Material, Fig. S3). Even for SNP rs4647940 in FGFRL1 that is ∼20.9 kb from rs6827815, the LD pattern between these two SNPs remains rather strong (r2 = 0.93). FGFRL1 is of significant interest due to its biological function. The protein encoded by FGFRL1, which is expressed preferentially in skeletal tissues, is a member of the fibroblast growth factor receptor (FGFR) family (24). FGF and FGF receptors have been shown to be important for bone development (25), and mutations in FGFRL1 induce skeletal disorders in humans (26). FGFRL1 appears to function as a decoy receptor, i.e. it binds FGF ligands, without inducing signal transduction. Thus, the regulatory role of FGFRL1 is likely to occur through competitive inhibition; it binds FGF ligands and sequesters them away from functional FGF receptors (27).
We checked the cumulative effects of identified GWS SNPs on BMD variation in two of the tested samples: KCOS (Kansas City Osteoporosis Study, n = 2250) and COS (China Osteoporosis Study, n = 1547) samples. Collectively, the two SNPs (rs227425 and rs170183) explained 0.3–0.7% of phenotypic variation in BMD. Taking the 13 SNPs from previously reported loci into account, the total explainable phenotypic variation ranged from 2.8 to 4.9% depending on population sample and skeletal site. Considering that heritability of BMD is estimated to be as high as 50–80%, the majority of genetic determination for BMD variation still remains to be discovered.
To explore the potential functional relationship between the two candidate genes (SMOC1 and CLDN14) and variations in BMD, we compared their in vivo expression in peripheral blood monocytes (PBM; potential osteoclastogenic cells, which may also secrete cytokines important for bone metabolism) in a group of 15 premenopausal female subjects of Caucasian population with high hip BMD (z-score >0.7, 25% top of the phenotypic distribution) versus another group of 14 matched premenopausal female subjects with low hip BMD (z-score <−0.5, 30% bottom of the phenotypic distribution). Both genes were differentially expressed in PBMs between the two groups at the nominal level P < 0.05 (Table 3), strengthening the argument that these genes may be biologically relevant to the regulation of bone metabolism.
Table 3.
Gene expressions in PBM cells
| Gene | Probe ID | Mean intensity (s.d.) |
P-value | |
|---|---|---|---|---|
| High (n = 15) | Low (n = 14) | |||
| SMOC1 | 991 408 | 6.91 (0.72) | 6.27 (0.37) | 2.93E−3 |
| CLDN14 | 1 310 762 | 10.48 (0.64) | 10.06 (0.35) | 0.04 |
Gene expressions in human potential osteoclastogenic cells (peripheral blood monocytes, PBMs) were examined. The sample consisted of 29 premenopausal female subjects of European ancestry, 15 of which had high hip BMD (z-score >0.7) and 14 had low hip BMD (z-score <−0.5). Gene expression experiment was conducted with Affymetrix Human Exon 1.0 ST Array.
DISCUSSION
In this study, using a three-stage genome-wide association meta-analysis, we have identified two novel loci that are associated with BMD variation at the GWS level. We have also replicated 13 previously identified loci at the GWS level.
Though the samples that we analyzed were diverse in ancestries, neither of the two loci we identified through the present meta-analysis was likely to have emerged from this heterogeneity. First, neither Q nor I2 measures gave evidence of heterogeneity at either of the identified SNPs. Second, the random-effects model, which is more robust against heterogeneity, gave similar results to the fixed-effects model. Third, sensitivity analysis on the two newly identified SNPs gave consistent results among studies (Supplementary Material, Table S11). Finally, multiple genomic regions that were previously identified using similar analytical approaches were replicated in the present study. Therefore, our newly identified loci are likely to represent true genetic susceptibility loci for variations in BMD that are shared across the different populations studied. Despite lack of validation of the imputation by real genotyping, the two SNPs were accurately imputed with remarkable MACH imputation accuracy measures in Stage 1 (ranging from 0.78 to 0.99). In addition, the real genotyping we performed for all of the >6600 subjects at Stage 3 replication testing showed consistently significant effects for these two SNPs, which partially attests to the high accuracy of the imputation in Stages 1 and 2.
In the recently published paper by the GEFOS (6) a total of 56 SNPs were identified to be associated with SPN and/or FNK-BMDs at the GWS level. Four samples (FHS, RS, IFS and AOGC, n = 12 094) used in that study overlapped with the present one. Though both of the newly identified SNPs in the current study were suggestively significant in the overlapped samples (Fig. 3), none of them was significant at the GWS level in the study by Estrada et al. (6). Our findings therefore imply that though a new meta-analysis of a smaller sample size is less powerful than that of a larger sample, it may still have power to identify a few novel responsible loci (28,29). For a SNP with an effect as low as 0.05%, the power to detect it is as low as 0.57% (Stage 1 threshold 1 × 10⁻⁶) for a sample of 11 140 subjects. But as we are performing a hypothesis free genome-wide scan, the power to detect at least one of many causal SNPs, i.e. 500, is as high as 94.26%. Nevertheless, for a sample of ∼33 000 discovery subjects, the power to identify/replicate any particular SNP is quite low, only 8.21% at the GWS level, or 24.41% at the suggestive level (GWS threshold 5 × 10⁻⁸, suggestive threshold 1 × 10⁻⁶). Another explanation of our new findings may lie in different heterogeneity settings in different analyses. Of the 56 SNPs identified in Estrada et al. (6), 54 were available for analysis in our Stage 1 results (Supplementary Material, Table S12). Among them, 30 were significant after multiple testing adjustment (P = 0.05/54). With the random-effects model, however, only 20 of these 30 SNPs retained significance, implicating the potential heterogeneity effects for the remaining 10 SNPs identified earlier in the present study. When extending the analyses to the most significant SNP within the 100 kb flanking region for each reported SNP, 40 were significant with the fixed-effects model, and 35 were significant with the random-effects model (Supplementary Material, Table S12). The non-replicability on the remaining regions implies that heterogeneous effects are sample specific, so that loci identified in one set of samples may be masked in another set of samples due to the specific heterogeneous structures related to that particular set of samples on particular loci.
We recognize that our original discovery sample includes samples that are included in the GEFOS consortium, so the overall evidence of association in the GEFOS paper cannot be taken as completely independent replication. We were unable to obtain results for the subset of GEFOS samples not included in our original discovery sample. We were able to obtain replication data from two samples of the TwinsUK cohort (n = 2762 and 1479, respectively) and one sample of the AFOS (n = 918/475 combined/female subjects). We therefore removed the GEFOS data from our original discovery data (which still left a genome-wide significant result) and also tried to computationally and theoretically estimate the P-values that would have been obtained in the GEFOS data, excluding those samples that are in our discovery set. Nevertheless, independent validation of this finding would be desirable to more completely rule out a false-positive association or to establish population heterogeneity in the genetic effects identified.
On replicating the identified novel SNPs by the GEFOS results, the shift of the overlapped samples from the discovery phase into the replication phase may incur a ‘winner's curse’ effect (30). Nonetheless, we would expect this effect to have a minimum impact in this case for the following two reasons: first, analysis of samples in the present study without the overlapped samples already achieved (or nearly achieved) the GWS significance level, which means the SNPs could have been selected even without the involvement of any of the GEFOS samples. Second, the most promising and convincing evidence is the combined analysis of all samples, which still leaves the two SNPs significant at the GWS level.
In summary, by performing a multistage genome-wide association meta-analysis, we have identified two novel loci for BMD at the GWS level, and have replicated many previously reported loci. We have also explored the functional importance of the two involved candidate genes by gene expression experiments. Our findings, together with one previously reported larger meta-analysis, provide solid and coincident evidence of association for the two identified loci. The discovery stage GWAS association summary results were available at https://tulane.app.box.com/s/biemkwud7cm3cvn4ut1u.
MATERIALS AND METHODS
Study design
This study of meta-analysis comprises three stages. In Stage 1, we collected seven GWAS samples and performed a meta-analysis of BMDs at the spine, total hip and femoral neck (due to its clinical significance to hip fractures) for association. In Stage 2, we selected a set of SNPs of interest in Stage 1, and analyzed them in silico in three additional samples. Novel SNPs significant, or nearly significant, at the GWS level from joint analysis of both stages were followed up by Stage 3 de novo genotyping in two additional samples.
Study populations
This study incorporated samples from multiple research and/or clinical centers. All samples were approved by the respective institutional ethics review boards, and all participants provided written informed consent.
In Stage 1, seven GWAS samples were incorporated, of which three were from in-house studies and four were identified from the database of genotype and phenotype (dbGAP). The three in-house samples consisted of two with 987 (Omaha osteoporosis study, OOS) (5) and 2250 (Kansas City osteoporosis study, KCOS) unrelated individuals, respectively, of European ancestry, and the third (China osteoporosis study, COS) with 1547 unrelated individuals of Chinese Han ancestry. The fourth sample was derived from the Framingham Heart Study (FHS), a longitudinal and prospective cohort comprising >16 000 individuals spanning three generations, of European ancestry (4). Focusing on the first two generations, we identified 3747 phenotyped individuals. The fifth sample was the Indiana Fragility Study (IFS), a cross-sectional cohort comprising 1493 premenopausal sister pairs of European ancestry (6). After quality control, 1488 subjects were qualified for analysis. Both the sixth and seventh samples were derived from the Women's Health Initiative (WHI) observational study, a partial factorial randomized and longitudinal cohort with >12 000 genotyped women aging 50–79 years, of African-American or Hispanic ancestry (31). The sixth sample comprises 712 phenotyped individuals of African-American ancestry, and the seventh sample comprises 409 phenotyped individuals of Hispanic ancestry.
The Stage 2 in silico replication incorporated three GWAS samples. The first sample was the RS comprising 4904 unrelated individuals of European ancestry (4). The second sample was the Korean genome epidemiology study (KoGES) comprising 2399 unrelated individuals of Eastern Asian ancestry. The third one was the Anglo-Australasian Osteoporosis Genetics Consortium (AOGC) (10), an extreme-ascertained cohort comprising 1955 unrelated menopausal women of European ancestry with either high total hip BMD (z-score between +1.5 and +4.0) or low total hip BMD (z-score between −4.0 and −1.5).
The Stage 3 de novo genotyping replication included two additional samples, one with 3923 unrelated independent individuals of European ancestry derived from the KCOS (KCOSR) cohort, and the other with 2740 unrelated independent individuals of Chinese Han ancestry derived from the COS (COSR) cohort.
Phenotype measurements and modeling
BMD was measured at the lumbar spine and hip and/or femoral neck with dual-energy X-ray absorptiometry (DXA) scanners (either Lunar Corp., Madison, WI, USA; or Hologic Inc., Bedford, MA, USA was used within individual study samples) following the manufacturer protocols (Supplementary Material, Table S1). In each of the Stage 1 GWAS samples, covariates were screened among gender, age, age2, weight, height, scan side (in FHS) and scanner ID (in WHI) with the stepwise linear regression model. Raw BMD measurements were adjusted by significant covariates. To adjust for potential population stratification, the first five principal components derived from genome-wide genotype data were included as covariates (14). Residual phenotypes after adjustment were normalized by inverse quantile of the standard normal distribution to impose a normal distribution on phenotypes that were analyzed subsequently (32).
Genotyping and quality control
All Stage 1 GWAS samples were genotyped by high-throughput SNP genotyping arrays (Affymetrix Inc., Santa Clara, CA, USA; or Illumina Inc., San Diego, CA, USA within individual samples) following the manufacturer's protocols (Supplementary Material, Table S2). Quality control of genotype data were implemented with Plink (18), with the following criteria applied: individual missingness <5%, SNP call rate >95%, and Hardy–Weinberg equilibrium (HWE) P-value > 1.0 × 10⁻⁵. For familial samples (FHS and IFS), all genotypes with the Mendel error were set to missing. Population outliers were monitored by principal components derived from genome-wide genotype analysis.
Genotype imputation
Each GWAS sample from Stage 1 was imputed by the 1KG sequence variants (as of August, 2010). Reference haplotypes representing 283 individuals with European ancestry, 193 with Asian ancestry, and 174 with African ancestry were downloaded from MACH (15) download website. Each GWAS sample was imputed by the respective reference panel with the closest ancestry.
Prior to imputation, a consistency test of allele frequency between GWAS and reference samples was examined with the chi-square test. To correct for potential mis-strandedness, GWAS SNPs that failed a consistency test (P < 1.0 × 10⁻⁶) were transformed into reverse strand. SNPs that again failed consistency were removed from the GWAS sample.
To distribute imputation computation to multiple parallel CPUs, chromosomes were split into non-overlapping fragments each of 10 Mb length. In each fragment, haplotypes of individual GWAS were phased by a Markov Chain Haplotyping algorithm (MACH) (15).For familial samples (FHS and IFS), 200 unrelated founder individuals were randomly selected to estimate model parameters, which were then used to impute all family members. Based on phased haplotypes, untyped genotypes were then imputed by a computationally efficient imputing algorithm Minimac (15). Each GWAS sample was imputed by relevant population's reference haplotypes. SNPs with r2 score <0.3 as estimated by Minimac were considered of poor imputation accuracy. SNPs of high accuracy in at least two samples, and of minor allele frequency (MAF) >0.05 in at least one sample, were included for subsequent analyses.
Stage 1 association testing
Each GWAS sample was tested for association between phenotypes and genotyped and imputed SNPs under an additive mode of inheritance. For unrelated samples, association was examined by the linear regression model with MACH2QTL (15), in which allele dosage was taken as the predictor for the phenotype. For familial samples (FHS and IFS), a mixed linear model was used in which the effect of genetic relatedness within each pedigree was also taken into account (16). Genomic control inflation factor (33) was estimated for each individual GWAS. Associations in both the gender combined sample and gender-specific samples were examined.
Stage 1 meta-analysis
Summary statistics of associations from each GWAS were combined to perform weighted fixed-effect meta-analysis with METAL (34), in which weights were proportional to the square-root of each sample size. Cochran's Q statistic and I2 were calculated as measures of between-study heterogeneity (35). Random-effect meta-analyses were performed to those SNPs with Q P-value of <0.05 or I2 value >50% with the standard procedure meta.summaries in the R package rmeta.
Stage 2 in silico analysis
A total of 33 SNPs, each representing a distinct genomic region, were selected for Stage 2 in silico analyses. The prioritization of SNPs for Stage 2 was primarily based on the strongest P-values, with a few exceptions in which the consistency of direction of the effects was also considered. PCA was applied in all Stage 2 samples to account for population stratification effects. For imputation, the RS used overlapping fragments each of 2000 markers with 100 markers of overlap to improve imputation quality. Overlapping regions were removed after imputation. Association analyses in the RS sample were performed with MACH2QTL (15) via GRIMP (36) (which uses genotype dosage value as a predictor in a linear regression framework). Imputation and association analyses in KoGES were performed with IMPUTE2 (37) and Plink (18). For the AOGC sample, genotypes data quality control was performed as in the earlier study (10). Effective BMD was calculated correcting for weight, age, age2 and the first four eigenvectors of the principle components (14). The 16 densitometers for BMD measurement were taken as random variables to adjust for their effects. Imputation was performed with MACH (15), with the 1KG European reference panel (as of August 2010). The corrected BMD distribution follows an approximate normal distribution using the Shapiro–Wilk normality test (P = 0.537). MACH2QTL (15) was used to perform the association analysis. The summary statistics of Stage 2 were meta-analyzed with Stage 1 results with METAL (34).
Stage 3 de novo genotyping analysis
Joint analyses of Stages 1 and 2 produced at GWS level 12 loci that had been reported previously, and 3 new loci (one was reported during the preparation of this manuscript). The three SNPs were followed up in Stage 3 of de novo genotyping in two independent samples, namely KCOSR and COSR. The KCOSR and COSR samples were genotyped by Kbiosciences (UK) and Shanghai Biowing (China) companies, respectively. Quality control included individual missingness <5%, SNP call rate >90%, and HWE P-value >1.0 × 10⁻⁵. Associations for Stage 3 were examined with Plink (18). Joint meta-analysis of Stage 1 + 2 + 3 were performed with METAL (34), and regional Manhattan plot was drawn with LocusZoom (38).
Sensitivity analysis
Sensitivity analyses were conducted by removing each study in turn, studies with Asian ancestry, and studies with African and Hispanics ancestries, respectively.
Gene expression analysis in human osteoclasts
The two candidate genes (SMOC1 and CLDN14) implied by the identified SNPs were tested for their expressions in human potential osteoclastogenic cells (PBMs) between subjects with high versus low BMDs. The sample consisted of 29 premenopausal female subjects of European ancestry, 15 of which were with high hip BMD (z-score >0.7, 25% top of the phenotypic distribution) and 14 were with low hip BMD (z-score <−0.5, 30% bottom of the phenotypic distribution). Gene expression experiment was a part of an ongoing project, conducted with Affymetrix Human Exon 1.0 ST Array following the manufacturer protocols. Association analyses of gene expression intensities between the two groups were performed with the R package linear models for microarray data (limma) (39).
SUPPLEMENTARY MATERIAL
FUNDING
This work was supported by the National Institutes of Health (P50AR055081, R01AG026564, R01AR050496, RC2DE020756, R01AR057049, and R03TW008221 to H.W.D.); the National Natural Science Foundation of China (31100902 to L.Z.); the Netherlands Organization of Scientific Research NWO Investments (175.010.2005.011 and 911-03-012 to K.E., F.R. and A.G.U.); the Research Institute for Diseases in the Elderly (014-93-015 and RIDE2 to K.E., F.R. and A.G.U.); the Netherlands Genomics Initiative (NGI)/Netherlands Organization for Scientific Research (050-060-810 to K.E., F.R. and A.G.U.); the National Genome Research Institute, Korean Center for Disease Control and Prevention (2001-2003-348-6111-221, 2004-347-6111-213 and 2005-347-2400-2440-215 to H.J.C., J.Y.L., B.G.H., C.S.S. and N.H.C.); the Australian Cancer Research Foundation and Rebecca Cooper Foundation (511132 to AOGC) and the National Health and Medical Research Council (Australia) Career Development Award (569807 to E.L.D.).
H.W.D. was partially supported by the Franklin D. Dickson/Missouri Endowment and the Edward G. Schlieder Endowment. Funding of AOGC was also received from the Australian Cancer Research Foundation and Rebecca Cooper Foundation (Australia). M.A.B. is funded by a National Health and Medical Research Council (Australia) Senior Principal Research Fellowship. I.R. is supported by the Health Research Council of New Zealand. The Sydney Twin Study and Tasmanian Older Adult Cohort were supported by the National Health and Medical Research Council, Australia.
The Rotterdam study is funded by Erasmus Medical Center and Erasmus University, Rotterdam, Netherlands Organization for the Health Research and Development (ZonMw), the Research Institute for Diseases in the Elderly (RIDE), the Ministry of Education, Culture and Science, the Ministry for Health, Welfare and Sports, the European Commission (DG XII) and the Municipality of Rotterdam.
The Dubbo Osteoporosis Epidemiology Study was supported by the Australian National Health and Medical Research Council, MBF Living Well Foundation, the Ernst Heine Family Foundation and from untied educational grants from Amgen, Eli Lilly International, GE-Lunar, Merck Australia, Novartis, Sanofi-Aventis Australia and Servier.
The Hertfordshire Cohort Study was supported by grants from the MedicalResearch Council UK & Arthritis Research UK. The Oxford Osteoporosis Study was funded by Action Research, UK. The Framingham Heart Study is conducted and supported by the National Heart, Lung, and Blood Institute NHLBI in collaboration with Boston University (Contract No. N01-HC-25195). Funding for SHARe Affymetrix genotyping was provided by NHLBI Contract N02-HL-64278. SHARe Illumina genotyping was provided under an agreement between Illumina and Boston University. Funding support for the Framingham Bone Mineral Density datasets was provided by NIH grants R01 AR/AG 41398.
Funding support for the Genetic Determinants of Bone Fragility (the Indiana fragility study) was provided through the NIA Division of Geriatrics and Clinical Gerontology. Genetic Determinants of Bone Fragility is a genome-wide association studies funded as part of the NIA Division of Geriatrics and Clinical Gerontology. Support for the collection of datasets and samples were provided by the parent grant, Genetic Determinants of Bone Fragility (P01-AG018397). Funding support for the genotyping which was performed at the Johns Hopkins University Center for Inherited Diseases Research was provided by the NIH NIA.
The WHI program is funded by the National Heart, Lung, and Blood Institute, National Institutes of Health, U.S. Department of Health and Human Services through contracts N01WH22110, 24152, 32100-2, 32105-6, 32108-9, 32111-13, 32115, 32118-32119, 32122, 42107-26, 42129-32, and 44221. WHI PAGE is funded through the NHGRI Population Architecture Using Genomics and Epidemiology (PAGE) network (Grant No. U01 HG004790).
Supplementary Material
ACKNOWLEDGEMENTS
We thank all study participants who provided the DNA sample and phenotypic information. We are also grateful to all staff who provided the clinical expertize, collected the data and/or performed the biological experiments that made this study possible.
We are grateful to Drs. Brent J. Richards and Timothy D. Spector for providing in silico replication results in the TwinsUK1 and TwinsUK23 studies. We thank P. Arp, M. Jhamai, M. Moorhouse, M. Verkerk and S. Bervoets for their help in creating the Rotterdam GWAS database. The help of Dr Joanna Makovey from the Sydney Twin Study is gratefully acknowledged. The contribution from A/Prof. Jacqueline R. Center, A/Prof. Tuan V. Nguyen, Mr Sing C. Nguyen, Ms DeniaMang and Ms Ruth Toppler is gratefully acknowledged. The OPUS study was supported by Sanofi-Aventis, Eli Lilly, Novartis, Pfizer, Proctor&Gamble Pharmaceuticals and Roche. We thank the co-principal investigators from OPUS (Dr Christian Roux, Dr David Reid, Dr Claus Glüer and Dr Dieter Felsenber); Ms Judith Finigan and Ms Selina Simpson. The assistance of Ms FatmaGossiel (Sheffield) is gratefully acknowledged. We thank the men and women who participated; Prof. Cyrus Cooper; and the Herfordshire GPs who supported the study. The AOGC thanks the research nurses involved in this study (Ms Barbara Mason and Ms Amanda Horne (Auckland), Ms Linda Bradbury and Ms Kate Lowings (Brisbane), Ms Katherine Kolk and Ms RumbidzaiTichawangana (Geelong); Ms Helen Steane (Hobart); Ms Jemma Christie (Melbourne); and Ms Janelle Rampellini (Perth)). The AOGC also acknowledges gratefully technical support from Ms Kathryn Addison, Ms MariekeBrugmans, Ms Catherine Cremen, Ms Johanna Hadler and Ms Karena Pryce.
This manuscript was not prepared in collaboration with investigators of the Framingham Heart Study and does not necessarily reflect the opinions or views of the Framingham Heart Study, Boston University, or NHLBI. The FHS datasets used for the analyses described in this manuscript were obtained from dbGaP at http://www.ncbi.nlm.nih.gov/sites/entrez?db=gap through dbGaP accession phs000007.v14.p6. Assistance with phenotype harmonization and genotype cleaning, as well as with general study coordination, of Genetic Determinants of Bone Fragility study was provided by the NIA Division of Geriatrics and Clinical Gerontology and the NIA Division of Aging Biology. The IFS datasets used for the analyses described in this manuscript were obtained from dbGaP at http://www.ncbi.nlm.nih.gov/sites/entrez?db=gap through dbGaP accession phs000138.v2.p1. This manuscript was not prepared in collaboration with investigators of the WHI, has not been reviewed and/or approved by the Women's Health Initiative (WHI) and does not necessarily reflect the opinions of the WHI investigators or the NHLBI. Assistance with phenotype harmonization, SNP selection, data cleaning, meta-analyses, data management and dissemination and general study coordination, was provided by the PAGE Coordinating Center (U01HG004801-01). The WHI datasets used for the analyses described in this manuscript were obtained from dbGaP at http://www.ncbi.nlm.nih.gov/sites/entrez?db=gap through dbGaP accession phs000200.v6.p2.
Conflict of Interest statement. None declared.
REFERENCES
- 1.Cummings S.R., Melton L.J. Epidemiology and outcomes of osteoporotic fractures. Lancet. 2002;359:1761–1767. doi: 10.1016/S0140-6736(02)08657-9. [DOI] [PubMed] [Google Scholar]
- 2.Reginster J.Y., Burlet N. Osteoporosis: a still increasing prevalence. Bone. 2006;38:S4–S9. doi: 10.1016/j.bone.2005.11.024. [DOI] [PubMed] [Google Scholar]
- 3.Peacock M., Turner C.H., Econs M.J., Foroud T. Genetics of osteoporosis. Endocr. Rev. 2002;23:303–326. doi: 10.1210/edrv.23.3.0464. [DOI] [PubMed] [Google Scholar]
- 4.Rivadeneira F., Styrkarsdottir U., Estrada K., Halldorsson B.V., Hsu Y.H., Richards J.B., Zillikens M.C., Kavvoura F.K., Amin N., Aulchenko Y.S., et al. Twenty bone-mineral-density loci identified by large-scale meta-analysis of genome-wide association studies. Nat. Genet. 2009;41:1199–1206. doi: 10.1038/ng.446. [DOI] [PMC free article] [PubMed] [Google Scholar]
- 5.Xiong D.H., Liu X.G., Guo Y.F., Tan L.J., Wang L., Sha B.Y., Tang Z.H., Pan F., Yang T.L., Chen X.D., et al. Genome-wide association and follow-up replication studies identified ADAMTS18 and TGFBR3 as bone mass candidate genes in different ethnic groups. Am. J. Hum. Genet. 2009;84:388–398. doi: 10.1016/j.ajhg.2009.01.025. [DOI] [PMC free article] [PubMed] [Google Scholar]
- 6.Estrada K., Styrkarsdottir U., Evangelou E., Hsu Y.H., Duncan E.L., Ntzani E.E., Oei L., Albagha O.M., Amin N., Kemp J.P., et al. Genome-wide meta-analysis identifies 56 bone mineral density loci and reveals 14 loci associated with risk of fracture. Nat. Genet. 2012;44:491–501. doi: 10.1038/ng.2249. [DOI] [PMC free article] [PubMed] [Google Scholar]
- 7.Richards J.B., Rivadeneira F., Inouye M., Pastinen T.M., Soranzo N., Wilson S.G., Andrew T., Falchi M., Gwilliam R., Ahmadi K.R., et al. Bone mineral density, osteoporosis, and osteoporotic fractures: a genome-wide association study. Lancet. 2008;371:1505–1512. doi: 10.1016/S0140-6736(08)60599-1. [DOI] [PMC free article] [PubMed] [Google Scholar]
- 8.Styrkarsdottir U., Halldorsson B.V., Gretarsdottir S., Gudbjartsson D.F., Walters G.B., Ingvarsson T., Jonsdottir T., Saemundsdottir J., Center J.R., Nguyen T.V., et al. Multiple genetic loci for bone mineral density and fractures. N. Engl. J. Med. 2008;358:2355–2365. doi: 10.1056/NEJMoa0801197. [DOI] [PubMed] [Google Scholar]
- 9.Styrkarsdottir U., Halldorsson B.V., Gretarsdottir S., Gudbjartsson D.F., Walters G.B., Ingvarsson T., Jonsdottir T., Saemundsdottir J., Snorradottir S., Center J.R., et al. New sequence variants associated with bone mineral density. Nat. Genet. 2009;41:15–17. doi: 10.1038/ng.284. [DOI] [PubMed] [Google Scholar]
- 10.Duncan E.L., Danoy P., Kemp J.P., Leo P.J., McCloskey E., Nicholson G.C., Eastell R., Prince R.L., Eisman J.A., Jones G., et al. Genome-wide association study using extreme truncate selection identifies novel genes affecting bone mineral density and fracture risk. PLoS. Genet. 2011;7:e1001372. doi: 10.1371/journal.pgen.1001372. [DOI] [PMC free article] [PubMed] [Google Scholar]
- 11.Duan Q., Liu E.Y., Croteau-Chonka D.C., Mohlke K.L., Li Y. A comprehensive SNP and indel imputability database. Bioinformatics. 2013;29:528–531. doi: 10.1093/bioinformatics/bts724. [DOI] [PMC free article] [PubMed] [Google Scholar]
- 12.Guo Y., Tan L.J., Lei S.F., Yang T.L., Chen X.D., Zhang F., Chen Y., Pan F., Yan H., Liu X., et al. Genome-wide association study identifies ALDH7A1 as a novel susceptibility gene for osteoporosis. PLoS Genet. 2010;6:e1000806. doi: 10.1371/journal.pgen.1000806. [DOI] [PMC free article] [PubMed] [Google Scholar]
- 13.The 1000 Genomes Project Consortium. A map of human genome variation from population-scale sequencing. Nature. 2011;467:1061–1073. doi: 10.1038/nature09534. [DOI] [PMC free article] [PubMed] [Google Scholar]
- 14.Pasaniuc B., Zaitlen N., Bhatia G., Gusev A., Patterson N., Price A. 2012 Fast and accurate 1000 Genomes imputation using summary statistics or low-coverage sequencing data. (Program #89). Presented at the 62nd Annual Meeting of The American Society of Human Genetics, November 8, 2012 in San Francisco, California. [Google Scholar]
- 15.Li Y., Willer C.J., Ding J., Scheet P., Abecasis G.R. MaCH: using sequence and genotype data to estimate haplotypes and unobserved genotypes. Genet. Epidemiol. 2010;34:816–834. doi: 10.1002/gepi.20533. [DOI] [PMC free article] [PubMed] [Google Scholar]
- 16.Zhang L., Li J., Pei Y.F., Liu Y., Deng H.W. Tests of association for quantitative traits in nuclear families using principal components to correct for population stratification. Ann. Hum. Genet. 2009;73:601–613. doi: 10.1111/j.1469-1809.2009.00539.x. [DOI] [PMC free article] [PubMed] [Google Scholar]
- 17.Chi E.C., Zhou H., Chen G.K., Ortega Del Vecchyo D., Lange K.L. Genotype imputation via matrix completion. Genome Res. 2013;23:509–518. doi: 10.1101/gr.145821.112. [DOI] [PMC free article] [PubMed] [Google Scholar]
- 18.Purcell S., Neale B., Todd-Brown K., Thomas L., Ferreira M.A., Bender D., Maller J., Sklar P., de Bakker P.I., Daly M.J., et al. PLINK: a tool set for whole-genome association and population-based linkage analyses. Am. J. Hum. Genet. 2007;81:559–575. doi: 10.1086/519795. [DOI] [PMC free article] [PubMed] [Google Scholar]
- 19.Vannahme C., Smyth N., Miosge N., Gosling S., Frie C., Paulsson M., Maurer P., Hartmann U. Characterization of SMOC-1, a novel modular calcium-binding protein in basement membranes. J. Biol. Chem. 2002;277:37977–37986. doi: 10.1074/jbc.M203830200. [DOI] [PubMed] [Google Scholar]
- 20.Choi Y.A., Lim J., Kim K.M., Acharya B., Cho J.Y., Bae Y.C., Shin H.I., Kim S.Y., Park E.K. Secretome analysis of human BMSCs and identification of SMOC1 as an important ECM protein in osteoblast differentiation. J. Proteome Res. 2010;9:2946–2956. doi: 10.1021/pr901110q. [DOI] [PubMed] [Google Scholar]
- 21.Okada I., Hamanoue H., Terada K., Tohma T., Megarbane A., Chouery E., Abou-Ghoch J., Jalkh N., Cogulu O., Ozkinay F., et al. SMOC1 is essential for ocular and limb development in humans and mice. Am. J. Hum. Genet. 2011;88:30–41. doi: 10.1016/j.ajhg.2010.11.012. [DOI] [PMC free article] [PubMed] [Google Scholar]
- 22.Thorleifsson G., Holm H., Edvardsson V., Walters G.B., Styrkarsdottir U., Gudbjartsson D.F., Sulem P., Halldorsson B.V., de Vegt F., d'Ancona F.C., et al. Sequence variants in the CLDN14 gene associate with kidney stones and bone mineral density. Nat. Genet. 2009;41:926–930. doi: 10.1038/ng.404. [DOI] [PubMed] [Google Scholar]
- 23.Lal-Nag M., Morin P.J. The claudins. Genome. Biol. 2009;10:235. doi: 10.1186/gb-2009-10-8-235. [DOI] [PMC free article] [PubMed] [Google Scholar]
- 24.Trueb B., Zhuang L., Taeschler S., Wiedemann M. Characterization of FGFRL1, a novel fibroblast growth factor (FGF) receptor preferentially expressed in skeletal tissues. J. Biol. Chem. 2003;278:33857–33865. doi: 10.1074/jbc.M300281200. [DOI] [PubMed] [Google Scholar]
- 25.Sahni M., Ambrosetti D.C., Mansukhani A., Gertner R., Levy D., Basilico C. FGF signaling inhibits chondrocyte proliferation and regulates bone development through the STAT-1 pathway. Genes. Dev. 1999;13:1361–1366. doi: 10.1101/gad.13.11.1361. [DOI] [PMC free article] [PubMed] [Google Scholar]
- 26.Rieckmann T., Zhuang L., Fluck C.E., Trueb B. Characterization of the first FGFRL1 mutation identified in a craniosynostosis patient. Biochim. Biophys. Acta. 2009;1792:112–121. doi: 10.1016/j.bbadis.2008.11.006. [DOI] [PubMed] [Google Scholar]
- 27.Steinberg F., Zhuang L., Beyeler M., Kalin R.E., Mullis P.E., Brandli A.W., Trueb B. The FGFRL1 receptor is shed from cell membranes, binds fibroblast growth factors (FGFs), and antagonizes FGF signaling in Xenopus embryos. J. Biol. Chem. 2010;285:2193–2202. doi: 10.1074/jbc.M109.058248. [DOI] [PMC free article] [PubMed] [Google Scholar]
- 28.Liu Y.J., Zhang L., Pei Y., Papasian C.J., Deng H.W. On genome-wide association studies and their meta-analyses: lessons learned from osteoporosis studies. J. Clin. Endocrinol. Metab. 2013;98:E1278–E1282. doi: 10.1210/jc.2013-1637. [DOI] [PMC free article] [PubMed] [Google Scholar]
- 29.Pei Y.F., Zhang L., Papasian C.J., Wang Y.P., Deng H.W. On individual genome-wide association studies and their meta-analysis. Hum. Genet. 2013 doi: 10.1007/s00439-013-1366-4. doi:10.1007/s00439-013-1366-4. [DOI] [PMC free article] [PubMed] [Google Scholar]
- 30.Thaler R.H. Anomalies: the winner's curse. J. Econ. Perspect. 1988;2:191–202. [Google Scholar]
- 31.The Women's Health Initiative Study Group. Design of the Women's Health Initiative clinical trial and observational study. The Women's Health Initiative Study Group. Control. Clin. Trials. 1998;19:61–109. doi: 10.1016/s0197-2456(97)00078-0. [DOI] [PubMed] [Google Scholar]
- 32.Peng B., Yu R.K., Dehoff K.L., Amos C.I. Normalizing a large number of quantitative traits using empirical normal quantile transformation. BMC Proc. 2007;1(Suppl. 1):S156. doi: 10.1186/1753-6561-1-s1-s156. [DOI] [PMC free article] [PubMed] [Google Scholar]
- 33.Devlin B., Roeder K. Genomic control for association studies. Biometrics. 1999;55:997–1004. doi: 10.1111/j.0006-341x.1999.00997.x. [DOI] [PubMed] [Google Scholar]
- 34.Willer C.J., Li Y., Abecasis G.R. METAL: fast and efficient meta-analysis of genomewide association scans. Bioinformatics. 2010;26:2190–2191. doi: 10.1093/bioinformatics/btq340. [DOI] [PMC free article] [PubMed] [Google Scholar]
- 35.Higgins J.P., Thompson S.G., Deeks J.J., Altman D.G. Measuring inconsistency in meta-analyses. BMJ. 2003;327:557–560. doi: 10.1136/bmj.327.7414.557. [DOI] [PMC free article] [PubMed] [Google Scholar]
- 36.Estrada K., Abuseiris A., Grosveld F.G., Uitterlinden A.G., Knoch T.A., Rivadeneira F. GRIMP: a web- and grid-based tool for high-speed analysis of large-scale genome-wide association using imputed data. Bioinformatics. 2009;25:2750–2752. doi: 10.1093/bioinformatics/btp497. [DOI] [PMC free article] [PubMed] [Google Scholar]
- 37.Howie B.N., Donnelly P., Marchini J. A flexible and accurate genotype imputation method for the next generation of genome-wide association studies. PLoS Genet. 2009;5:e1000529. doi: 10.1371/journal.pgen.1000529. [DOI] [PMC free article] [PubMed] [Google Scholar]
- 38.Pruim R.J., Welch R.P., Sanna S., Teslovich T.M., Chines P.S., Gliedt T.P., Boehnke M., Abecasis G.R., Willer C.J. LocusZoom: regional visualization of genome-wide association scan results. Bioinformatics. 2010;26:2336–2337. doi: 10.1093/bioinformatics/btq419. [DOI] [PMC free article] [PubMed] [Google Scholar]
- 39.Smyth G.K. Linear models and empirical bayes methods for assessing differential expression in microarray experiments. Stat. Appl. Genet. Mol. Biol. 2004;3:Article3. doi: 10.2202/1544-6115.1027. [DOI] [PubMed] [Google Scholar]
Associated Data
This section collects any data citations, data availability statements, or supplementary materials included in this article.