

Abstract
Simultaneous non-invasive visualization of blood vessels and nerves in patients can be obtained in the eye. The retinal vasculature is a target of many retinopathies. Inflammation, readily manifest by leukocyte adhesion to the endothelial lining, is a key pathophysiological mechanism of many retinopathies, making it a valuable and ubiquitous target for disease research. Leukocyte fluorography has been extensively used in the past twenty years; however, fluorescent markers, visualization techniques, and recording methods have differed between studies. The lack of detailed protocol papers regarding leukocyte fluorography, coupled with lack of uniformity between studies, has led to a paucity of standards for leukocyte transit (velocity, adherence, extravasation) in the retina. Here, we give a detailed description of a convenient method using acridine orange (AO) and a commercially available scanning laser ophthalmoscope (SLO, HRA-OCT Spectralis) to view leukocyte behavior in the mouse retina. Normal mice are compared to mice with acute and chronic inflammation. This method can be readily adopted in many research labs.
1. Introduction
The eye uniquely lends itself to simultaneous non-invasive visualization of blood vessels and nerves in patients. Many retinopathies affect the retinal vasculature, in turn compromising neural function. Inflammation is a key pathophysiological mechanism of many retinopathies, making it a valuable and ubiquitous target for disease research. Leukocyte adherence to the endothelial lining of blood vessels is a key component of inflammation. Leukocyte fluorography has been extensively used in the past twenty years (Janssen et al., 1994; Nishiwaki et al.,1995; Nishiwaki et al., 1996; Iwama et al., 2008; Miyahara et al., 2004); however, fluorescent markers, visualization techniques, and recording methods have differed between studies. To date there have been no detailed protocol papers relating to leukocyte fluorography in mice, resulting in a paucity of standards for leukocyte transit (velocity, adherence, extravasation) in the retina. We describe a convenient method using acridine orange (AO) and a commercially available scanning laser ophthalmoscope (SLO, HRA-OCT Spectralis) to view leukocyte behavior in the mouse retina and demonstrate that leukocyte rolling and adhesion can be visualized in acute and chronic inflammation.
Acridine orange (AO) is a cell permeable metachromatic fluorescent dye that has been widely used to assess apoptotic cells, measure leukocyte adhesion, and quantify vascular flow (as it binds white but not red blood cells) (Janssen et al., 1994). After binding double-stranded DNA, AO emits green fluorescence with spectral properties similar to sodium fluorescein (peak excitation at 502 nm and emission at 522 nm). Although a tried and tested technique, in vivo AO leukocyte fluorography (AOLF) has been predominantly reserved for studies equipped with a customized in-house scanning laser ophthalmoscope on larger rodent models (Barouch et al., 2000; Joussen et al., 2001). Even when AOLF was used with commercially available SLOs, a video monitoring system developed in-house developed was required for recording and analysis. While leukocyte fluorography has been tested in mice, it has either relied on alternative dyes which required removal of leukocytes prior to staining and then reintroducing the leukocytes back into the mouse (Xu et al., 2003), or relied on in house video recording devices that required separate set up (Iwama et al., 2008; Miyahara et al. 2004). This paper presents a method with simple administration of the fluorescent agent (tail vein injection of AO) and a commercially available imaging system (Heidelberg Spectralis) which contains within its software video recording capabilities. Standards for arteriole, capillary, and venule leukocyte velocity are compared to previously reported data as well as mouse models of acute (intravitreal injection of VEGF) and chronic (diabetes > four months) inflammation.
2. Materials and Supplies
2.1 Mice
All animals were treated in accordance with IACUC approval. Three cohorts of mice obtained from Jackson laboratory were used in this study. Male C57Bl6/J mice were compared to Ins2Akita heterozygote male mice (diabetic, >600 mg/dL blood glucose), and C57Bl6/J mice treated with intravitreal injections of VEGF (200 ng/2 uL) to study chronic and acute inflammation, respectively. All mice were aged 20–25 weeks. Mice injected intravitreally with VEGF were observed the following day.
2.2 Scanning Laser Ophthalmoscope
Heidelberg Spectralis: HRA-OCT Spectralis (Heidelberg, Germany) running software version 1.6.4.0 was used with a 488nm argon blue laser with a standard 500nm long-pass filter.
2.3 Anesthetic
Isofluorane a mixture of 3% Isoflurane/O2 mixture in a closed canister at a flow rate of 1.0 Lpm. Anesthesia was maintained with 1.5% isoflurane/O2 mixture at same flow rate.
2.4 Fluorescent agent
Acridine orange was purchased from acros organics Acridine orange (AO (Acros Organics, Geel, Belgium), 0.10%/PBS) and filtered with a 0.22 μm filter.
2.5 Video analysis
Video images acquired by Heidelberg Spectralis were transferred to .avi format using the included software. AVI files were then opened in ImageJ using and analyzed with a plug in developed by Peter Bankhead.
3. Detailed Methods
3.1 Imaging mouse retina
Mice were anesthetized by an initial inhalation of 3% Isoflurane/O2 mixture in a closed canister at a flow rate of 1.0 Lpm. Anesthesia was maintained with 1.5% isoflurane/O2 mixture at same flow rate and mice were placed on a heated water pad (37 degrees Celsius). Pupils were dilated with a 1% tropicamide solution and afterwards hydrated periodically with saline solution to prevent corneal desiccation. Acridine orange (AO (Acros Organics, Geel, Belgium), 0.10%/PBS) was filtered with a 0.22 μm filter. The solution (0.05mL/min for a total of 1 minute) was then injected into the tail vein of mice. Imaging was accomplished using HRA-OCT Spectralis (Heidelberg, Germany) with a 488nm argon blue laser with a standard 500nm long-pass filter. Images were acquired from both eyes with a 55 degree lens while restricting the visual field to a 25 degree digital zoom to visualize an area of 3.3 mm X 3.3 mm. Reducing the visual field shortened the time required to obtain horizontal scans therefore increasing the frame rate. Utilizing the movie mode on the Heidelberg HRA OCT Spectralis, videos were captured at 15.4 frames per second imaging in High Speed mode. Endothelial staining of AO allowed for identification of larger retinal vessels in which leukocytes were manually focused upon. To control for minor eye movements, either induced by the operator or the mouse, video frames were registered after acquisition. Arteries and veins were distinguished by leukocyte transit away from and toward the optic disc, respectively. Arteries and veins, of which there were typically six each, were defined as emanating from the optic nerve. Arterioles were defined as branches coming from the central retinal arteries and leading to capillaries. Capillaries connected the arterioles to the venules, which drained back into the central retinal veins. Images focused on the superior quadrant of the retina between artery, capillary bed, and vein. After acquiring videos, animals were transferred to a recovery heat pad and monitored until regaining full consciousness.
3.2 Analysis of videos
Videos were exported in .avi format from Heidelberg proprietary software and opened in ImageJ software. Relevant leukocytes were determined by those present in at least three frames in the field of view and 3 disc diameters away from the optic disc. At least three leukocytes were tracked in each vessel type (3 per artery/iole, vein/ule, and capillary) in each eye and in each mouse (n= 18). Using a Cell Analyzer Plugin (developed by Peter Bankhead) leukocytes were tracked in consecutive frames. Distances in pixels were calculated and converted using Heidelberg’s automated scaling metadata to microns (1.22 microns/pixel) after adjusting for murine corneal radius of curvature of 1.4mm. Multiplying distance travelled between frames by 15.4 yielded individual velocities and averages were calculated.
Leukocyte engagement and subsequent rolling along the endothelium was also recorded and tracked using the Cell Analyzer Plugin. Rolling leukocytes exhibited much slower transit times and followed the vessel wall. Leukocytes were determined to be rolling if they maintained contact with the vessel wall and could be tracked for greater than 5 consecutive frames (with many exceeding 10 frames).
3.3 In vitro leukocyte rolling
To determine whether acridine orange affected leukocyte-endothelial interaction dynamics we tested human leukocyte rolling over human retinal microvascular endothelial cells (HrMVEC, human primary cells from Cell Systems, Kirkland, WA) in vitro (a system wherein leukocytes are visible without acridine orange labeling). HrMVECs were cultured in parallel-plate fibronectin-coated flow chambers (Ibidi u-slide VI 0.4) until 80% confluent and then exposed to TNF-α (10ng/mL) or vehicle control for three hours to elicit an inflammatory and pro-adhesive response to leukocytes. Leukocytes, obtained from venous whole blood of healthy human donors, were isolated as described previously (Zhu et al., 2012), diluted in warmed ultrasaline (Lonza) to 1 × 10^6/ml and exposed to acridine orange (0.15%) or vehicle control. Leukocyte solution was then pumped through the parallel plate flow chambers using a syringe pump (Harvard Apparatus) at 1 dynes/cm^2 (typical venous shear stress). Leukocyte adhesion and rolling was monitored using differential interference contrast microscopy (DIC). DIC images were acquired at a rate of 1/second for 1 minute and the number of leukocytes adhered or rolling on the endothelial monolayer was quantified as leukocytes/frames/second. At least four independent flow wells were averaged to achieve the reported values (mean +/− SD).
3.4 Results
In C57Bl6/J mice, leukocyte velocity was greatest in the arteries and veins (18.07 +/− 3 mm/sec and 17.7 +/− 2 mm/sec, respectively). Velocity decreased in arterioles and venules (6.9 +/− 1 mm/sec and 8.5 +/− 1.1 mm/sec, respectively) and was slowest in the capillaries (1.7 +/− 0.3 mm/sec). These values were significantly decreased in the Ins2Akita mice and the mice injected with VEGF (Table 1, Figure 1). The number of rolling leukocytes in the venules and veins of normal C57Bl6/J mice averaged 0.3 +/− 0.8 within the field of view (FOV) (3 mm × 3 mm) over a five minute observation period, compared with 13.5 +/− 5.1 in the diabetic Ins2Akita mice and 8 +/− 1.4 in the VEGF-injected mice (Figure 2). Data are shown in Table 1 (mean +/− standard deviation, n= 18 C57Bl6/J mice, 9 Ins2Akita mice, 7 VEGF-injected C57Bl6/J mice).
Table 1.
Leukocyte velocity in C57Bl6/J mice is given in each area of the vascular tree. Leukocyte transit times of diabetic Ins2Akita mice and C57Bl6/J treated with intravitreal injections of VEGF are given as well. Diabetic mice had slower leukocyte velocities in the arterioles, capillaries, venules, and veins (p<0.0001), while VEGF-injected mice experienced slower transit times in the capillaries, only (p<0.001).
| Velocity (mm/sec) | ||||||
|---|---|---|---|---|---|---|
| Artery | Arteriole | Capillary | Venule | Vein | ||
|
|
||||||
| Mouse type | C57Bl6/J | 18.1 +/− 3 | 6.9 +/− 1 | 1.7 +/− 0.4 | 8.5 +/− 1 | 17.7 +/− 2 |
|
| ||||||
| Ins2Akita | 12.8 +/− 1 | 3.7 +/− 0.8 | 0.7 +/− 0.2* | 2.7 +/− 0.5* | 3.6 +/− 0.4* | |
|
| ||||||
| C57Bl6/J + VEGF | 12.5 +/− 1.1 | 7.2 +/− 0.8 | 0.7 +/− 0.1* | 6.4 +/− 1 | 13.7 +/− 1 | |
|
| ||||||
p<0.0001
Figure 1.
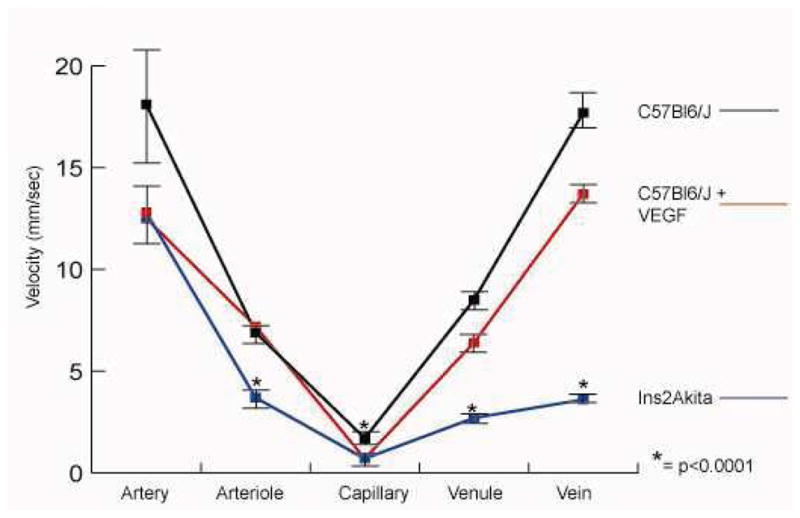
Graph demonstrating leukocyte velocity in each segment of the vascular tree. Leukocyte velocity was slower in diabetic Ins2Akita mice compared to normal mice in all areas except the central retinal arteries. VEGF injection decreased leukocyte transit time in the capillaries.
Figure 2.

The number of rolling leukocytes counted over a five minute observation period following acridine orange administration. Leukocyte rolling was increased in diabetic Ins2Akita mice and mice injected with VEGF.
3.5 Evaluation of extravasated leukocytes
To determine whether leukocytes had left the vasculature and crossed into the retina, static images of the retina were taken 30 minutes after injection of acridine orange. By this time, leukocytes were not visible traveling in the blood vessels (due to the washout effect (Iwama et al., 2008), and leukocytes appeared outside major vessels. The number of leukocytes counted in the still image was taken to represent the number of leukocytes that left the vasculature and extravasated into the retina. 1.48 +/− 1.04 leukocytes migrated out of the vasculature and into the FOV in normal C57Bl6/J mice, as analyzed thirty minutes after AO injection. VEGF injection dramatically increased leukocyte extravasation (13 +/− 6.3 leukocytes). Ins2Akita mice also demonstrated increased leukocyte extravasation (7.1 +/− 3.3 leukocytes). Leukocyte extravasation was confirmed using confocal microscopy to visualize leukocytes (CD11b, BD Biosceinces, San Jose, California) and vessels (isolectin GS-IB4, Life Technologies, Carlsbad, California) on retinal flatmount (Figure 3). It should be noted that confocal microscopic imaging revealed more extravasated leukocytes than could be observed with the ophthalmascope.
Figure 3.

Leukocyte extravasation was seen 30 minutes after acridine orange administration with the scanning laser ophthalmascope and was confirmed with confocal microscopy.
3.6 In vitro leukocyte rolling
While TNF-α increased leukocyte adhesion and rolling in vitro, acridine orange had no effect on leukocyte adhesion or rolling in either the inflammatory (TNF-α +) (36 +/− 5, without acridine orange vs. 31 +/− 6, with acridine orange leukocyte frames/sec) or non-inflammatory (TNF-α −) (4 +/− 1, without acridine orange vs. 3 +/− 1, with acridine orange leukocyte frames/sec) conditions (n=4 wells per condition; p=0.68 between AO + and AO −)(Figure 4). Acridine orange did not affect leukocyte adhesion to the endothelium in the presence or absence of TNF-alpha.
Figure 4.

To determine whether acridine orange altered leukocyte endothelial interactions, human leukocytes were rolled across a human retinal microvascular endothelial cell monolayer at a constant rate. Leukocytes could be visualized under microscope and adhering leukocytes were counted in each frame. Results are shown as leukocyte frames/minute for each condition. While TNF-α increased leukocyte adhesion, acridine orange did not alter leukocyte adhesion in either the presence or absence of TNF-α.
4. Potential Pitfalls and Troubleshooting
4.1 Eye opacity
Visualization became limited after cataracts began to form due to continued anesthesia. This limited visualization for each mouse to a temporal window of 5 minutes. Several methods were employed to reduce cataract formation: 1) mice were placed on a heated waterpad during imaging, 2) moisture of mouse eyes was maintained with periodic drops of phosphate buffered saline and wicked away with a cotton tip applicator to allow for clear visualization, 3) imaging time was limited to 5 minutes maximum. By following these practices, clarity persisted allowing for useful imaging.
4.2 Continuous tail vein injections
To maintain a continuous flow of acridine orange into the mouse we employed use of a butterfly catheter needle (25 gauge) attached to a 1 mL syringe. After the needle was placed into the tail vein (confirmed with low resistance when pressure was applied to the plunger) the needle was taped in place allowing for a small bolus to be applied every 30 seconds. If too many leukocytes were observed in the FOV, making counting and tracking difficult, AO solution could be injected intraperitoneally to dilute the concentration and allow for a slower absorption into the circulation.
4.3 Speed of recording
To increase the frame rate High Speed mode was selected and FOV was narrowed to a 3mm X 3mm area of the retina; this allowed us to record at 15.4 frames/sec.
Discussion
Here we present a detailed description of the established method of following leukocytes in vivo. Leukocytes can be easily visualized and tracked after tail vein injection of acridine orange in mice using a commercially available system (HRA-OCT Spectralis), mitigating the need for custom-built in house video monitoring systems making this technique feasible for many laboratories that already routinely image the mouse retina. By defining the normal parameters of leukocyte behavior in vivo in the mouse retina, this technique establishes baseline characteristics against which leukocyte behavior in inflammatory stress models or therapeutic models can be compared. Previously reported data for average leukocyte velocity in arterioles, venues, and capillaries comes from a study by Xu et al., in Balb/C mice and B10. RIII mice using C-AM labeled leukocytes (Xu et al., 2002). However, results reported here, though slightly slower, are still in alignment with these results despite a different background of mouse and leukocyte fluorescent agent.
There are some limitations to our study that merit future mechanistic investigation and technical enhancements. Higher magnification and resolution would enable assessment of firmly adherent cells. It is possible that some of the “extravasated leukocytes” are en face capillaries, but this is unlikely as we observed carefully for flow within these structures by using different angles of visualization. Extravasated cells retain acridine orange longer than endothelial cells mainly due to the washout effect (Xu et al., 2003). Extravasated cells may be a specific subset of leukocytes and not representative of leukocytes in general. Elucidating this and characterizing the surface markers of extravasated leukocytes would require separating retinal interstitial tissue from retinal vessels, or performing acridine orange leukography in the relatively avascular retina of rabbits. Most importantly, assessing the impact of retinal vascular hyperpermeability on extravasation in models of retinal disease that disrupt the blood-retinal barrier would have the most translational value.
Future studies with this approach could explore in vivo studies of leukocyte dynamics in diabetic retinopathy, retinal vein occlusion, uveitis, or other inflammatory conditions. If dynamic leukocyte behavior was significantly different in these conditions, it would be easy to envision developing a system where imaging these parameters in patients (with a non-toxic leukocyte fluorophore as opposed to acridine orange) could be of diagnostic, prognostic, or disease monitoring value. Tagging leukocytes and endothelial or neural cells with different fluorophores would enable high-resolution imaging of leukocyte interactions with other retinal components with an appropriate multi-spectal imaging system. Further, labeling of leukocytes with long-wavelength fluorophores would theoretically facilitate imaging of leukocyte dynamics in the pigmented choroid. In conclusion, leukocytes can be easily visualized and tracked after tail vein injection of acridine orange in mice using a commercially available system (HRA-OCT Spectralis), bypassing the need for complex in house video monitoring, making this technique feasible for many laboratories that already routinely image the mouse retina.
Supplementary Material
Video of acridine orange leukocyte fluorography from a representative mouse is shown.
Highlights.
We present a detailed protocol for in vivo leukocyte imaging in the mouse retina
This method can be readily adopted without customized software or hardware
Standard retinal leukocyte transit times are established and compared to mouse models of acute and chronic retinal inflammation
Leukocyte engagement with the endothelium can be visualized
Acknowledgments
We thank Bonnie Archer for proofreading the manuscript. We thank Andrew Weyrich, Guy Zimmerman, Robert Campbell for isolating leukocytes. We thank Christopher Gibson and Dean Li for assistance with the leukocyte rolling assay.
Study supported by NEI RO1EY01796-01A1
Footnotes
Publisher's Disclaimer: This is a PDF file of an unedited manuscript that has been accepted for publication. As a service to our customers we are providing this early version of the manuscript. The manuscript will undergo copyediting, typesetting, and review of the resulting proof before it is published in its final citable form. Please note that during the production process errors may be discovered which could affect the content, and all legal disclaimers that apply to the journal pertain.
References
- Barouch FC, Miyamoto K, Allport JR, Fujita K, Bursell SE, Aiello LP, Luscinskas FW, Adamis AP. Integrin-mediated neutrophil adhesion and retinal leukostasis in diabetes. Invest Ophthalmol & Vis Sci. 2000;41:1153–1158. [PubMed] [Google Scholar]
- Iwama D, Miyahara S, Tamura H, Miyamoto K, Hirose F, Yoshimura N. Lack of inducible nitric oxide synthases attenuates leukocyte-endothelial cell interactions in retinal microcirculation. Br J Ophthalmol. 2008;92:694–698. doi: 10.1136/bjo.2007.131151. [DOI] [PMC free article] [PubMed] [Google Scholar]
- Janssen GH, Tangelder GJ, Oude Egbrink MG, Reneman RS. Spontaneous leukocyte rolling in venules in untraumatized skin of conscious and anesthetized animals. Am J Physiol. 1994;267:H1199–204. doi: 10.1152/ajpheart.1994.267.3.H1199. [DOI] [PubMed] [Google Scholar]
- Joussen AM, Murata T, Tsujikawa A, Kirchof B, Bursell SE, Adamis AP. Leukocyte-mediated endothelial cell injury and death in the diabetic retina. The Am J of Path. 2001;158:147–152. doi: 10.1016/S0002-9440(10)63952-1. [DOI] [PMC free article] [PubMed] [Google Scholar]
- Miyahara S, Kiryu J, Miyamoto K, Katuta H, Hirose F, Tamura H, Musashi K, Honda Y, Yoshimura N. In vivo three-dimensional evaluation of leukocyte behavior in retinal microcirculation of mice. Invest Ophthalmol & Vis Sci. 2004;45:4197–4201. doi: 10.1167/iovs.04-0192. [DOI] [PubMed] [Google Scholar]
- Miyamoto K, Hiroshiba N, Tsujikawa A, Ogura Y. In vivo demonstration of increased leukocyte entrapment in retinal microcirculation of diabetic rats. Invest Ophthalmol & Vis Sci. 1998;39:2190–2194. [PubMed] [Google Scholar]
- Nishiwaki H, Ogura Y, Kimura H, Kiryu J, Honda Y. Quantitative evaluation of leukocyte dynamics in retinal microcirculation. Invest Ophthalmol & Vis Sci. 1995;36:123–130. [PubMed] [Google Scholar]
- Nishiwaki H, Ogura Y, Kimura H, Kiryu J, Miyamoto K, Matsuda N. Visualization and quantitative analysis of leukocyte dynamics in retinal microcirculation of rats. Invest Ophthalmol & Vis Sci. 1996;37:1341–1347. [PubMed] [Google Scholar]
- Xu H, Manivannan A, Goatman KA, Liversidge J, Sharp PF, forrester JV, Crane IJ. Improved leukocyte tracking is mouse retinal and choroidal circulation. Exp Eye Res. 2002;74(3):403–410. doi: 10.1006/exer.2001.1134. [DOI] [PubMed] [Google Scholar]
- Xu H, Forrester JV, Liversidge JI, Crane J. Leukocyte trafficking in experimental autoimmune uveitis: breakdown of blood-retinal barrier and upregulation of cellular adhesion molecules. Invest Ophthalmol & Vis Sci. 2003;44:226–234. doi: 10.1167/iovs.01-1202. [DOI] [PubMed] [Google Scholar]
- Zhu W, London NR, Gibson CC, Davis CT, Tong Z, Sorensen LK, Shi DS, Guo J, Smith MCP, Grossman AH, Thomas KR, Li DY. Interleukin receptor activates a MYD88-ARNO-ARF6 cascade to disrupt vascular stability. Nature. 2012;492:252–255. doi: 10.1038/nature11603. [DOI] [PMC free article] [PubMed] [Google Scholar]
Associated Data
This section collects any data citations, data availability statements, or supplementary materials included in this article.
Supplementary Materials
Video of acridine orange leukocyte fluorography from a representative mouse is shown.