

Abstract
X-linked sideroblastic anemia (XLSA) is the most common form of congenital sideroblastic anemia. In affected males, it is uniformly associated with partial loss-of-function missense mutations in the erythroid-specific heme biosynthesis protein 5-aminolevulinate synthase 2 (ALAS2). Here, we report five families with XLSA due to mutations in a GATA transcription factor binding site located in a transcriptional enhancer element in intron 1 of the ALAS2 gene. As such, this study defines a new class of mutations that should be evaluated in patients undergoing genetic testing for a suspected diagnosis of XLSA.
Introduction
The sideroblastic anemias are a heterogeneous group of inherited and acquired hematological disorders characterized by the presence of ring sideroblasts—erythroblasts containing pathological mitochondrial iron deposits—in the bone marrow. The inherited or congenital sideroblastic anemias (CSAs) are uncommon diseases, typically characterized by germline genetic mutations leading to defects in mitochondrial heme synthesis, iron-sulfur cluster metabolism, or protein synthesis (reviewed in reference (1)). Currently, nearly 60% of CSAs can be attributed to a mutation in a specific nuclear-encoded gene or mitochondrial DNA deletion (2). Two-thirds or more of all genetically explained cases are due to mutations in 5-aminolevulate synthase 2 (ALAS2), the erythroid-specific isoform of the first, and rate-limiting, enzymein heme biosynthesis, located on the X chromosome. Mutations in ALAS2 lead to a hypochromic, microcytic CSA that occurs most commonly in males, and is commonly referred to as X-linked sideroblastic anemia (XLSA). All experimentally validated ALAS2 mutations described thus far in male probands are missense mutations, most often in domains important for catalysis or pyridoxal phosphate (vitamin B6) co-factor binding. In many cases, the anemia is responsive to high dose dietary supplementation with pyridoxine, which stabilizes or otherwise promotes the activity of the mutant protein (3). Females develop anemia in the setting of acquired unfavorably skewed X chromosome inactivation, and, unlike males, may have predicted null mutations that prematurely truncate the protein (4). Clinically unaffected heterozygous carrier females may have a frankly bimodal red cell size distribution, but, more often, have subtle laboratory and morphological red blood cell (RBC) abnormalities such as an increased RBC distribution width (RDW) and occasional hypochromic microcytic RBCs or siderocytes on the peripheral blood smear. In some cases, they may have no morphological abnormalities whatsoever.
Methods
Probands in each family were ascertained based on evaluation of clinical and pathological features, including a bone marrow aspiration showing ringed sideroblasts. Patient and family member samples for investigational studies were obtained with informed consent. Peripheral blood genomic DNA was used for all analyses. Except as noted, all genomic coordinates refer to the human genome sequence alignment release 19 (GRCh37/hg19) and were accessed using the UCSC Genome Browser (http://genome.ucsc.edu/) (5). Genotyping was performed with Affymetrix 6.0 SNP chips in families A, F, and P using standard protocols. These three families are a subset of ∼300 typed individuals in a collaborative CSA database (MMH, DRC, AM, CK, BG, CN, DWS, SSB, and MDF, unpublished) maintained at Boston Children's Hospital, and analyzed using a custom build, rule based pipeline that integrates copy number variation (CNV) and family linkage with population level homozygosity and allele sharing. A detailed description of the software will be published elsewhere, (Schmitz-Abe, et al, unpublished). We delineated the minimal 17.3 Mb interval on chromosome X shared between the three American families (A, F, & P) using this pipeline and a 98% allelic identity threshold for pairs of individuals. In addition to CNV analysis based on Affymetrix 6.0 typing, we tested a subset of samples for small deletions using a custom Nimblgen 720k array covering chrX: 50,040,914-79,999,613 (hg18), with a median probe density of 50 bp. Data analysis was performed using Nimblescan 2.6. Bidirectional Sanger sequencing of patient genomic DNA was performed on samples amplified by PCR using the primers described in Supplementary Table 1. For quantitative RT-PCR, total erythrocyte RNA was prepared from heparinized blood (6). RNA was treated with DNase I (Roche) to remove contaminating genomic DNA. cDNA was synthesized using the iScript™ cDNA Synthesis Kit (Bio Rad) according to the manufacturer's protocol. Real-time PCR quantification of ALAS2 (7) and AHSP (8) mRNA transcript levels were performed as described previously (9). X-inactivation was performed using the HUMARA assay (10). In Table 1, in carrier females, the relative “activation” of the mutant allele compared to the wild type allele is expressed as a fraction. A ratio of 1 indicates that there is equal activation of both alleles, whereas ratios >1 indicate that the X chromosome carrying the mutant ALAS2 is more active than the wild type X chromosome (and vice versa).
Table 1.
Hematological and genetic characteristics of families with ALAS2 intron 1 GATA binding site mutations.
| Individual | Sex | Age at evaluation |
Affected Status |
Genotype ChrX (GRCh37): |
Hb (g/dl) |
MCV (fl) |
RDW (%CV)¶ |
X-activation ratio* |
Blood smear | Pyridoxine response |
Transfused | Iron Overload |
Comment |
|---|---|---|---|---|---|---|---|---|---|---|---|---|---|
| N-IV-2 | F | 52 | No | g.55054634 G/C | 13.2 | 93 | 15.8 | 0.8 | normal | NA | NA | No | |
| N-IV-3 | F | 55 | Yes | g.55054634 G/C | 13.1 | 112 | 22.3 | NI | few macrocytes | unknown | NA | Severe | Phlebotomized |
| N-IV-4 | F | 59 | No | g.55054634 G/G | 12.6 | 90 | 10.9 | NI | normal | NA | NA | No | |
| N-IV-5 | M | 63 | No | g.55054634 C/Y | 14.3 | 92 | 11.5 | NA | few poikilocytes | NA | NA | No | |
| N-IV-6 | M | 65 | Yes | g.55054634 C/Y | 12.4 | 80 | 15.8 | NA | few poikilocytes | Yes& | No | Mild | |
| N-IV-8 | M | 66 | Yes | g.55054634 C/Y | 9.8 | 84 | 21.4 | NA | few hypochromic microcytes and elliptocytes | minimal | Yes | Severe | HCC, Chelated |
| N-IV-9 | M | 67 | Yes | g.55054634 C/Y | 13.2 | 95 | 19.2 | NA | few microcytes, macrocytes, and stomatocytes | minimal | No | Mild | Phlebotomized |
| N-V-1 | M | 25 | Yes | g.55054634 C/Y | 9.7 | 74 | 26.2 | NA | few target cells and teardrop cells | minimal | Yes | Moderate | Chelated |
| N-V-2 | F | 35 | No | g.55054634 G/C | 12.2 | 84 | 16.9 | 3.3 | few macrocytes, microcytes, poikilocytes | NA | NA | No | |
|
| |||||||||||||
| A-III-1 | M | 16 | Yes | ND | ND | ND | ND | NA | ND | unknown | unknown | unknown | Died of anemia age 16 |
| A-III-2 | F | 80 | No | g.55054635 A/A | 14.6 | 84 | 13.8 | 0.7* | normal | NA | NA | ||
| A-III-3 | F | 70s | No | g.55054635 A/G | 13.4 | 88 | 14.2 | 0.3 | rare hypochromic microcytes | NA | NA | ||
| A-III-4 | F | 73 | No | g.55054635 A/G | 13.0 | 83 | 18.0 | 3.4 | few hypochromic microcytes, rare siderocytes | NA | NA | ||
| A-III-6 | F | 62 | No | g.55054635 A/A | 14.3 | 96 | 12.2 | 1.0* | normal | NA | NA | ||
| A-IV-1 | M | 21 | Yes | ND | ND | ND | ND | NA | ND | unknown | Yes | Severe | Died of anemia age 21 |
| A-IV-3 | F | 44 | No | g.55054635 A/G | 12.8 | 86 | 16.0 | NI | few hypochromic microcytes and rare siderocytes | NA | NA | ||
| A-V-1 | F | 28 | No | g.55054635 A/G | 13.9 | 83 | 13.6 | 0.5 | few hypochromic microcytes and rare siderocytes | NA | NA | ||
| A-V-2 | F | 26 | No | g.55054635 A/G | 13.9 | 94 | 13.1 | NI | rare siderocytes | NA | NA | ||
| A-V-3 | M | 18 | Yes | g.55054635 G/Y | 6.2 | 68 | 33.5 | NA | marked hypochromia, microcytosis, and anisopoikilocytosis | minimal | No | moderate | Chelated |
|
| |||||||||||||
| F-I-1 | F | 93 | No | g.55054635 A/G | 10.0 | 85 | 20.4 | 2.5 | few hypochromic microcytes, slight anisopoikilocytosis, and rare siderocytes | unknown | No | ||
| F-II-1 | F | 68 | No | g.55054635 A/G | 11.1† | 78 | 17.9 | NI | few hypochromic microcytes and rare siderocytes | partial | No | ||
| F-III-1 | M | 41 | Yes | g.55054635 G/Y | 8.6 | 67 | 33.6 | NA | marked hypochromia, microcytosis, occasional siderocytes | No | Yes | Severe | Chelated |
| F-III-2 | M | 38 | Yes | g.55054635 G/Y | 8.8 | 84 | 31.0 | NA | marked anisopoikilocytosis and hypochromia, numerous burr cells and occasional Howell-Jolly bodies | No | Yes | Severe | Splenectomy, died of pulmonary embolism |
| F-III-3 | F | No | g.55054635 A/G | NML& | NML& | NML& | NI | ND | NA | NA | |||
|
| |||||||||||||
| C-I-1 | F | 67 | No | ND | 13.3 | 91.6 | 13.1 | ND | normal | NA | NA | ||
| C-II-1 | M | 41 | Yes | g.55054636 C/Y | 13.0 | 79 | 17.7 | NA | few hypochromic microcytes and elliptocytes | minimal | No | Moderate | Phlebotomized, HFE C282Y/+ |
| C-II-2 | M | 35 | Yes | g.55054636 C/Y | 12.0 | 81 | 18.7 | NA | few hypochromic microcytes, elliptocytes, and siderocytes | minimal | No | Moderate | Phlebotomized, HFE C282Y/+ |
|
| |||||||||||||
| P-II-1 | M | 39 | ? Yes | ND | ND | low& | ND | ND | ND | NA | No | ||
| P-II-2 | M | 34 | Yes | g.55054635 G/Y | 8.0 | 77 | 19.2 | NA | moderate hypochromia | minimal | No | Moderate | Phlebotomized |
NA= not applicable, ND = not determined, NML=normal, HCC=hepatocellular carcinoma, NI=locus not informative for HUMARA X-inactivation assay.
RDW reference range = 10.5-13.5% CV,
Expressed as ratio of active mutant:wild type X chromosomes in carrier females or two wild type alleles in non-carrier females.
Quantitative data not available,
On pyridoxine supplementation. Baseline Hb reported to be ∼9 g/dl.
Results and Discussion
We ascertained five families of Northern European descent—three American, one Dutch and one British—in which affected male probands had hypochromic, microcytic CSA that was in several cases minimally or partially responsive to pyridoxine supplementation (Figure 1A and Table 1). In three pedigrees (Figure 1A, A, F, & N) there was strong evidence of X linkage by the presence of multiple affected males distantly related through the maternal lineage and/or multiple generations of females, but not males, with hematological features consistent with XLSA carrier status. In one family, a female sibling (N-IV-3) of three affected brothers was found to have iron overload and clinically significant hematologic abnormalities upon family screening. In this individual, the HUMARA X-inactivation assay was not informative, however the degree of hematological abnormality, particularly the RDW, tended to be greater in those females in this and all other families with X-inactivation skewed toward the mutated X chromosome. Male probands did not have mutations in the exons and intronexon boundaries of ALAS2 or GLRX5 (all families) or SLC25A38 (families A, F, P, and N) (11, 12). In two families (Figure 1A, Families A & F), deletions greater than ∼250 base pairs were excluded using Affymetrix 6.0 SNP genotypes and a custom genomic tiling array spanning the entire ALAS2 locus to the nearest flanking genes. Comparison of the SNP haplotypes on the X chromosome in the three American families (A, F, & P), however, demonstrated partially overlapping blocks of allelic identity in the vicinity of the ALAS2 locus: the minimally shared region spanned a distance of 17.3 Mb (hg 18, Chr. X: 44,922,272-72,277,688), including the entire ALAS2 locus, and segregated with the phenotype and presumptive female carrier state in the two families (A & F) in which multiple relatives were available. Portions of this haplotype were not present in 134 other males with CSA and their male family members, suggesting that this was not an unusually common haplotype and that these three families were ancestrally related. Although none of these individuals had cerebellar ataxia or other syndromic features, mutations in the mitochondrial ATP binding cassette transporter ABCB7, responsible for X-linked sideroblastic anemia with ataxia (XLSA/A) (13), and located 2 Mb distal to the minimally conserved haplotype, were also excluded by sequencing PCR-amplified exons. Likewise, Family N had no ABCB7 mutations detected by sequencing
Figure 1. XLSA pedigrees with GATA binding site mutations.
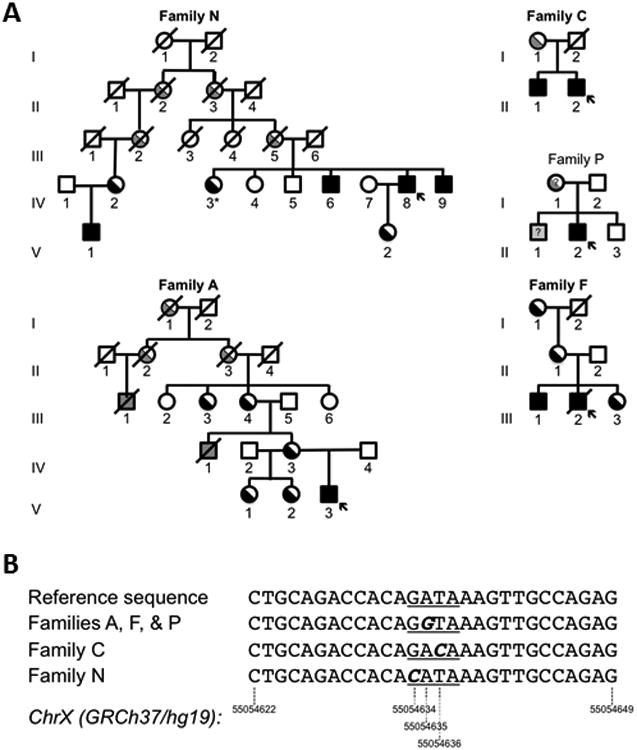
A. Families A, F, and P are from the United States, N from the Netherlands, and C from Great Britain. The genotype or affected status of individuals studied are indicated by black shading. Individuals with inferred genotypes or phenotypes are shaded gray. An arrow indicates the proband in each family. *Indicates a clinically affected heterozygous female. B. Sequence shown is on the positive strand of the GRCh37/hg19 reference sequence: Chr X:55054622-55054649. This corresponds to g.7849 to g.7876 in the ALAS2 genomic sequence in the reverse orientation. The GATA binding site is underlined. The mutation in each family is in bold italics.
These data strongly suggested that the phenotype could be attributed to a mutation closely linked to ALAS2, if not a regulatory or other non-coding or splicing mutation affecting ALAS2 expression itself. To this end, in probands from all five families, we examined previously described and putative regulatory elements that promote erythroid ALAS2 expression, including: ∼2.6 kilobases (kb) of sequence immediately upstream of the transcriptional start site (TSS), containing the putative promoter (14), as well as two regions (chrX:55,083,769-55,085,031 and chrX:55,142,627-55,148,312) located ∼25 and ∼85 kb upstream of the TSS with extensive histone H3 lysine 27 acetylation (H3K27Ac) in K562 human erythroleukemia cells (15). We also sequenced a previously defined enhancer element in intron 8 (16) in these five individuals, as well as 68 other genetically undefined CSA probands. In each case, analysis revealed nothing other than common variants or rare, unique variants that did not cluster or occur within evolutionarily conserved sequences. The complete sequence of ALAS2 intron 1 in families A and F, however, which also has extensive H3K27Ac modification in K562 cells (15), revealed a A>G transition at chromosomal position X: 55054635 [ChrX(GRCh37/hg19):g.55054635A>G, NM_000032.4:c.-15-2187T>C], as shown in Figure 1B. Analysis of this locus in the remaining three index families demonstrated, novel variants in adjacent nucleotides in Families C [ChrX(GRCh37/hg19):g.55054636 T>C; NM_000032.4:c.-15-2188A>G) and N (ChrX(GRCh37/hg19):g.55054634G>C; NM_000032.4:c.-15-2186C>G), and, as expected, the same g.55054635A>G variant in Family P. These variants all fall in the core GATA sequence element of a phylogenetically conserved GATA family transcription factor binding site (consensus sequence: [A/G]GATA[A/G]). Variants in this sequence were not present in 95 other unexplained CSA probands (including the 68 sequenced for intron 8 variants) having a wide variety of syndromic and non-syndromic features (2) or in 69 whole genomes (KS-A and KM, unpublished).
The potential importance of such GATA binding sites in hematological diseases is illustrated by the existence mutations in GATA binding sites in occasional patients with pyruvate kinase deficiency (17), as well as mutations in GATA1 and GATA2 themselves in familial erythroid, megakaryocytic, and hematopoietic syndromes (18-20). Previous studies by Wang et al. demonstrated that this particular ALAS2 intron 1 sequence element displays strong enhancer activity both in transiently transfected K562 cells as well as a stably targeted K562 reporter assay cell line induced to differentiate along the erythroid lineage (21). When mutated, this sequence is unable to promote transcription of the reporter, confirming its functional significance. Furthermore, as assessed by chromatin immunoprecipitation, binding to this site in GATA1-ER cells is strongly induced by treatment with estradiol, which regulates translocation of GATA1 protein linked to the estrogen receptor regulatory domain in this cell line, promoting terminal differentiation and marked up-regulation of Alas2 gene expression. More recent, systematic chromatin immunoprecipitation experiments indicate that this element and adjacent sequences, are occupied by GATA1 and TAL1 proteins (15), whose co-localization is strongly associated with active erythroid promoter and enhancer elements (22). Lastly, in vitro selection of GATA binding sites demonstrates a near absolute requirement for the first three nucleotides—G, A, and T—in the GATA binding site core, each of which is mutated in at least one of the families we studied, for binding to GATA1, GATA2, and GATA3 proteins (23, 24). Site-directed mutagenesis of other naturally occurring GATA binding sites, likewise indicates that these three nucleotides are critical for complex formation, whereas the fourth nucleotide, is less important. In fact, Plumb et al. compared the relative affinities of consensus GATA binding elements to precisely the same nucleotide variants present in Families A, F, and P and C and found that these mutant oligonucleotides were <4000 and <3000-fold, respectively, less-efficient at competing the consensus probe in electrophoretic mobility shift assays (EMSAs) using mouse erythroleukemia (MEL) cell nuclear extracts (25).
In order to determine if the mutations affected ALAS2 mRNA abundance, we performed quantitative PCR using RNA isolated from patient and control peripheral blood RBC samples. As shown in Figure 2, ALAS2 mRNA levels normalized to the erythroid-specific α-globin stabilizing protein, AHSP, showed that there was substantially less ALAS2 mRNA in patient P-II-2 than in control individuals, patients with CSA due to mutations in SLC25A38, and all but one XLSA patient with a missense mutation in ALAS2. Although limited to this single patient, the findings support the interpretation that mutations in this GATA element can result in decreased ALAS2 mRNA expression.
Figure 2. ALASS mRNA expression in GATA binding site mutated patients.
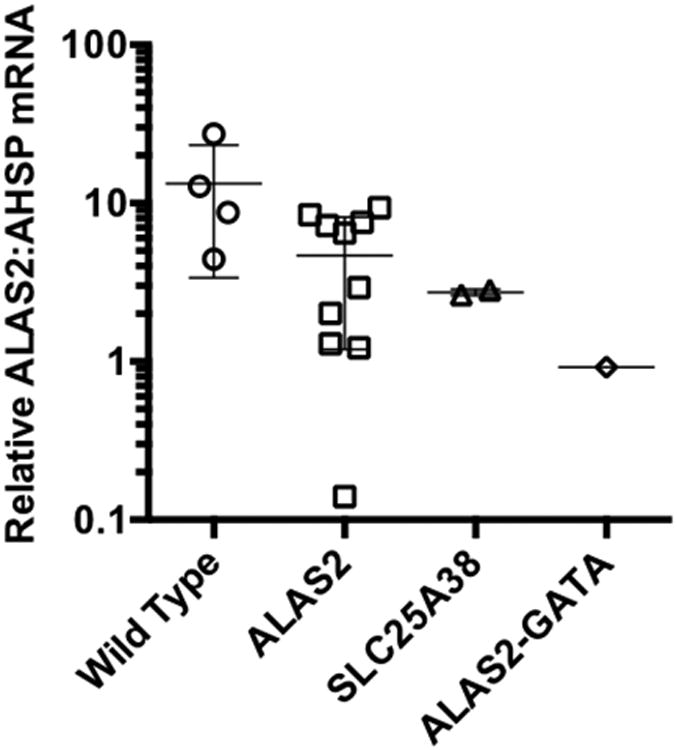
Peripheral blood erythrocyte ALAS2 mRNA normalized to alpha hemoglogin stabilizing protein (AHSP) mRNA levels are shown in wild type control and patients with ALAS2 missense (ALAS2), SLC25A38, and ALAS2-GATA biding site mutations. Whisker plots indicate the mean ± one standard deviation. Data were qualitatively similar when ALAS2 levels were normalized to AHSP, β-actin, or SLC4A1 mRNAs.
Our findings strongly indicate that the conserved GATA element is an erythroid enhancer and that the patient-associated alleles are functionally significant mutations due to interruption of GATA1 binding. It is not possible to make definitive genotype-phenotype correlations, as even within a family (e.g. Family N) there is a great deal of phenotypic variability, suggesting a variety of modifying factors, both genetic and otherwise.
During the course of this work, we became aware of a similar study by Kaneko et al. (26), who confirmed the presence of a functional GATA binding site-dependent erythroid enhancer element in intron 1 of ALAS2, using an approach entirely independent of that previously published (21). Therein, they also describe mutations in the enhancer in three Japanese male probands with hypochromic, microcytic CSA; one of these was from an extended pedigree demonstrating apparent X-linkage. One mutation, 55054635 A>G, present in two of the probands is identical to that found in families A, F, and P and the other is a 37 base pair deletion that encompasses the entire GATA binding site. They confirm that the former mutation, in concordance with the findings of Wang et al. (21), as well as the novel deletion, abrogates DNA binding in EMSAs and that both mutations substantially diminish erythroid-specific enhancer activity. Lastly, similar to our observation, they show a decrease in ALAS2 expression in primary cells from one patient.
Taken together, these genetic and functional data strongly support the conclusion that mutations in an enhancer element in ALAS2 intron 1 that contains a GATA binding site result in a clinical phenotype similar to patients with XLSA due to mutations in the ALAS2 coding sequence itself. In our own survey of >125 probands with CSA (reference (2) and data not shown), ALAS2 intron 1 enhancer element mutations constitute ∼3% of all probands and ∼5% of cases of XLSA. For this reason, we suggest that ALAS2 intron 1 GATA binding site variants be excluded in males with hypochromic, microcytic, non-syndromic sideroblastic anemias lacking coding mutations in ALAS2 or biallelic coding or splicing variants in SLC25A38, particularly those with clinical or laboratory evidence of X-linkage or a minimal, but discernable, response to pyridoxine therapy.
Supplementary Material
Acknowledgments
This work was supported by NIH R01 DK087992 to MDF, grants from the US Department of Veterans Affairs and the Oklahoma Center for Advancement of Science and Technology to SSB, and a grant from the Quality Foundation Funds Medical Specialists (SKMS) of the Netherlands Association of Medical Specialists (OMS) to DWS (project 7387043 “Anemia due to inherited disorders of iron metabolism.”
We thank Edwin Kaauwen for genotyping Family N
The authors would like to thank the patients and family members for their patience and support.
Footnotes
Author contributions: MDF supervised all aspects of the project, including analysis of Families A, F, and P, designed genomic SNP, CNV, and sequence analyses and wrote the manuscript.
DRC designed, performed, analyzed, and annotated sequence analysis on Families A, F, and P and designed, performed, analyzed most of the supporting sequence data in the coding regions of ALAS2, SLC25A38, ABCB7 and GLRX5 in probands in the Boston Children's Hospital cohort.
KS-A designed and constructed SNP pipeline (Variant Explorer) and performed SNP and CNV analyses.
PJS performed quantitative PCR analysis of ALAS2 mRNA.
MMH coordinated human subjects research protocols, CSA sample collection, and database management at Boston Children's Hospital.
AS performed X-inactivation studies in Families A and F
KS-A analyzed and SNP, CNV, and sequence analyses.
KM supervised SNP and CNV analyses and edited the manuscript.
SSB ascertained, clinically phenotyped families A, F, and P, and edited the manuscript.
DWS coordinated and supervised sequence and phenotypic analysis of Family N and edited the manuscript.
RvW supervised phenotypic analysis of Family N and edited the manuscript.
CIdB, RAR and NVAMK ascertained and clinically phenotyped Family N.
HIJ performed X-chromosome inactivation assays on Family N
AM and MS performed sequence and hematological phenotypic analyses of Family C and edited the manuscript.
GM and SS ascertained and clinically phenotyped Family C.
CK phenotyped patients and contributed DNA samples for genetic analysis and edited the manuscript.
BG and CMN phenotyped patients and contributed DNA samples for genetic analysis.
References
- 1.Fleming MD. Congenital sideroblastic anemias: iron and heme lost in mitochondrial translation. Hematology Am Soc Hematol Educ Program. 2011;2011:525–31. doi: 10.1182/asheducation-2011.1.525. [DOI] [PubMed] [Google Scholar]
- 2.Bergmann AK, Campagna DR, McLoughlin EM, Agarwal S, Fleming MD, Bottomley SS, et al. Systematic molecular genetic analysis of congenital sideroblastic anemia: evidence for genetic heterogeneity and identification of novel mutations. Pediatr Blood Cancer. 2010 Feb;54(2):273–8. doi: 10.1002/pbc.22244. [DOI] [PMC free article] [PubMed] [Google Scholar]
- 3.Astner I, Schulze JO, van den Heuvel J, Jahn D, Schubert WD, Heinz DW. Crystal structure of 5-aminolevulinate synthase, the first enzyme of heme biosynthesis, and its link to XLSA in humans. Embo J. 2005 Sep 21;24(18):3166–77. doi: 10.1038/sj.emboj.7600792. [DOI] [PMC free article] [PubMed] [Google Scholar]
- 4.Aivado M, Gattermann N, Bottomley S. X chromosome inactivation ratios in female carriers of X-linked sideroblastic anemia. Blood. 2001 Jun 15;97(12):4000–2. doi: 10.1182/blood.v97.12.4000. [DOI] [PubMed] [Google Scholar]
- 5.Meyer LR, Zweig AS, Hinrichs AS, Karolchik D, Kuhn RM, Wong M, et al. The UCSC Genome Browser database: extensions and updates 2013. Nucleic Acids Res. 2013 Jan;41(Database issue):D64–9. doi: 10.1093/nar/gks1048. [DOI] [PMC free article] [PubMed] [Google Scholar]
- 6.Goossens M, Kan YY. DNA analysis in the diagnosis of hemoglobin disorders. Methods Enzymol. 1981;76:805–17. doi: 10.1016/0076-6879(81)76159-7. [DOI] [PubMed] [Google Scholar]
- 7.Wang X, Spandidos A, Wang H, Seed B. PrimerBank: a PCR primer database for quantitative gene expression analysis, 2012 update. Nucleic Acids Res. 2012 Jan;40(Database issue):D1144–9. doi: 10.1093/nar/gkr1013. [DOI] [PMC free article] [PubMed] [Google Scholar]
- 8.Silver N, Best S, Jiang J, Thein SL. Selection of housekeeping genes for gene expression studies in human reticulocytes using real-time PCR. BMC Mol Biol. 2006;7:33. doi: 10.1186/1471-2199-7-33. [DOI] [PMC free article] [PubMed] [Google Scholar]
- 9.Schmidt PJ, Toran PT, Giannetti AM, Bjorkman PJ, Andrews NC. The transferrin receptor modulates Hfe-dependent regulation of hepcidin expression. Cell Metab. 2008 Mar;7(3):205–14. doi: 10.1016/j.cmet.2007.11.016. [DOI] [PMC free article] [PubMed] [Google Scholar]
- 10.Thoui MM, Giron JM, Hoffman EP. Detection of Nonrandom X Chromosome Inactivation. In: Dracapoli NC, Haines JL, Korf BR, Moir DT, Morton CC, Seidman CE, et al., editors. Current Protocols in Human Genetics Online. John Wiley & Sons; 2003. [DOI] [PubMed] [Google Scholar]
- 11.Guernsey DL, Jiang H, Campagna DR, Evans SC, Ferguson M, Kellogg MD, et al. Mutations in mitochondrial carrier family gene SLC25A38 cause nonsyndromic autosomal recessive congenital sideroblastic anemia. Nat Genet. 2009 Jun;41(6):651–3. doi: 10.1038/ng.359. [DOI] [PubMed] [Google Scholar]
- 12.Camaschella C, Campanella A, De Falco L, Boschetto L, Merlini R, Silvestri L, et al. The human counterpart of zebrafish shiraz shows sideroblastic-like microcytic anemia and iron overload. Blood. 2007 Aug 15;110(4):1353–8. doi: 10.1182/blood-2007-02-072520. [DOI] [PubMed] [Google Scholar]
- 13.Allikmets R, Raskind WH, Hutchinson A, Schueck ND, Dean M, Koeller DM. Mutation of a putative mitochondrial iron transporter gene (ABC7) in X- linked sideroblastic anemia and ataxia (XLSA/A) Human molecular genetics. 1999;8(5):743–9. doi: 10.1093/hmg/8.5.743. [DOI] [PubMed] [Google Scholar]
- 14.Surinya KH, Cox TC, May BK. Transcriptional regulation of the human erythroid 5-aminolevulinate synthase gene. Identification of promoter elements and role of regulatory proteins. The Journal of Biological Chemistry. 1997 Oct 17;272(42):26585–94. doi: 10.1074/jbc.272.42.26585. [DOI] [PubMed] [Google Scholar]
- 15.Bernstein BE, Birney E, Dunham I, Green ED, Gunter C, Snyder M. An integrated encyclopedia of DNA elements in the human genome. Nature. 2012 Sep 6;489(7414):57–74. doi: 10.1038/nature11247. [DOI] [PMC free article] [PubMed] [Google Scholar]
- 16.Surinya KH, Cox TC, May BK. Identification and characterization of a conserved erythroid-specific enhancer located in intron 8 of the human 5-aminolevulinate synthase 2 gene. The Journal of biological chemistry. 1998 Jul 3;273(27):16798–809. doi: 10.1074/jbc.273.27.16798. [DOI] [PubMed] [Google Scholar]
- 17.Manco L, Ribeiro ML, Maximo V, Almeida H, Costa A, Freitas O, et al. A new PKLR gene mutation in the R-type promoter region affects the gene transcription causing pyruvate kinase deficiency. Br J Haematol. 2000 Sep;110(4):993–7. doi: 10.1046/j.1365-2141.2000.02283.x. [DOI] [PubMed] [Google Scholar]
- 18.Millikan PD, Balamohan SM, Raskind WH, Kacena MA. Inherited thrombocytopenia due to GATA-1 mutations. Semin Thromb Hemost. 2011 Sep;37(6):682–9. doi: 10.1055/s-0031-1291378. [DOI] [PubMed] [Google Scholar]
- 19.Sankaran VG, Ghazvinian R, Do R, Thiru P, Vergilio JA, Beggs AH, et al. Exome sequencing identifies GATA1 mutations resulting in Diamond-Blackfan anemia. The Journal of clinical investigation. 2012 Jul 2;122(7):2439–43. doi: 10.1172/JCI63597. [DOI] [PMC free article] [PubMed] [Google Scholar]
- 20.Hahn CN, Chong CE, Carmichael CL, Wilkins EJ, Brautigan PJ, Li XC, et al. Heritable GATA2 mutations associated with familial myelodysplastic syndrome and acute myeloid leukemia. Nat Genet. 2011 Oct;43(10):1012–7. doi: 10.1038/ng.913. [DOI] [PMC free article] [PubMed] [Google Scholar]
- 21.Wang H, Zhang Y, Cheng Y, Zhou Y, King DC, Taylor J, et al. Experimental validation of predicted mammalian erythroid cis-regulatory modules. Genome Research. 2006;16:1480–92. doi: 10.1101/gr.5353806. [DOI] [PMC free article] [PubMed] [Google Scholar]
- 22.Su MY, Steiner LA, Bogardus H, Mishra T, Schulz VP, Hardison RC, et al. Identification of biologically relevant enhancers in human erythroid cells. The Journal of biological chemistry. 2013 Mar 22;288(12):8433–44. doi: 10.1074/jbc.M112.413260. [DOI] [PMC free article] [PubMed] [Google Scholar]
- 23.Ko LJ, Engel JD. DNA-binding specificities of the GATA transcription factor family. Mol Cell Biol. 1993 Jul;13(7):4011–22. doi: 10.1128/mcb.13.7.4011. [DOI] [PMC free article] [PubMed] [Google Scholar]
- 24.Merika M, Orkin SH. DNA-binding specificity of GATA family transcription factors. Mol Cell Biol. 1993 Jul;13(7):3999–4010. doi: 10.1128/mcb.13.7.3999. [DOI] [PMC free article] [PubMed] [Google Scholar]
- 25.Plumb M, Frampton J, Wainwright H, Walker M, Macleod K, Goodwin G, et al. GATAAG; a cis-control region binding an erythroid-specific nuclear factor with a role in globin and non-globin gene expression. Nucleic Acids Res. 1989 Jan 11;17(1):73–92. doi: 10.1093/nar/17.1.73. [DOI] [PMC free article] [PubMed] [Google Scholar]
- 26.Kaneko K, Furuyama K, Fujiwara T, Kobayashi R, Ishida H, Harigae H, et al. Identification of the novel erythroid-specific enhancer for ALAS2 gene and its loss-of-function mutation associated with congenital sideroblastic anemia. Haematologica. 2013 doi: 10.3324/haematol.2013.085449. in press. [DOI] [PMC free article] [PubMed] [Google Scholar]
Associated Data
This section collects any data citations, data availability statements, or supplementary materials included in this article.