Abstract
The incidence of chronic myeloid leukemia (CML), which is caused by BCR/ABL chimeric oncogene formation in a pluripotent hematopoietic stem cell (HSC), increases with age and exposure to ionizing radiation. CML is a comparatively well-characterized neoplasm, important for its own sake and useful for insights into other neoplasms. Here, Surveillance, Epidemiology and End Results (SEER) CML data are analyzed after considering possible misclassification of chronic myelo-monocytic leukemia as CML. For people older than 25 years, plots of male and female CML log incidences versus age at diagnosis are approximately parallel straight lines with males either above or to the left of females. This is consistent with males having a higher risk of developing CML or a shorter latency from initiation to diagnosis of CML. These distinct mechanisms cannot be distinguished using SEER data alone. Therefore, CML risks among male and female Japanese A-bomb survivors are also analyzed. The present analyses suggest that sex differences in CML incidence more likely result from differences in risk than in latency. The simplest but not the sole interpretation of this is that males have more target cells at risk to develop CML. Comprehensive mathematical models of CML could lead to a better understanding of the role of HSCs in CML and other preleukemias that can progress to acute leukemia.
Keywords: Chronic myeloid leukemia (CML), Age or radiation-driven carcinogenesis, Target cells for leukemia initiation, Cancer latency, Life span study (LSS)
Introduction
Chronic myeloid leukemia (CML) is a myeloproliferative neoplasm (MPN) caused by formation of a chimeric oncogene, BCR/ABL, in a pluripotent hematopoietic stem cell (HSC) (Melo and Barnes 2007; Sloma et al. 2010). Because CML is a comparatively well-characterized neoplasm, many mechanistic mathematical models of CML have been developed (Radivoyevitch et al. 2012).
The natural history of untreated CML is to inevitably progress from a chronic phase where differentiation is reasonably well-maintained to blast or acute phase (BP) where differentiation is lost. During BP, CML evolves to acute myeloid (AML) or lymphoid leukemia. Consequently, CML is important as a model of other neoplasms that progress to AML such as other MPNs and myelodys-plastic syndrome. Thus, accurate modeling of CML may have broader implications.
We refer to the HSC in which BCR/ABL initiates CML as the target cell. Here, target cell refers to the cell of origin of both radiation-induced and sporadic CML cases. CML risk is then proportional to the number of CML target cells in the body one latency interval earlier, i.e., at the time BCR/ABL develops. Such a proportionality assumption, often using stochastic models for latency, underlies predictions of how incidence depends on age in several standard models of carcinogenesis (Moolgavkar and Luebeck 2003; Little et al. 2008; Shuryak et al. 2011; Beheshti et al. 2013).
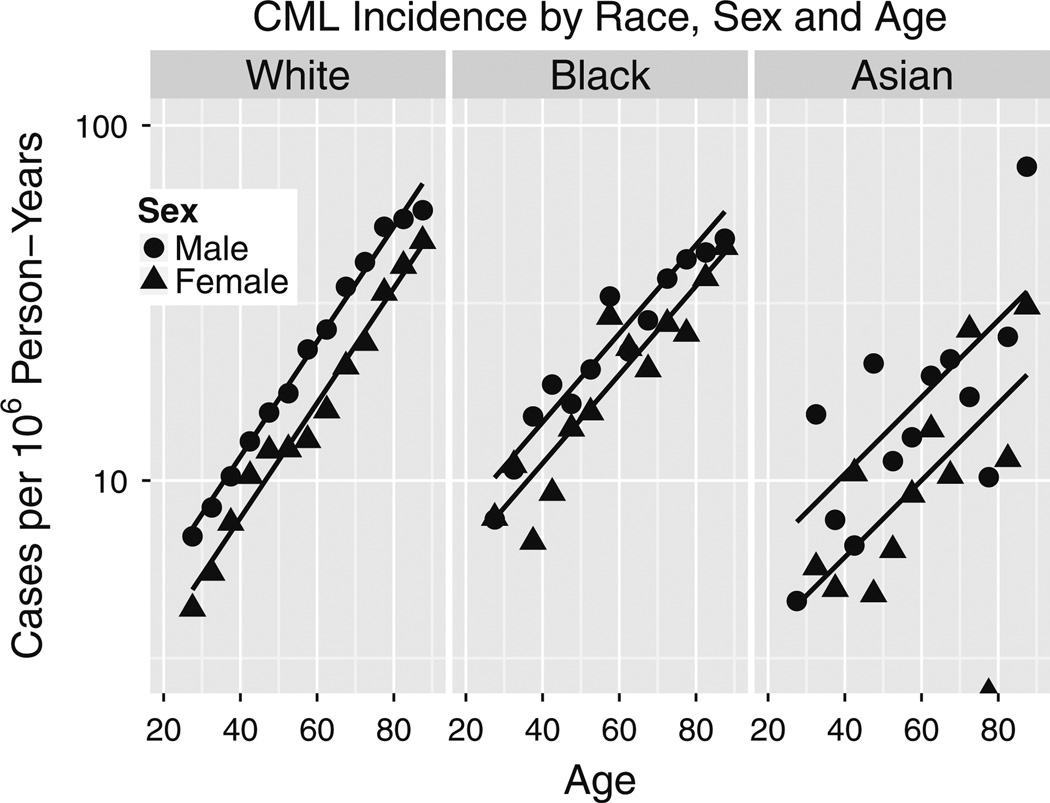
In the US Surveillance, Epidemiology and End Results (SEER) dataset (SEER 2013), among persons ≥25 years, male and female CML background log incidences versus age are parallel (Figs. 1, 4; Table 1). Whether this is because males have an increased risk, shorter latency, or both, is unknown. Using Japanese A-bomb survivor data, it is shown here that increased risk contributes more than shorter latency: increased risks suffice to explain the sex gap in the SEER data, shorter latencies do not, so a risk difference is the most parsimonious explanation of the SEER data.
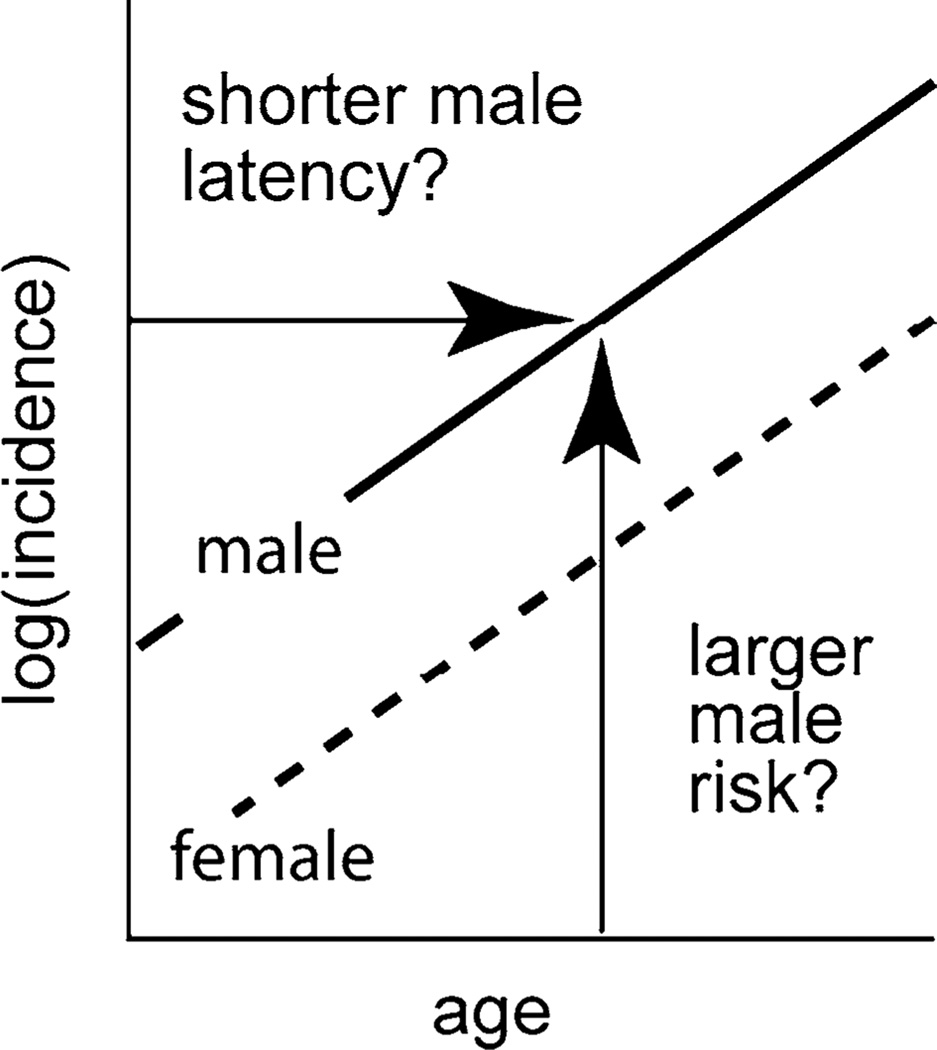
Fig. 1.
If CML log incidences for males and females are linear and parallel, a continuum of interpretations exists that includes: (1) males having shorter latencies between initiation and clinical CML than females but the same risks (i.e., males left of females) and (2) males having higher risks than females but no difference in latency (i.e., males above females)
Fig. 4.
Adult CML incidence age-responses versus race in SEER 2000–2010. Zero CMLs among 75–80 year old Asian females yielded log(0) = −∞ shown as a point on the x-axis. The units of k are 1/year
Table 1.
SEER CML aging rate constants do not differ by sex
| k | 2.5 % | 97.5 % | |
|---|---|---|---|
| White males | 0.0377 | 0.0351 | 0.0403 |
| White females | 0.0370 | 0.0342 | 0.0398 |
| Black males | 0.0282 | 0.0208 | 0.0356 |
| Black females | 0.0294 | 0.0223 | 0.0364 |
| Asian males | 0.0236 | 0.0123 | 0.0347 |
| Asian females | 0.0263 | 0.0130 | 0.0393 |
Units are years−1 and 95 % CI (third and fourth column) are from likelihood profiles
Methods
Data
SEER 1973–2010 data (http://seer.cancer.gov/resources/) for CML in whites, blacks and Asians were used. Neoplasms with sequence numbers <2 were used to avoid cases induced by radiation and/or therapy of a prior neoplasm. Asian cases were defined by SEER race codes 3–97 (American Indian through Pacific Islander not otherwise specified). Corresponding Asian person-years at risk were calculated using SEER race codes 3 (American Indian) and 4 (Asian). For A-bomb survivors, Radiation Effects Research Foundation 1950–2001 data http://www.rerf.jp/library/dl_e/lsshempy.html were used .
Models
For SEER CML incidence data, the following models were used:
| (1a) |
| (1b) |
where E is the number of CML cases expected based on the model, PY is the number of person-years, a is the attained age, s is 1 for females and 0 for males, k is the aging rate constant, Ts is the sex difference in latency in years in the absence of risk differences, ecm is the incidence of CML in males, extrapolated to a newborn (y-intercept in Fig. 1), and ecs is the factor by which female risks are lower than male risks in the absence of latency differences.
These models are equivalent since Ts = − cs/k, but they have different uses: Eq. (1a) yields estimates of the sex difference amplitude parameter cs that are needed to form male-to-female amplitude ratios as M/F = e−cs and Eq. (1b) is used to estimate sex differences in latency Ts. The equivalence of Eqs. (1a) and (1b) restates that sex differences in amplitude are indistinguishable from sex differences in latency if male and female log incidences versus age form parallel lines as in Fig. 1.
Our mathematical model of CML incidence among Japanese A-bomb survivors is
| (2) |
where in addition to the terms defined above, D is the person-year-weighted average radiation dose in Sv (calculated assuming a neutron RBE of 10), t is the average number of years since the exposure and n is 1 for Nagasaki and 0 for Hiroshima.
In this model, the Hiroshima male CML incidence background and radiation-induced amplitudes ec1hm and ec2hm are lowered by the same factors of ecn for Nagasaki and ecs for females, consistent with our hypothesis that background and radiation-induced cases arise in the same target cells. The model’s linear radiation dose response for predominantly low linear energy transfer exposures is counter-intuitive because CML is caused by a chromosomal translocation, but it is supported by mathematical modeling (Radivoyevitch et al. 2001) of data in which BCR and ABL appear to be tethered in a small but relevant proportion of target cells (Kozubek et al. 1999), thus favoring one-track action, and by epidemiological studies (Preston et al. 1994; Hsu et al. 2013).
When fitted to the A-bomb survivor data, our 9-parameter model in Eq. (2) yields an Akaike information criterion (AIC) (Akaike 1974) that is 5.6 less than the AIC of the 11-parameter relative risk model proposed by Hsu et al. (2013). Our model is thus both more parsimonious and better fitting (deviance is less by 1.6) than the Hsu et al. model. Furthermore, for one-hit cancers, additive risk models such as Eq. (2) are more plausible than relative risk models.
To relax the assumption in Eq. (2) that radiation-induced excess CML risk follows a time course shape of te−t/τ, a variant of this model was also explored in which times since the exposure were divided into six intervals and separate amplitude parameters were fitted to each interval for both sexes. These 12 amplitude parameters Fts replaced c2hm, τ, and τs in Eq. (2); cs could not be dropped because it also enters the background term. The resulting CML model,
| (3) |
was used to estimate sex differences in latency and amplitude independently of assuming a waiting-time probability density of as in Eq. (2). Although the deviance of the fit of this model, 746.1, is lower than the deviance of 752.8 of the fit of Eq. (2), this decrease is not low enough to overcome the AIC penalty for nine extra parameters, so this model is not our primary model.
Model fitting
Poisson regression (i.e., maximum likelihood estimation) was used to fit the models [using mle2 of the R (Ihaka and Gentleman 1996) package bbmle]. Incidences were formed as Ei/PYi (predicted) and Oi/PYi (observed) where, for the ith data cell, Ei is the expected number of cases, Oi is the observed number of cases and PYi is the number of person-years. For SEER data, 95 % likelihood profile CI estimates were found using confint of bbmle. For A-bomb data analyses, Wald CIs were used. To map Fts to M/F estimates, normality of the Fts estimates was assumed in 10,000 simulated samplings and the 0.5, 0.025 and 0.975 quantiles were formed. To map Fts into latency difference CIs, the inversion method (Braun and Murdoch 2007) was used to form 2.5 and 97.5 % quantiles. For consistency with deviance and AIC values in (Hsu et al. 2013), the Poisson log-likelihood was approximated as rather than can be dropped since it depends only on data (and not parameters), but dropping Ei is subtle, as it relies on a good fit so that the total number of expected cases approximates the total number observed (i.e., data, here 75; fits typically yielded expected case sums such as 74.999).
Software
R scripts that reproduce our calculations are given in doc\papers\activeMS of our R package SEERaBomb available from http://epbi-radivot.cwru.edu/SEERaBomb/SEERaBomb.html.
Results
ICD-O2 code 9863 misclassifies CMML as CML in SEER data
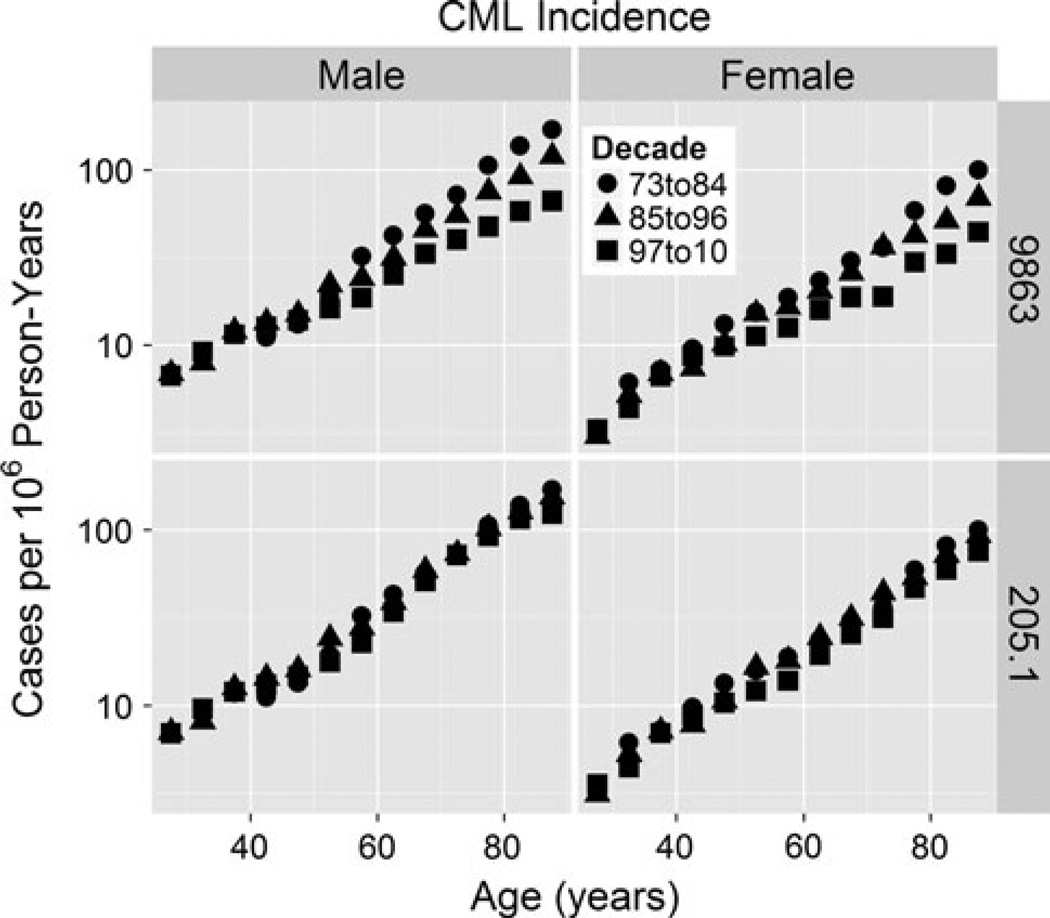
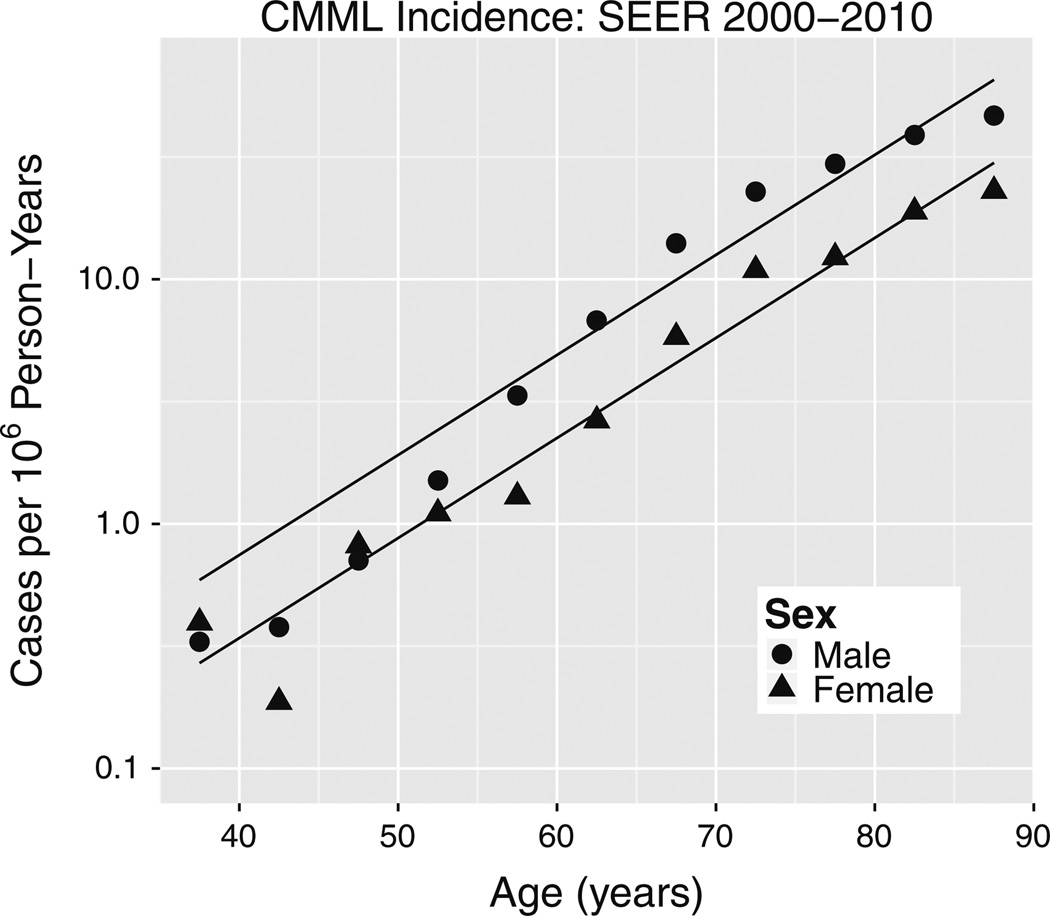
International Classification of Disease-Oncology 2 (ICD-O2) code 9863 is intended to be restricted to CML, but we suspect there may have been mis-coding of cases of chronic myelo-monocytic leukemia (CMML) as 9863 before 1987, with decreasing frequency since then due to increased recognition of CMML as a distinct entity. Our evidence is that although 9863 yields an apparent HSC reserve loss epidemic over the past 35 years, ICD-9 code 205.1 which combines CML with CMML does not (Fig. 2). The alternative explanation is that CMML incidence has been increasing at almost exactly the same rate as decreases in CML incidence. This is unlikely. Consistent with our hypothesis, 9863 incidence trends arise only at older ages in Fig. 2, and fitting Eq. (1a) to CMML (ICD-O3 9945) yields an aging rate constant of k = 0.094 (0.090, 0.099) per year (Fig. 3) that is considerably greater than estimates for CML that are highest among whites at k = 0.037 (0.035, 0.039; Fig. 4) per year. In Fig. 4, CML incidence across age at diagnoses >25 years is higher in males than in females, or is left-shifted in males relative to females. The aging rate constants (k) were the same between sexes (Table 1) but differed between whites (left) and blacks (middle), and between whites and Asians (right). Based on CML k estimate trends for whites (Fig. 5), such CMML mis-coding has been decreasing since 1987. To minimize mis-coding effects, we used SEER data from 2000 to 2010. In this period of time, cases of CML defined by ICD-O2 9863 are also labeled with ICD-O3 codes 9863 (~80 %), 9875 (BCR/ABL-positive, ~ 19 %) or 9876 (BCR/ABL-negative, ~ 1 %). Thus, drops in k estimates in Fig. 5 (where ICD-O2 9863 was used rather than ICD-O3) are not from increases in separate BCR/ABL-negative CML diagnoses. It is concluded that until ICD-O3 9875 is fully adopted, ICD-O2 9863, although imperfect, is the preferred option for SEER CML data analyses.
Fig. 2.
ICD-O2 code 9863 (CML) versus ICD9 code 205.1 (CML + CMML) in the SEER data set
Fig. 3.
Incidence of CMML (ICD-O3 9945) in SEER 2000–2010 data. The fit of Eq. (1a) to this data (albeit a visibly poor fit) yielded a pooled-sex aging rate constant k = 0.094 per year that is significantly greater than k = 0.037 per year for CML in whites in Fig. 4 wherein male and female k estimates were pooled based on Table 1
Fig. 5.
Using ICD-O2 CML code 9863 and only whites in SEER 9 (1973–2010) and SEER 18 (2000–2010), k estimates (of Eq. 1a) have decreased since 1987
CML incidence in SEER 2000–2010
Using ICD-O2 code 9863, CML incidence in SEER 2000–2010 data is shown in Fig. 4. Maximum likelihood parameter estimates of fits of Eqs. (1a) and (1b), followed by their 95 % profile likelihood limits, were as follows: the aging rate constants k were 0.037 (0.035, 0.039) per year for whites, 0.029 (0.024, 0.034) per year for blacks and 0.025 (0.016, 0.033) per year for Asians; the male/female (M/F) amplitude ratios were 1.49 (1.40, 1.59) for whites, 1.31 (1.11, 1.54) for blacks and 1.73 (1.31, 2.28) for Asians; and the latency differences Ts in years were 10.6 (8.9, 12.4) for whites, 9.3 (3.5, 15.5) for blacks and 22.1 (10.6, 39.4) for Asians. Within races, values of male and female aging rate constants k were remarkably similar (Table 1).
Radiation-induced CML incidence dependence on time since exposure
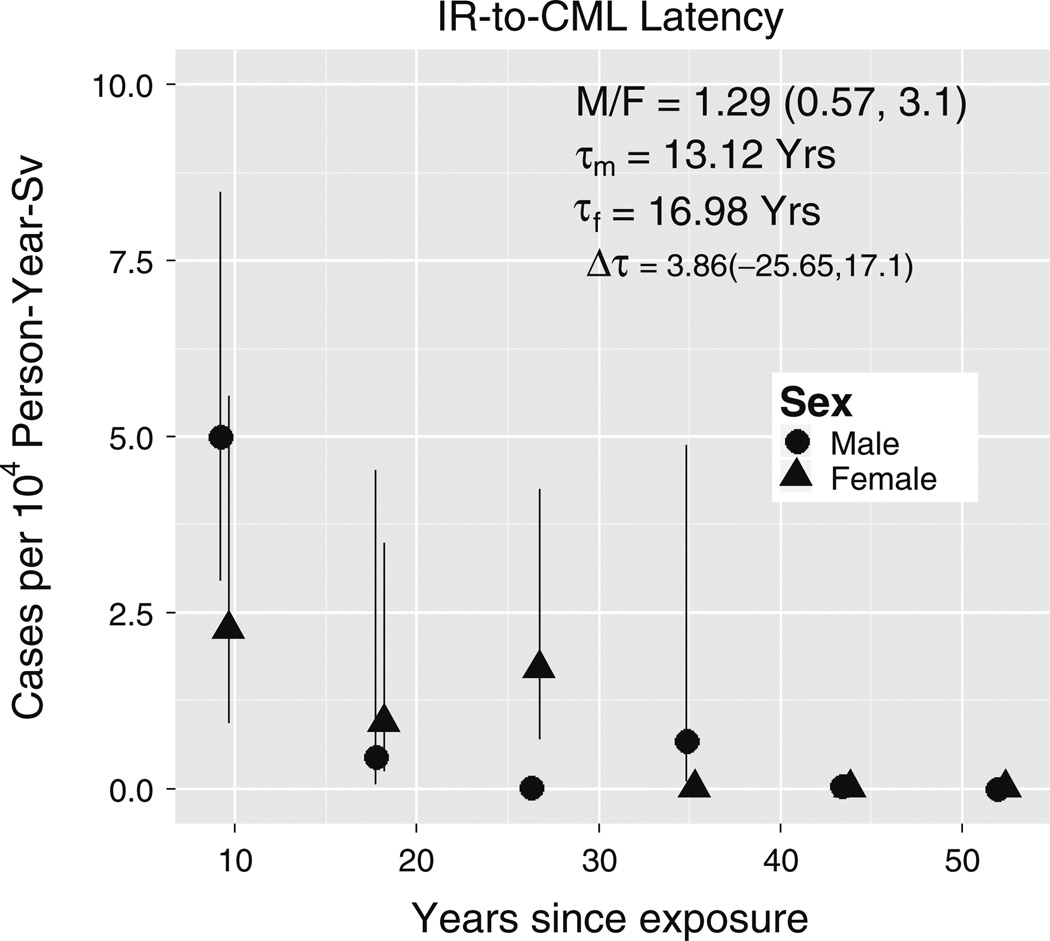
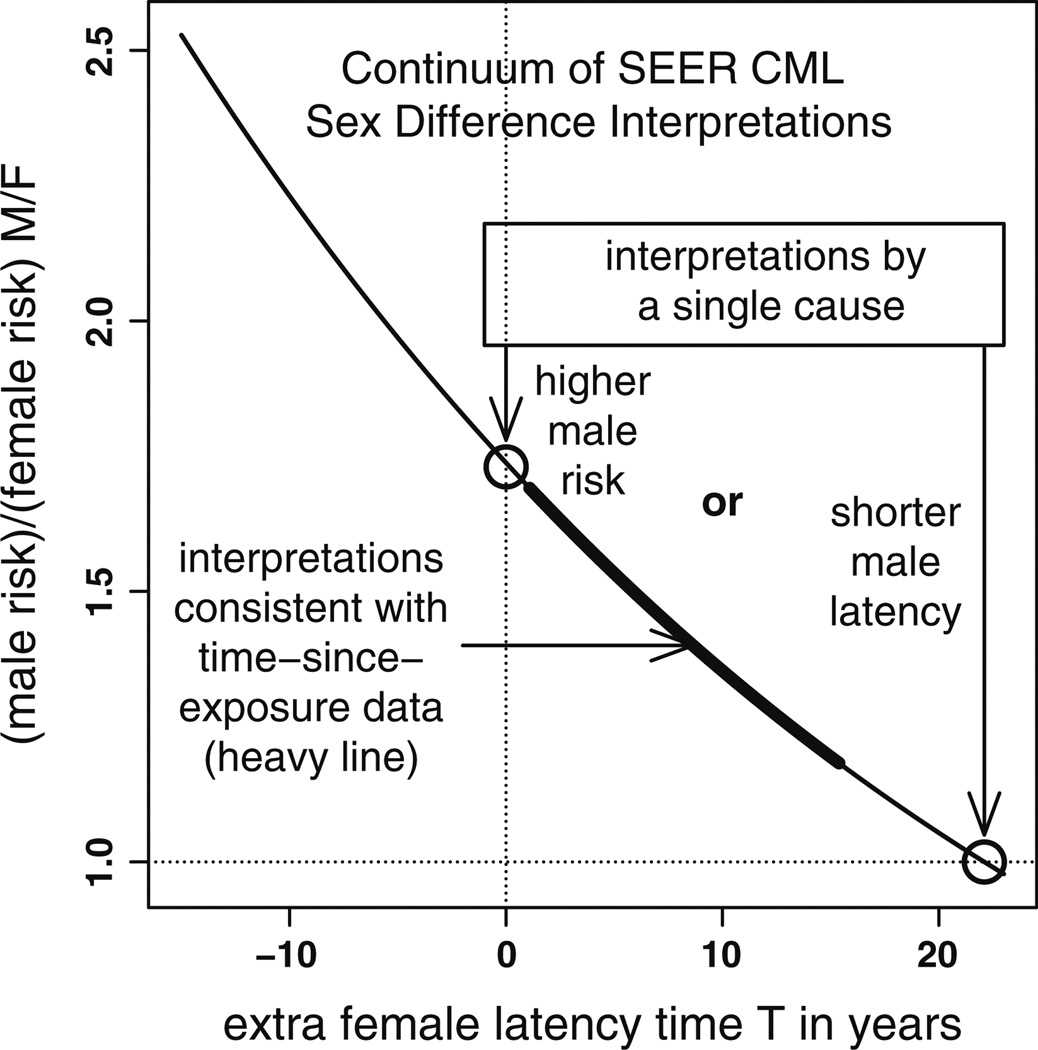
Fitting Eq. (2) to CML incidence among Japanese A-bomb survivors produced the parameter estimates shown in Table 2. The radiation-to-CML waiting-time probability density underlying this model, namely has a mean value of 2τ, so the sex difference in mean latencies is 8.25 (1.09, 15.42) years. Compared to our estimate of Ts of 22.1 (10.6, 39.4) years based on CML incidence among SEER Asians (chosen to represent the A-bomb survivors; Fig. 4), neither mean is within the other estimate’s CI. In contrast, the amplitude sex ratio for the fitted radiation-induced term in Eq. (2) is M/F = 1.55 (0.31, 7.71) which is consistent with the SEER range for Asians of M/F =1.73 (1.31, 2.28; Fig. 4). Similarly, the 12 Fts estimates (shown in Fig. 6) that were obtained by fitting Eq. (3) to Japanese A-bomb survivor data resulted in a latency difference of 3.86 (− 25, 17) years that also differs significantly from 22.1 (10.6, 39.4) years, as neither estimate lies in the other’s CI. These Fts estimates also yielded M/F = 1.28 (0.57, 3.11), whose CI includes M/F = 1.73 in Fig. 4. Thus, although Fig. 6 suggests shorter male versus female latencies, the difference is insufficient to explain SEER data sex differences, and a difference in amplitude must therefore also be invoked. This trade-off is summarized in Fig. 7 wherein the thin curve represents a continuum of interpretations of the SEER Asian CML sex gap in Fig. 4 and the thick curve is the subset consistent with T CI of the fit of Eq. (2) to the Japanese A-bomb survivor data: curve points (T, R) satisfy log(R) = −k (T – Tp) where k = .025 and Tp = 22.1 are for SEER Asians. Of two possible single-factor, simple interpretations (circles on the axes), the thick curve lies closer to the pure form on the y-axis where males have higher risks than females, than to the pure form on the x-axis where the difference is strictly in latency.
Table 2.
Fit of Eq. (2) to A-bomb survivor CML
| Estimate | Std. error | Z value* | Pr(Z)** | |
|---|---|---|---|---|
| c1hm | −12.6832 | 0.7657 | −16.5641 | 0 |
| k | 0.0323 | 0.0122 | 2.6475 | 0.0081 |
| ks | 0.0224 | 0.0127 | 1.7691 | 0.0769 |
| c2hm | −7.301 | 0.7009 | −10.4159 | 0 |
| cn | −0.6187 | 0.316 | −1.9577 | 0.0503 |
| cs | −2.0185 | 0.8192 | −2.4638 | 0.0137 |
| S | 3.4262 | 0.8806 | 3.8909 | 1e–04 |
| τs | 4.1269 | 1.8287 | 2.2568 | 0.024 |
| c2sa | 2.0813 | 0.936 | 2.2235 | 0.0262 |
Z is the standardized distance between the parameter estimate (first column) and zero
Pr(Z) is the probability that a parameter estimate so (or more) extreme would be observed under a null hypothesis that it is distributed normally with zero mean and standard deviation in the second column
Fig. 6.
CML latency. Data points are fitted Fts of Eq. (3). Male and female radiation-to-CML mean waiting times are τm and τf. M/F is the sum of Fts for males divided by the sum for females. Fts error bars are Wald 95 % CI. To improve visibility, a 1-year shift was added to female x-axis values
Fig. 7.
Interpretations of CML sex differences form a curve through two pure (single cause) forms (o): males with shorter latencies than females but the same risks (x-axis point) and males with higher risks than females but no difference in latency (y-axis point). Thin curve mechanisms indistinguishable by SEER data alone. Thick curve points consistent with fit of Eq. (2) to Japanese A-bomb survivor data
Age at exposure
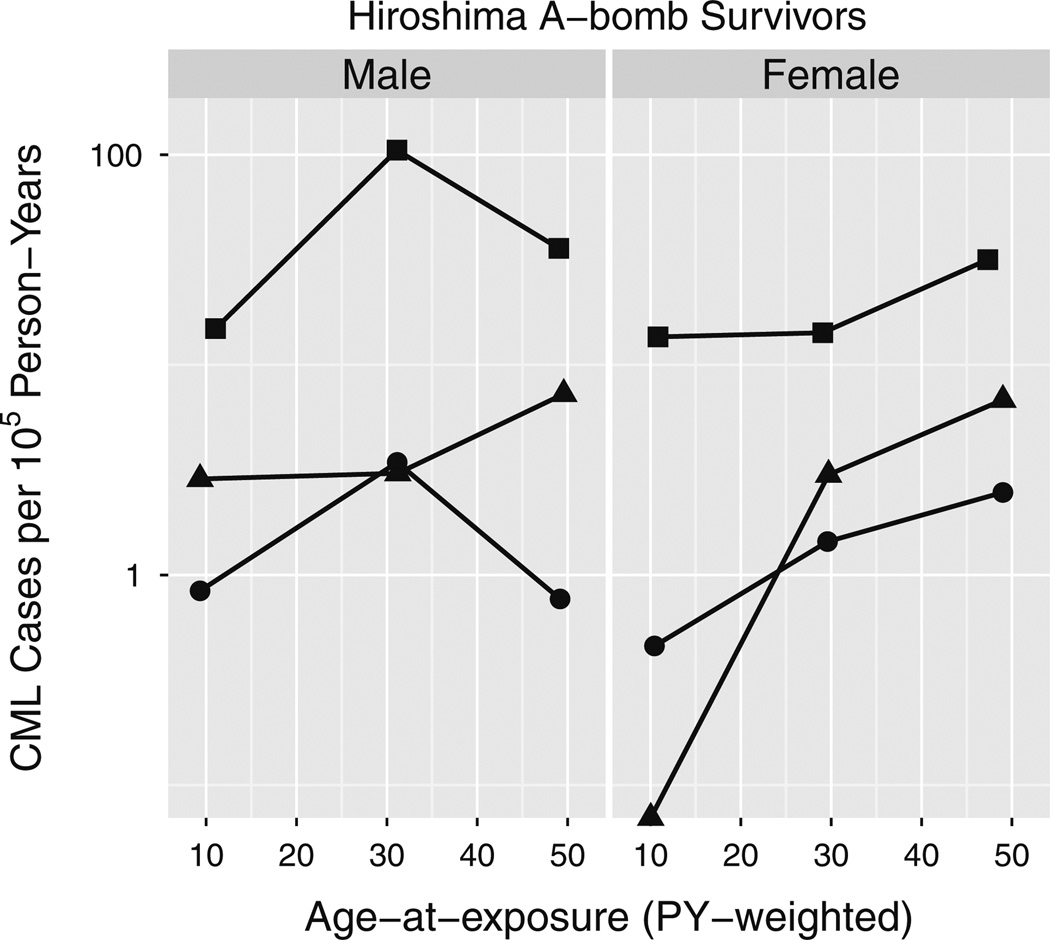
Among Hiroshima A-bomb survivors, CML crude incidence peaks at an exposure age of 30 in high dose males (Fig. 8). To determine whether this is statistically significant and thus perhaps contributing to sex differences in risk, the radiation-induced term in Eq. (2) was multiplied by ec2x(1–s)(1–n)|x –30| where x is the average age at exposure and (1–s)(1–n) is 1 for Hiroshima males and zero otherwise. This increased the AIC of the fitted model by 0.4, so although it improved the fit by lowering the deviance by 1.6, it did not lower it enough to justify the additional parameter (Wald test P = 0.23, likelihood ratio test P = 0.21).
Fig. 8.
CML crude incidence dependence on age at exposure in Hiroshima. Survivors were partitioned into three dose groups, low (D <0.02 Sv; filled circle), medium (0.02 Sv < D < 1 Sv; filled triangle) and high (D > 1 Sv; filled square); and 3 age-at-exposure groups (age < 20, 20 < age < 40 and age > 40). Person-year-weighted averages of age at exposures are plotted on the x-axis and CML cases diagnosed between 1950 and 2001 divided by corresponding person-years are shown on the y-axis. A 0 case point, log(0) = −∞, is shown on the x-axis
Discussion
205.1 versus 9863
Two studies report no change in CML incidence over the past four decades (Bjorkholm et al. 2011; Chen et al. 2013). One used ICD9 code 205.1 to study the incidence of CML in Sweden (Bjorkholm et al. 2011); the other did not state the code used to study CML in the US (Chen et al. 2013), but it too was likely 205.1. Results of these studies are consistent with our analysis in the lower panels of Fig. 2 and with continued coding of CMML as 205.1. In these lower panels, within each of the three oldest age groups, where CMML contributes more to 205.1 than at younger ages, a slight decreasing trend with time is seen in the incidence and is perhaps suggestive of a trend toward less coding of CMML as 205.1.
Risk per target cell
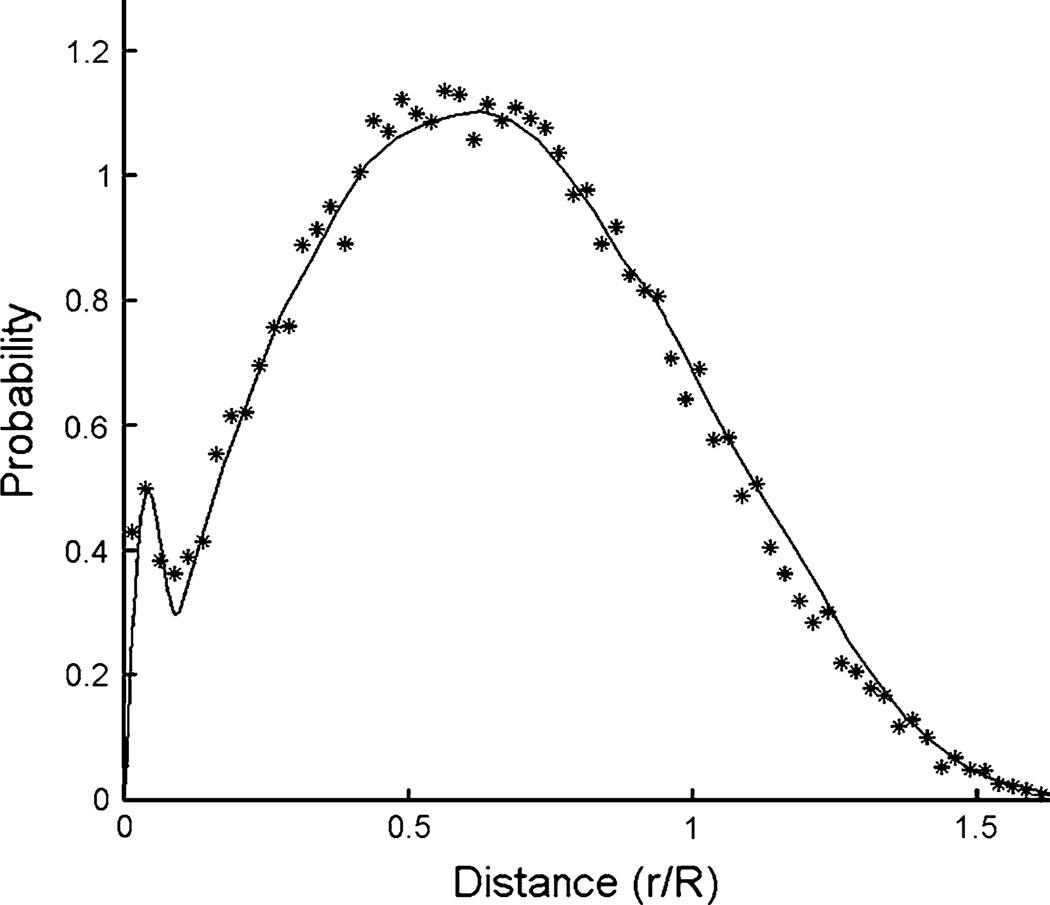
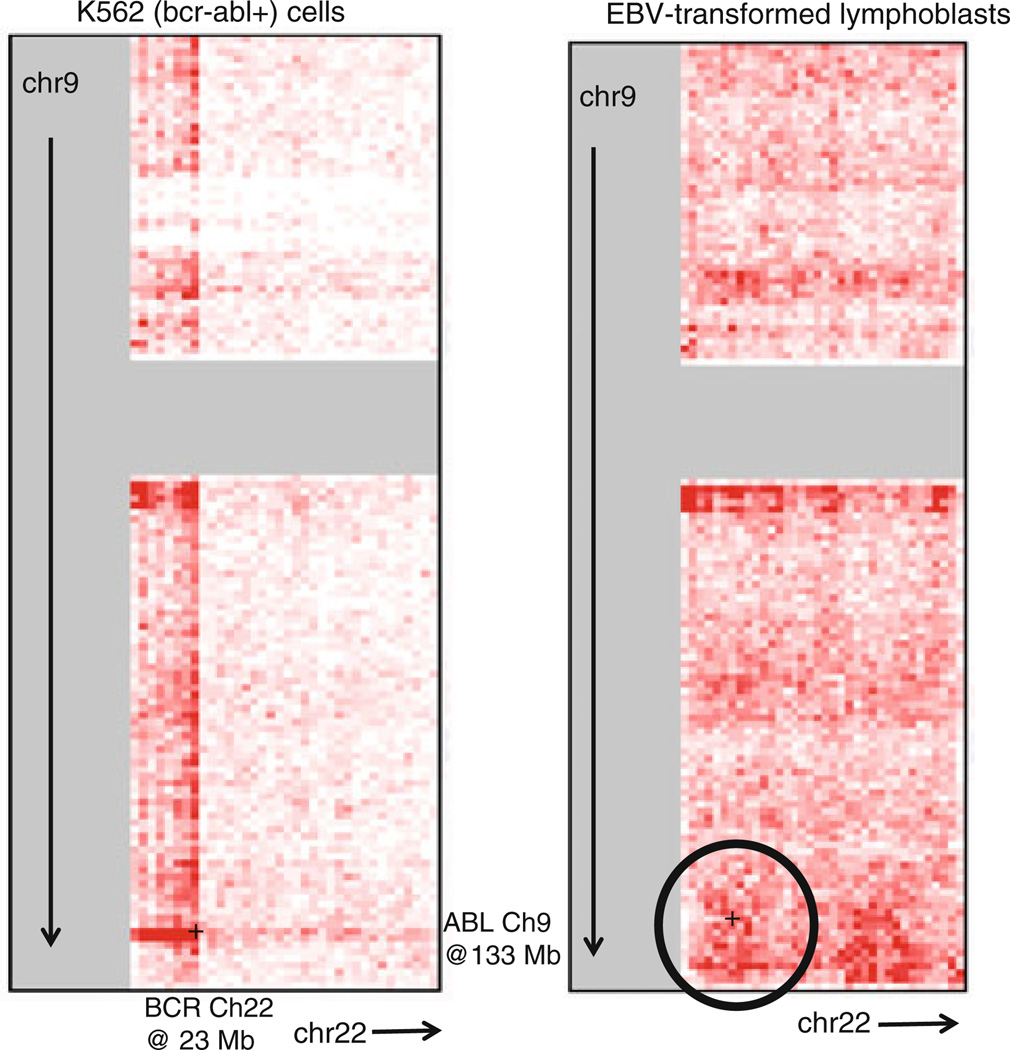
Non-random closeness of BCR and ABL in interphase nuclei was measured by florescence in situ hybridization (FISH) (Kozubek et al. 1999) and modeled (Fig. 9, solid curve) to infer greater risks per target cell than would otherwise be expected (Radivoyevitch et al. 2001): increases in loci closeness lead to increases in risks because a single track is then more likely to create DNA double-strand breaks (DSBs) in both BCR and ABL (this enhances one-track action risks) and because breaks in both loci are then more likely to misrejoin (this enhances risks of both one- and two-track action, and also risks of background DSBs not produced by radiation). CML risk per cell being higher than expected due to loci closeness is also supported by Hi-C DNASeq data (Fig. 10) (Lieberman-Aiden et al. 2009). Male versus female cells were not compared by these methods, but one can speculate that sex differences may exist and thus that besides more target cells in males, an additional possible explanation of sex differences in CML risk is less spatial correlation between BCR and ABL in interphase cell nuclei in females, e.g., perhaps due to the extra, albeit condensed, X-chromosome, or lack of the Y-chromosome.
Fig. 9.
Non-random closeness of BCR and ABL observed by interphase FISH (Kozubek et al. 1999) has been modeled (solid curve) to infer greater risks of BCR/ABL per target cell than otherwise expected (Radivoyevitch et al. 2001). This figure is a modification of Fig. 3 in Radiat Environ Biophys 40 (1):1–9
Fig. 10.
Hi-C DNASeq coverage at touch points between chromosomes 9 and 22. The CML cell line K562 has a BCR/ABL translocation. The lymphoblast cell line is viewed here as a CML target cell surrogate. Circled is a region with above average DNASeq coverage near ABL on chromosome 9 and BCR on chromosome 22. Each bin/pixel is 1 Mbp ×1 Mbp. The underlying heat map, generated via interactions with http://hic.umassmed.edu/heatmap/heatmap.php, does not preexist on this Web site
Target cell populations
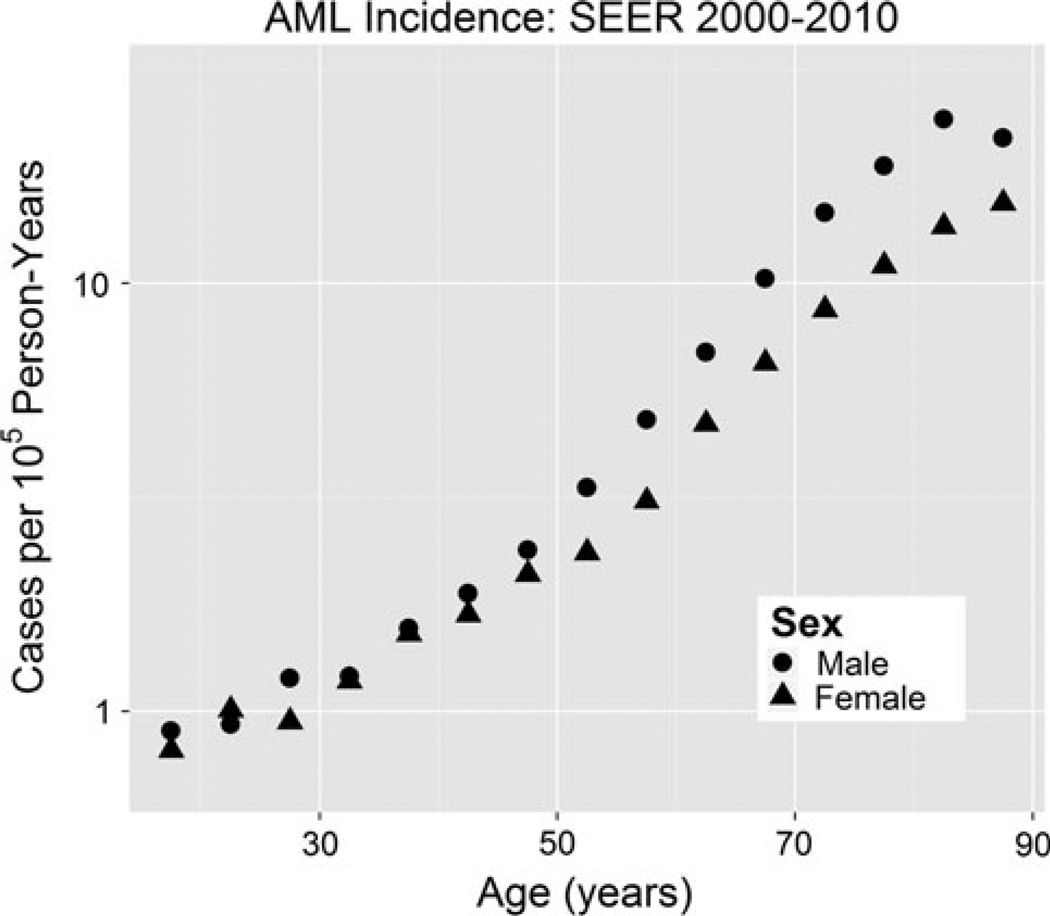
No apparent AML incidence sex differences up to age 50 in Fig. 11 suggest approximately no sex differences in target cell numbers, risk per target cell or latency, assuming cancellations are too unlikely. Since HSC reserve male/ female (M/F) ratios could be 1.7, but M/F for functional cells is expected to be closer to 1, no sex difference in AML target cells at younger ages may imply that these target cells are more lineage-committed than CML target cells. Sex differences in AML at older ages then suggest a shift in AML target cells toward cells that are more similar to HSC reserve cells (i.e., CML target cells).
Fig. 11.
AML (ICD-9 205.0) incidence versus age in SEER 2000–2010 data. Sex differences in incidence are observed only after ages greater than 50 years old
Race differences
Chromosome translocation aging rate constants are lower in Asians than in whites (Sigurdson et al. 2008) consistent with CML k estimates in Fig. 4. Such race differences could result from differences in DNA damage and repair, immune surveillance, or background genotype such as the distribution of human leukocyte antigen alleles or haplo-types defined by single nucleotide polymorphisms.
Hiroshima males versus Nagasaki males and females and Hiroshima females
Nagasaki CML cases are much less common than expected based on data from the Hiroshima A-bomb survivors. We postulated this might be because of HSC reserve depletion by a lymphotrophic virus (Radivoyevitch and Hoel 2000) such as HTLV-1 which causes acute T-cell leukemia lymphoma (ATLL). ATLL is endemic to Kyushu island (site of Nagasaki), and less so to Honshu island (site of Hiroshima). We therefore previously rejected the use of Nagasaki CML data in our modeling (Radivoyevitch and Hoel 2000). In that report, we also rejected using Hiroshima female data based on radiation-to-CML waiting times being too long compared to those in women irradiated for benign gynecological diseases (Inskip et al. 1993). As further evidence that Hiroshima female data may not be representative of CML in general, sex differences in background incidence aging rate constants are not supported by SEER data (Table 1) but are by A-bomb survivor data to the extent that removing ks from Eq. (2) dropped the deviance by 3.2, and a drop of 2 is enough for inclusion in the model when using AICs. It is also counterintuitive that the radiation-induced term increases as ~age2 in females (mostly because of Hiroshima females). Relying on Hiroshima female data is thus a weakness of our approach, but it is also the only source of the hypothesis female CML latencies are longer than male latencies. Because two explanations exist for sex differences in CML risk and none exist for a difference in latency, differences in risk is our favored interpretation. Furthermore, if females have fewer HSCs than males, less competition from normal HSCs should favor shorter, not longer, female CML latencies.
Conclusions
The log of adult CML incidence versus age shows a male line parallel to and either above a female line or left-shifted relative to it (Fig. 4). This is consistent either with greater numbers of CML target cells in males, greater risks per CML target cell in males, shorter CML latencies in males, or mixtures of these possibilities. These mechanistically distinct possibilities are indistinguishable using the SEER dataset alone. It is shown here that A-bomb survivor CML data support a mixed interpretation that lies closer to a pure larger-amplitude view (more target cells and/or greater risk per target cell) than a pure difference-in-latency view. Other mechanisms such as hormonal influences are less likely to yield parallel male–female CML log incidences.
Many neoplasms, including those not regarded as being under sex hormone influences (such as lung cancer), show sex differences in background (and in radiogenic) incidences. The analyses provided here support the notion that in CML, an important cause of this sex difference may be numbers of target cells at risk for neoplastic transformation, greater risk per target cell, or both.
Acknowledgments
We are very grateful to anonymous reviewers of the current and an earlier version of the manuscript for their thoughtful comments. TR, RKS and LH were supported by NCI ICBP U54CA149233. RKS was also supported by DOE DE-SC0001434 Office of Science (BER) US Department of Energy. TR and YS were supported by RO1CA138858. RPG acknowledges support from the NIHR Biomedical Research Centre funding scheme. The content is solely the responsibility of the authors and does not necessarily represent the official views of the National Cancer Institute or the National Institutes of Health. GJ was supported by Grant # 41004 (Ministry of Science and Education, Republic of Serbia). RVT was supported by the Scott Hamilton CARES grant, Cleveland Clinic Seed Support and an ACS pilot grant. This report makes use of data obtained from the Radiation Effects Research Foundation (RERF), Hiroshima and Nagasaki, Japan. RERF is a public interest foundation funded by the Japanese Ministry of Health, Labour and Welfare (MHLW) and the US Department of Energy (DOE), the latter in part through DOE award DE-HS0000031 to the National Academy of Sciences. The conclusions in this report are those of the authors and do not necessarily reflect the scientific judgment of RERF or its funding agencies.
Footnotes
Conflict of interest RPG is a part-time employee of Celgene Corp.
Contributor Information
Tomas Radivoyevitch, Email: txr24@case.edu, Department of Epidemiology and Biostatistics, School of Medicine, Case Western Reserve University, Cleveland, OH 44106, USA; Department of Translational Hematology and Oncology Research, Taussig Cancer Institute, Cleveland Clinic, Cleveland, OH, USA.
Gradimir M. Jankovic, Clinic of Haematology, Faculty of Medicine, University Clinical Center of Serbia, Belgrade, Serbia
Ramon V. Tiu, Department of Translational Hematology and Oncology Research, Taussig Cancer Institute, Cleveland Clinic, Cleveland, OH, USA
Yogen Saunthararajah, Department of Translational Hematology and Oncology Research, Taussig Cancer Institute, Cleveland Clinic, Cleveland, OH, USA.
Robert C. Jackson, Pharmacometrics Ltd., Cambridge, UK
Lynn R. Hlatky, Center of Cancer Systems Biology, GeneSys Research Institute, Tufts University School of Medicine, Boston, MA, USA
Robert Peter Gale, Section of Haematology, Division of Experimental Medicine, Department of Medicine, Imperial College London, London, UK.
Rainer K. Sachs, Center of Cancer Systems Biology, GeneSys Research Institute, Tufts University School of Medicine, Boston, MA, USA Department of Mathematics, University of California at Berkeley, Berkeley, CA, USA.
References
- Akaike H. A new look at the statistical model identification. IEEE Trans Autom Control. 1974;19:716–723. [Google Scholar]
- Beheshti A, Sachs RK, Peluso M, Rietman E, Hahnfeldt P, Hlatky L. Age and space irradiation modulate tumor progression: implications for carcinogenesis risk. Radiat Res. 2013;179(2):208–220. doi: 10.1667/RR3100.1. [DOI] [PubMed] [Google Scholar]
- Bjorkholm M, Ohm L, Eloranta S, Derolf A, Hultcrantz M, Sjoberg J, Andersson T, Hoglund M, Richter J, Landgren O, Kristinsson SY, Dickman PW. Success story of targeted therapy in chronic myeloid leukemia: a population-based study of patients diagnosed in Sweden from 1973 to 2008. J Clin Oncol. 2011;29(18):2514–2520. doi: 10.1200/JCO.2011.34.7146. [DOI] [PMC free article] [PubMed] [Google Scholar]
- Braun WJ, Murdoch DJ. A first course in statistical programming with R. Cambridge: Cambridge University Press; 2007. [Google Scholar]
- Chen Y, Wang H, Kantarjian H, Cortes J. Trends in chronic myeloid leukemia incidence and survival in the United States from 1975 to 2009. Leuk Lymph. 2013;54(7):1411–1417. doi: 10.3109/10428194.2012.745525. [DOI] [PMC free article] [PubMed] [Google Scholar]
- Hsu WL, Preston DL, Soda M, Sugiyama H, Funamoto S, Kodama K, Kimura A, Kamada N, Dohy H, Tomonaga M, Iwanaga M, Miyazaki Y, Cullings HM, Suyama A, Ozasa K, Shore RE, Mabuchi K. The incidence of leukemia, lymphoma and multiple myeloma among atomic bomb survivors: 1950–2001. Radiat Res. 2013;179(3):361–382. doi: 10.1667/RR2892.1. [DOI] [PMC free article] [PubMed] [Google Scholar]
- Ihaka R, Gentleman R. R: a language for data analysis and graphics. J Comput Gr Stat. 1996;5:299–314. [Google Scholar]
- Inskip PD, Kleinerman RA, Stovall M, Cookfair DL, Hadjimichael O, Moloney WC, Monson RR, Thompson WD, Wactawski-Wende J, Wagoner JK. Leukemia, lymphoma, and multiple myeloma after pelvic radiotherapy for benign disease. Radiat Res. 1993;135(1):108–124. [PubMed] [Google Scholar]
- Kozubek S, Lukasova E, Mareckova A, Skalnikova M, Kozubek M, Bartova E, Kroha V, Krahulcova E, Slotova J. The topological organization of chromosomes 9 and 22 in cell nuclei has a determinative role in the induction of t(9,22) translocations and in the pathogenesis of t(9,22) leukemias. Chromosoma. 1999;108(7):426–435. doi: 10.1007/s004120050394. [DOI] [PubMed] [Google Scholar]
- Lieberman-Aiden E, van Berkum NL, Williams L, Imakaev M, Ragoczy T, Telling A, Amit I, Lajoie BR, Sabo PJ, Dorschner MO, Sandstrom R, Bernstein B, Bender MA, Groudine M, Gnirke A, Stamatoyannopoulos J, Mirny LA, Lander ES, Dekker J. Comprehensive mapping of long-range interactions reveals folding principles of the human genome. Science. 2009;326(5950):289–293. doi: 10.1126/science.1181369. [DOI] [PMC free article] [PubMed] [Google Scholar]
- Little MP, Heidenreich WF, Moolgavkar SH, Scho¨llnberger H, Thomas DC. Systems biological and mechanistic modelling of radiation-induced cancer. Radiat Environ Biophys. 2008;47(1):39–47. doi: 10.1007/s00411-007-0150-z. [DOI] [PMC free article] [PubMed] [Google Scholar]
- Melo JV, Barnes DJ. Chronic myeloid leukaemia as a model of disease evolution in human cancer. Nat Rev Cancer. 2007;7(6):441–453. doi: 10.1038/nrc2147. [DOI] [PubMed] [Google Scholar]
- Moolgavkar SH, Luebeck EG. Multistage carcinogenesis and the incidence of human cancer. Genes Chromosom Cancer. 2003;38(4):302–306. doi: 10.1002/gcc.10264. [DOI] [PubMed] [Google Scholar]
- Preston DL, Kusumi S, Tomonaga M, Izumi S, Ron E, Kuramoto A, Kamada N, Dohy H, Matsuo T, Matsui T. Cancer incidence in atomic bomb survivors. Part III. Leukemia, lymphoma and multiple myeloma, 1950–1987. Radiat Res. 1994;137(2 Suppl):S68–S97. [PubMed] [Google Scholar]
- Radivoyevitch T, Hoel DG. Biologically-based risk estimation for radiation-induced chronic myeloid leukemia. Radiat Environ Biophys. 2000;39(3):153–159. doi: 10.1007/s004110000055. [DOI] [PubMed] [Google Scholar]
- Radivoyevitch T, Kozubek S, Sachs RK. Biologically based risk estimation for radiation-induced CML. Inferences from BCR and ABL geometric distributions. Radiat Environ Biophys. 2001;40(1):1–9. doi: 10.1007/s004110100088. [DOI] [PubMed] [Google Scholar]
- Radivoyevitch T, Hlatky L, Landaw J, Sachs RK. Quantitative modeling of chronic myeloid leukemia: insights from radiobi-ology. Blood. 2012;119(19):4363–4371. doi: 10.1182/blood-2011-09-381855. [DOI] [PMC free article] [PubMed] [Google Scholar]
- SEER. Surveillance, Epidemiology, and End Results (SEER) Program www.seer.cancer.gov Public-Use Data (1973–2010), National Cancer Institute, DCCPS, Surveillance Research Program, Cancer Statistics Branch, released April 2013, based on the November 2012 submission. 2013
- Shuryak I, Sachs RK, Brenner DJ. A new view of radiation-induced cancer. Radiat Prot Dosim. 2011;143(2–4):358–364. doi: 10.1093/rpd/ncq389. [DOI] [PMC free article] [PubMed] [Google Scholar]
- Sigurdson AJ, Ha M, Hauptmann M, Bhatti P, Sram RJ, Beskid O, Tawn EJ, Whitehouse CA, Lindholm C, Nakano M, Kodama Y, Nakamura N, Vorobtsova I, Oestreicher U, Stephan G, Yong LC, Bauchinger M, Schmid E, Chung HW, Darroudi F, Roy L, Voisin P, Barquinero JF, Livingston G, Blakey D, Hayata I, Zhang W, Wang C, Bennett LM, Littlefield LG, Edwards AA, Kleinerman RA, Tucker JD. International study of factors affecting human chromosome translocations. Mutat Res. 2008;652(2):112–121. doi: 10.1016/j.mrgentox.2008.01.005. [DOI] [PMC free article] [PubMed] [Google Scholar]
- Sloma I, Jiang X, Eaves AC, Eaves CJ. Insights into the stem cells of chronic myeloid leukemia. Leukemia. 2010;24(11):1823–1833. doi: 10.1038/leu.2010.159. [DOI] [PubMed] [Google Scholar]


